Int. J. Electrochem. Sci., 7 (2012) 2201 - 2213
International Journal of
ELECTROCHEMICAL
SCIENCE
www.electrochemsci.org
Graphene-Modified Electrode for the Selective Determination of
Uric Acid Under Coexistence of Dopamine and Ascorbic Acid
Mingyong Chao*,Xinying Ma and Xia Li
Department of Chemistry and Chemical Engineering, Heze University, Heze 274015, PR China.
*
E-mail: [email protected]
Received: 10 January 2012 / Accepted: 8 February 2012 / Published: 1 March 2012
A graphene-modified electrode for selective determination of uric acid was prepared. The electro-chemical behaviours of uric acid at the graphene-modified electrode was investigated by cyclic voltammetry and the results showed that the graphene film on electrode exhibited excellent electrocatalytic activity for the electrochemical oxidation of uric acid in phosphate buffer solution (pH 4.0). Using the graphene-modified electrode, uric acid under coexistence of dopamine and ascorbic acid was successfully determined with good peak separation. The values of linearity range, correlation coefficient and limit of detection for uric acid were 2.00×10⁻⁶ to 1.20×10⁻⁴ mol/L, 0.9975 and 6.00×10
-7
mol/L respectively. The graphene-modified electrode is of excellent sensitivity, selectivity and stability, and has been successfully used for determination of uric acid in human urine.
Keywords: Modified Electrode, Graphene, Electrochemistry, Uric acid
1. INTRODUCTION
these molecules have close oxidation potentials at bare electrode, determination of UA in body fluids using bare electrode becomes rather difficult.
Graphene is an allotrope of carbon, whose structure is one-atom-thick planar sheets of sp2 -bonded carbon atoms that are densely packed in a honeycomb crystal lattice [14]. Graphene possesses outstanding characteristics such as having a large specific surface area, excellent conductivity, and strong mechanical strength. It has been used to prepare a new generation of electrodes for electrochemical studies [15-19].
In this paper, a convenient and highly selective graphene-modified glassy carbon electrode (GME) is described. Using the GME, an electrochemical sensor was fabricated and its electrochemical properties were investigated. Selective determination of UA by this sensor in the presence of high concentrations of DA and AA was demonstrated. It was found that the modified electrode not only exhibited strong electrocatalytic activity for oxidation of UA, DA and AA, but also resolved their voltammetric responses into three well-defined peaks. This sensor showed excellent sensitivity and selectivity in determination of UA in human urine. Compared with reported electrochemical methods for determination of DA, this method gives much wider linearity range, providing greater convenience in sample analysis because the UA concentrations in biological samples are normally not known.
2. EXPERIMENTAL
2.1 Reagents and solutions
Graphite powder (<20 μm) was obtained from Qindao Graphite Corporation (Qingdao, China). Sodium borohydride was obtained from Tianjin Daofu Chemical New Technique Development Co., Ltd. (China). Dopamine (DA) was purchased from the National Institute for the Control of Pharmaceutical and Biological Products (Beijing, China). Ascorbic acid (AA) and uric acid (UA) were purchased from Beijing Chemical Factory (China). The 4.0×10⁻³
mol/L UA standard solution was prepared by dissolving uric acid in 0.1 mol/L sodium carbonate. All other reagents used in this study were of AR grade purchased from Beijing Chemical Reagent Company (Beijing China). The phosphate buffer solution (PBS) (pH 4.0) was prepared by mixing 0.2 mol/L disodium hydrogen phosphate and 0.1 mol/L citric acid. All aqueous solutions were prepared using double distilled water.
2.2 Apparatus
microscope (JEOL, Japan). All electro-chemical experiments were carried out using a three-electrode system consisted of a working electrode (a bare or graphene-modified glassy carbon electrode, 3 mm in diameter) a counter electrode (a platinum wire electrode), and a reference electrode (a Ag/AgCl electrode). Acidity was measured by a PHS-3B Precision pH Meter (Shanghai, China), and all sonication was done using a KQ-100 Ultrasonic Cleaner (Kunshan, China).
2.3 Preparation of the Nano-graphene and Graphene Modified Electrode
Nano-graphene power was prepared according to a literature reported procedure. Briefly, Graphite powder was oxidized with potassium permanganate in sulfuric acid to give graphite oxide, which was then dispersed in water by sonication to give a colloidal solution. Reduction with sodium borohydride and washing work-up gave a Nano-graphene power [20-23]. Then a graphene-modified electrode was prepared as follows, 5 mg of the nano-graphene powder was dispersed in 10mL of double distilled water with ultrasonication for 20min to give a black graphene suspension. A bare glassy carbon electrode (GCE, 3.8 mm in diameter) was polished with abrasive paper (grit 2000) and wet alumina powder (0.05µm) before it was used, rinsed ultrasonically with 1:1 HNO3, absolute ethanol, and distilled water, respectively, and dried under infrared lamp. Then 4 µL of the graphene suspension was cast on the surface of GCE and dried under infrared lamp to give a graphene-modified electrode.
2.4 Electrochemical measurement
Using a GME as working electrode, a Ag/AgCl electrode as reference electrode and a platinum as counter electrode, cyclic voltammetry was used in the electrochemical measurements with a scan rate of 120 mV/s. Cyclic voltammograms (CVs) were obtained by immersing the GME in UA standard solution buffered by phosphates and scanning in the potential range from 0.2 V to 0.9 V. Upon completion of each scan, the modified electrode was placed in a blank buffer solution and cyclic scan was continued until no peak comes out, then the electrode was washed with water and dried with filter paper for reuse.
3. RESULTS AND DISCUSSION
3.1 Characterization of graphite/graphene/GME
as well as defects in graphene can improve the water solubility of graphene, making its dispersion in water more stable.
1000 1500 2000 2500 3000 3500 0
20 40 60 80 100
1389
2987 37363903
1558
2918
3450 37633898
b a
T
rans
m
ittanc
e /
T
%
[image:4.596.182.416.115.298.2]Wave number s/ cm-1
Figure 1. IR spectra of (a) graphite and (b) graphene
Table 1. Functional groups of graphene and their corresponding wave numbers
Functional group Wave number σ /cm-1
-OH 3450
C=C 1558
phenyl 2800-3000
C-O-C 1110-1200
500 1000 1500 2000 2500 3000 3500 0
2000 4000 6000 8000 10000
G D
Inte
nsity/a.u.
Raman shift/cm-1
[image:4.596.97.479.372.718.2]
Figure 3. SEM image of graphene-film modified GCE
[image:5.596.121.476.396.684.2]
Figure 2 shows the Raman spectrum of graphene, which shows the D band at 1347 cm-1 that arose from sp3-hybridized carbon as well as the G band at 1597 cm-1 that shows in-phase vibration of the graphite lattice. The relative intensity ratio of the D and G lines provides a sensitive measure of the disorder and crystallite size of the graphitic layers. Figure 3 shows the SEM image of the graphene film on the GCE, revealing the crumple and wrinkle structure of the graphene film. Figure 4 shows the TEM image of graphene nanosheets, revealing its mono- or few-layer planar sheet-like morphology.
3.2 Optimization of GME
Oxidation peak currents are greatly influenced by the amount of graphene deposited on glassy carbon electrode. When 4 μL of graphene suspension of different concentration are deposited on the surface of GCE, experiments show that greater graphene concentration gives higher UA oxidation peak current at the modified electrode. The oxidation peak current of UA reach maximum when the concentration of graphene is 0.5 mg/mL. Concentration of graphene greater than 0.5 mg/mL causes the graphene coating on electrode surface excessively thick. Due to the excessive thickness of graphene coating, the catalyst can not be employed efficiently and the diffusion of catalytic substrate to electrode surface becomes more difficult, thus the oxidation peak current is reduced. In our experiments, 4 μL of graphene suspension with a concentration of 0.5 mg/mL was used in the preparation of graphene-modified electrode.
3.3 Electrochemical behaviour of uric acid at bare and graphene-modified electrode
0.1 0.2 0.3 0.4 0.5 0.6 0.7 0.8 0.9 1.0 -80
-60 -40 -20 0 20 40
b a
i
/
A
E / V
[image:6.596.170.429.474.668.2]
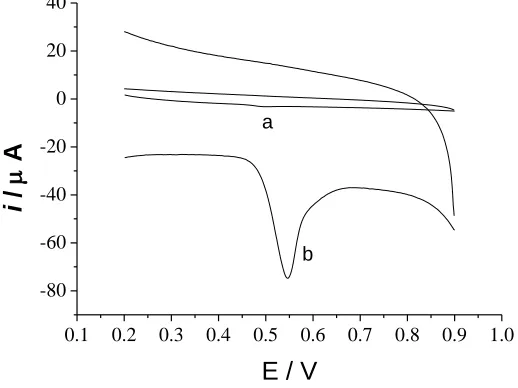
Cyclic voltammograms of UA at the bare electrode and the graphene modified electrode are shown in Figure 5, which shows that the current response of UA at the bare electrode is weak, Epa =
0.50V, ipa = -0.52µA and the current response of UA at the modified electrode is much better, Epa =
0.54V, Epa = -51.55µA.
Oxidation peak current of UA at the modified electrode is almost 100 times of the current response at the bare electrode, which indicates that graphene film can significantly catalyze the UA oxidation process and the electron transfer rate of UA in graphene film is much faster.
-0.2 0.0 0.2 0.4 0.6 0.8 1.0
-100 -50 0 50 a b AA DA DA UA i / A
[image:7.596.182.416.222.387.2]E / V
Figure 6. Cyclic voltammograms of 1.0×10⁻⁵ mol/L uric acid , 1.0×10⁻⁴ mol/L dopamine and 1.0×10⁻³ mol/L ascorbic acid at the bare electrode (1) and the graphene modified (2) in pH 4.0 PBS.
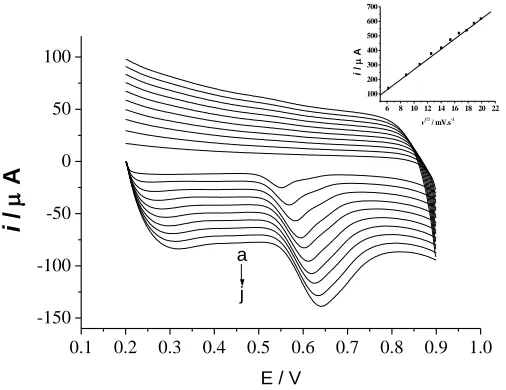
0.1 0.2 0.3 0.4 0.5 0.6 0.7 0.8 0.9 1.0 -150 -100 -50 0 50 100 j a
6 8 10 12 14 16 18 20 22 100 200 300 400 500 600 700 i / A
v1/2 / mV.s-1
i
/
A
E / V
[image:7.596.172.425.457.652.2]
This may be attributed to the special nano-mesh structure of graphene, which has a large specific surface area and a large number of defects.
These defects are resulted from the redox preparation process and serve as highly active reaction sites, making the UA activity at the modified electrode significantly improved and the response signal greatly increased. From the CVs of UA at the modified electrode, we can see that there is no reduction peak of UA, only its oxidation peak is observed, which demonstrates that the reaction is irreversible.In a pH 4.0 phosphate buffer solution, UA, AA (100) and DA (10) are shown as one broad oxidation peak at the bare electrode as shown in Figure 6(a), while at the graphene modified electrode, their oxidation peaks were effectively separated as shown in Figure 6(b), the oxidation peak potentials of AA, DA and UA are 0.11V, 0.38V and 0.54V respectively. The separation of peak potentials is 0.43V and 0.16V for AA-UA and DA-UA respectively, which is large enough to determin UA individually. This demonstrates that UA can be successfully determined in presence of dopamine and ascorbic acid when using the modified electrode. While in some reported literatures for selective determination of UA [9, 24, 6], the interference of DA was not discussed.
Figure 7 gives the cyclic voltammetry curves of UA at different scan rates, which shows that the oxidation peak potential shift positively with scan rate increasing, and the oxidation peak current is proportional to the square root of scan rates when scan rates are between 40 and 400mV/s. The linear equation is ipa (A) = –7.99×10⁻⁶ –3.50×10⁻⁶v1/2 (mV/s), r = 0.9989. This shows that the electrode
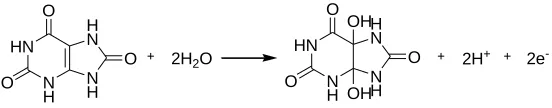
reaction is controlled by the diffusion process, which is the typical characteristics of irreversible reactions. Kumar et al. reported the same electrode process of UA at polymerized luminol film modified electrode [25]. Possible oxidation mechanism of UA at electrode is shown in Scheme 1.
Main product of the electrochemical oxidation is 4,5-dihydroxyluric acid, which is unstable and mostly decomposes into allantoin. This explains why the cathodic peak is not obvious in cyclic voltammogram [26].
HN
N H
N H H N O
O O
2H2O
HN
N H
N H H N O
O O
OH
2H+ 2e
-OH
Scheme 1. Electrochemical oxidation mechanism of UA.
3.4 Optimization of Conditions for the determination of UA 3.4.1 Effect of Solution pH
[image:8.596.161.437.507.561.2]
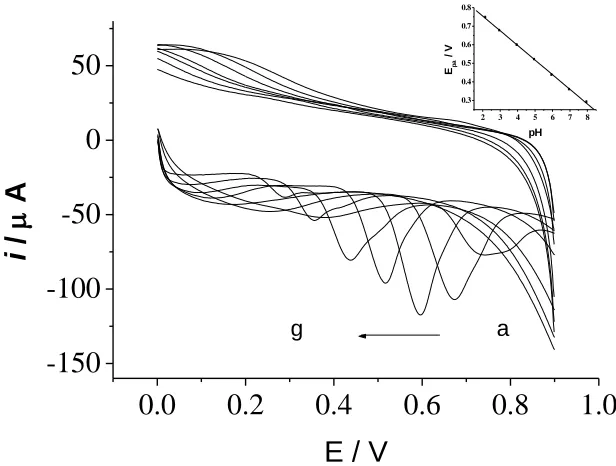
solution of various pH, results show that with pH increasing, UA oxidation peak shifts negatively, which indicates that the UA oxidation reaction involves the protons, UA oxidation peak potential changes linearly depending on a pH from 2.2 to 8.0, and the equation is Epa = 0.91 – 0.079pH, r =
0.9996. In a pH from 2.2 to 8.0 and a potential from 0.2 to 0.9, oxidation peak current firstly increases with increasing pH and reaches maximum at pH 4.0, then decreases as pH continues to increase, which also indicates that the UA oxidation reaction involves the protons. Therefore, a pH 4.0 buffer solution was chosen. In reported literatures, maximum electric currents of UA at nafion-coated carbon paste electrode [6] and PtAu hybrid film modified electrode [27] were also obtained at pH 4.0.
0.0
0.2
0.4
0.6
0.8
1.0
-150
-100
-50
0
50
2 3 4 5 6 7 8
0.3 0.4 0.5 0.6 0.7 0.8
Epa
/
V
pH
g a
i
/
A
[image:9.596.144.452.243.476.2]E / V
Figure 8. Cyclic voltammograms of 4.0×10⁻⁵ mol/L UA at different pH. Each of the letters from a to g correspond to pH of 2.2, 3.0, 4.0, 5.0, 6.0, 7.0 and 8.0, respectively. Inset is the plot of the peak potential of UA versus pH value of buffer solutions.
3.4.2 Effect of Stirring Time
Stirring time exerts great influence on UA oxidation peak current at the modified electrode. Measurements were made with various stirring time at a UA concentration of 2.0×10⁻⁵
3.5 Linearity range and detection limit
In pH 4.0 phosphate buffer solution, The oxidation peak current of UA at the graphene-modified electrode is linearly proportional to its concentration in a range from 2.00×10⁻⁶
to 1.20×10⁻⁴ mol/L (Figure 9), with a correlation coefficient of 0.9975 and a detection limit of 6.00×10⁻⁷ mol/L. The linear regression equation is iPa (A) = 5.64×10⁻⁶ + 1.98C.
0.1 0.2 0.3 0.4 0.5 0.6 0.7 0.8 0.9 1.0 -250 -200 -150 -100 -50 0 50
0 20 40 60 80 100 120 0 50 100 150 200 250 i / A
c / 10-6
mol.L-1 k a i / A
[image:10.596.178.417.194.370.2]E / V
Figure 9. Cyclic voltammograms of UA at GME at different concentration. Each of the letters from a a to k correspond to concentrations of 2.00×10-6,4.00×10-6, 6.00×10⁻⁶, 8.00×10⁻⁶, 1.00×10⁻⁵, 2.00×10⁻⁵, 4.00×10⁻⁵, 6.00×10⁻⁵, 8.00×10-5,1.00×10-4 and 1.20×10⁻⁴, respectively (in mol/L). Inset is the plot of the oxidation peak current versus concentration of UA.
Table 2. Comparison of this work and literature reported ones
Electrode Modifier used pH Detection limit (M) Linearity range(M) Ref
glassy carbon polymerized luminol 7.0 2.0×10⁻⁶ 3.0×10⁻⁵ - 1.0×10⁻³ [25] carbon paste palladium nanoparticle-loaded
carbon nanofibers
4.5 7.0×10⁻⁷ 2.0×10⁻⁶ - 2.0×10⁻⁴ [28]
glassy carbon hollow nitrogen-doped carbon microspheres
7.0 4.0×10⁻⁸ 5.0×10⁻⁶ - 3.0×10⁻⁵ [29]
graphite functionalized-graphene 7.0 4.5×10⁻⁷ 1.75×10⁻⁶ - 9.0×10⁻⁵ [30] phosphorylated
zirconia-silica composite electrode
methylene blue 7.4 3.7×10⁻⁶ 2.2×10⁻⁵ - 3.5×10⁻⁴ [31]
[image:10.596.32.564.506.707.2]
To evaluate our research results, the linearity range and detection limit in this work are compared with literature reported ones in table 2. These data show that the detection limit is comparable or better in most cases than the reported ones for electrochemical determination of UA at the surface of different modified electrodes. The linearity range in this work is much better than most reported ones, which provides convenience in analysis because the concentrations of biological samples are normally not known.
3.6 Interference Studies
Potential interference to UA response signal from common substances contained in urine was investigated in pH 4.0 phosphate buffer solution under optimized conditions. When the relative error is less than ±5%, no interferences were observed in the presence of glucose (1000), sucrose (1000), citrate (1000), urea (500), K+ (500), Na+ (500), Mg2+ (200) and Zn2+ (200).
4. ANALYTICAL APPLICATION
Fresh urine sample (25.00 mL) was added to a 100mL volumetric flask, followed by the addition of Na2CO3 solution (2.00 mL), then the solution in the flask was diluted to mark with double
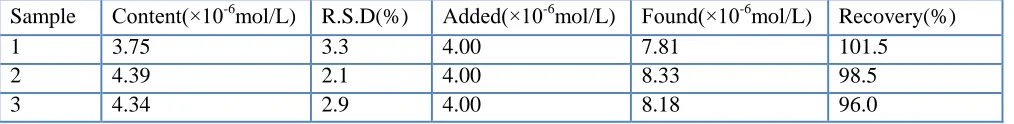
[image:11.596.48.555.481.543.2]distilled water. A certain amount of the above prepared solution was taken and diluted with pH 4.0 PBS, and then measurement was made in accordance with the electrochemical measurement procedure. Recoveries were calculated with oxidation peak current value and results are shown in Table 3.
Table 3. Determination results of NE in injection (n=6)
5. CONCLUSION
A graphene-modified electrode for selective detection of uric acid was prepared. In comparison with the bare electrode, the graphene-modified electrode exhibited excellent electro-catalytic activity towards UA electrochemical oxidation, which may be attributed to the large specific surface area of graphene and the large number of defects in graphene. These defects serve as highly active sites for reaction, making UA reaction at the graphene-modified electrode significantly improved and electrochemical response signal greatly increased; The oxidation peak current of UA at the graphene-modified is linearly proportional to its concentration in a range from 2.00×10⁻⁶ to 1.20×10⁻⁴ mol/L; The
Sample Content(×10-6mol/L) R.S.D(%) Added(×10-6mol/L) Found(×10-6mol/L) Recovery(%)
1 3.75 3.3 4.00 7.81 101.5
2 4.39 2.1 4.00 8.33 98.5
modified electrode is of excellent sensitivity, selectivity and stability. Using the graphene-modified electrode, UA was determined in the presence of dopamine and ascorbic acid with good peak seperation. The newly established method for determination of UA has been successfully used in human urine analysis.
ACKNOWLEDGEMENTS
This work was financially supported from a grant from the National Natural Science Foundation of Shan Dong Province (No.2R2009BM003) and the Shandong City High School Science and Technology Fund Planning Project of (J10LB64).
References
1. V. V. S. E. Dutt and H. A. Mottola, Anal Chem, 46 (1974) 1777
2. M. H. Abdel-hay, M. H. Barary, M. A. Elsayed and E. M. Hassan, Anal Lett, 24 (1991) 1517 3. T. M. C. C. Filisetti-Cozzi and N. C. Carpita, Anal Biochem, 197 (1991) 157
4. S. P. Ferraris, H. Lew and N. M. Elsayed, Anal Biochem, 195 (1991) 116 5. J.-M. Zen, Analyst, 123 (1998) 1345
6. J.-M. Zen and C.-T. Hsu, Talanta, 46 (1998) 1363 7. Z. Gao and H. Huang, Chem Commun, (1998) 2107
8. Z. Gao, K. S. Siow, A. Ng and Y. Zhang, Anal Chim Acta, 343 (1997) 49 9. K. Shi and K.-K. Shiu, Electroanalysis, 13 (2001) 1319
10. J.-M. Zen, Y.-J. Chen, C.-T. Hsu and Y.-S. Ting, Electroanalysis, 9 (1997) 1009
11. E. Gonzalez, F. Pariente, E. Lorenzo and L. Hernandez, Anal Chim Acta, 242 (1991) 267 12. F. H. Keedy and P. Vadgama, Biosens Bioelectron, 6 (1991) 491
13. M.-J. Rocheleau and W. C. Purdy, Electroanalysis, 3 (1991) 935 14. A. K. Geim and K. S. Novoselov, Nat Mater, 6 (2007) 183
15. S. Alwarappan, A. Erdem, C. Liu and C.-Z. Li, J Phys Chem, 113 (2009) 8853 16. S. Guo, D. Wen, Y. Zhai, S. Dong and E. Wang, ACS Nano, 4 (2010) 3959 17. X. Kang, J. Wang, H. Wu, J. Liu, I. A. Aksay and Y. Lin, Talanta, 81 (2010) 754 18. F. Li, J. Chai, H. Yang, D. Han and L. Niu, Talanta, 81 (2010) 1063
19. M. Zhou, Y. Zhai and S. Dong, Anal Chem, 81 (2009) 5603 20. L. Fu, H. Liu, Y. Zou and B. Li, Carbon, 4 (2005) 10
21. W. S. Hummers and R. E. Offeman, J Am Chem Soc, 80 (1958) 1339 22. Y. Si and E. T. Samulski, Nano Lett, 8 (2008) 1679
23. L. Tang, Y. Wang, Y. Li, H. Feng, J. Lu and J. Li, Adv Funct Mater, 19 (2009) 2782
24. J.-S. Ye, Y. Wen, W. De Zhang, L. M. Gan, G. Q. Xu and F.-S. Sheu, Electroanalysis, 15 (2003) 1693
25. S. A. Kumar, H.-W. Cheng and S.-M. Chen, Electroanalysis, 21 (2009) 2281 26. W. Dong, J. Li and J. Guo, Chem Res and Appl, 20 (2008) 1235
27. S. Thiagarajan and S.-M. Chen, Talanta, 74 (2007) 212
28. J. Huang, Y. Liu, H. Hou and T. You, Biosens Bioelectron, 24 (2008) 632
31. J. Argüello, V. L. Leidens, H. A. Magosso, R. R. Ramos and Y. Gushikem, Electrochim Acta, 54 (2008) 560
32. R. Cui, X. Wang, G. Zhang and C. Wang, "Sens Actuators, B ", (2011)
33. L. Lin, J. Chen, H. Yao, Y. Chen, Y. Zheng and X. Lin, Bioelectrochemistry, 73 (2008) 11 34. R. P. da Silva, A. W. O. Lima and S. H. P. Serrano, Anal Chim Acta, 612 (2008) 89
35. Y. Li and X. Lin, "Sens Actuators, B ", 115 (2006) 134 36. P. Kalimuthu and S. A. John, Talanta, 80 (2010) 1686