Int. J. Electrochem. Sci., 9 (2014) 1264 - 1272
International Journal of
ELECTROCHEMICAL
SCIENCE
www.electrochemsci.orgSelective Determination of Dopamine, Ascorbic Acid and Uric
Acid at SDS-MWCNTs Modified Glassy Carbon Electrode
Jian Zhang1,2, Zhixin Zhu1, Jianling Zhu1, Kechang Li1,3*, Shucheng Hua2,*
1
College of Chemistry, Jilin University, Changchun, 130021, Jilin, China
2
Department of Respiration, The First Hospital of Jilin University, Changchun, 130021, Jilin, China
3
Department of chemical engineering & applied chemistry, University of Toronto, ON M5S 3E5, Canada
*
E-mail: [email protected]
Received: 31 October 2013 / Accepted: 9 December 2013 / Published: 5 January 2014
In this paper, dopamine(DA) and uric acid(UA) were selectively determined using cyclic voltammetry and differential pulse voltammetry in the presence of ascorbic acid(AA) by a glass carbon electrode modified with sodium dodecyl sulfate(SDS) and multi-walled carbon nanotubes(MWCNTs). The composite electrode exhibited excellent selectivity and sensitivity toward DA, UA and AA. It was found that the three anodic peaks can be well separated compared with the bare glassy carbon electrode. Using differential pulse voltammetry, AA, DA and UA were determined in phosphate buffer solutions at pH 7, results display that AA, DA and UA were obtained in the linear range of 4.0×10⁻⁴-
3.5×10⁻³
mol/L, 8.0×10⁻⁷-8.0×10⁻⁵ mol/L and 4.0×10⁻⁶-3.0×10⁻⁵ mol/L, the detection limits were 3.0×10⁻⁶, 1.0×10⁻⁸ and 4.0×10⁻⁸
mol/Lfor AA, DA and UA respectively.
Keywords: Dopamine, uric acid, ascorbic acid, modified electrode, cyclic voltametry, differential pulse voltammetry
1. INTRODUCTION
the end product of catabolism of the purine nucleosides. Elevated level of uric acid in the blood is clinically pertinent to gout, renal failure, leukemia and lymphoma, as well as other pathological conditions [4].
In biological systems, AA usually coexists with DA in extracellular fluid at a high concentration level, nearly 1000 times higher than DA. Similarly, UA and AA is co-present in biological fluids such as blood and urine. Moreover, DA, AA and UA can be oxidized at practically the same potential at bare electrodes, resulting in the peak overlapping as well as poor response resolution in DA determination.5 Because of these three compounds are often coexist in biological fluids, and the coexisting compounds in the biological samples may cause great interferences on the bare working electrode, it is necessary that a simple, fast, selective and sensitive method can be improved. Several methods for simultaneous determination of DA, AA and UA by electrochemical method have been reported. Noble metals such as Pt, Au, Ag, metal alloys, metal nanoparticles, carbon pastes and glassy carbon electrodes have been extensively used in the determination of these compounds [6-12].
Recently, carbon nanotubes have been used as functional nano materials because of their distinctive physical and chemical properties. Application of CNTs in biological and medical fields, particularly in electrochemical biosensors, it has been rapidly becoming electrode material due to its high surface area, unique structures, excellent electrical conductivity, ultra-strong mechanical properties and high stability[13,14].
Surfactants are amphiphilic molecules with a polar hydrophilic head at one end and a long hydrophobic tail at the other. The use of surfactants for electrode modification has previously been investigated for DA determination[15-17]. It is reported that the cationic cetyltrimethylammonium bromide, tetraoctylammonium bromide and cetylpyridinium chloride can enable the separation and simultaneous determination of AA and DA at micro molar levels in pharmaceutical samples. Sodium dodecyl sulfate (SDS), as a masking agent or molecular spacer, has been used to perform the quantitative determination of DA in the presence of AA using differential pulse voltammetry (DPV) and a carbon paste electrode[18].
There are several reports for simultaneous determination of AA, DA and UA. Most of these methods are time-consuming, complicated and usually require specialized instruments. The current article presents the application of SDS as a discriminating agent for the resolution of DA, UA and AA. The SDS-MWCNTs/GCE exhibited better sensitivity and selectivity for DA and UA detection in the presence of high concentration of ascorbic , which had a potential application in biological and chemical fields.
2. EXPERIMENT
2.1 Regent and materials
from Acros Organics(New Jersey, USA). MWCNTs were purchased from Shenzhen Nanometer Gang Co., Ltd. Other chemicals were pure analytical grade and used as received without any further purification. Phosphate buffer solutions were prepared in 0.1M KH2PO4 and K2HPO4. All is deionized
water solution. High purity nitrogen was used for deaeration.
2.2 Apparatus
All electrochemical experiments were performed with a CHI660B electrochemical workstation (Shanghai Chenhua Co., China). And a conventional three-electrode system was employed. A bare glassy carbon (GC), SDS-MWCNTs/GC electrode were used as working electrodes, a saturated Ag/AgCl electrode as reference electrode and a platinum wire as auxiliary electrode. All potentials reported were versus the saturated Ag/AgCl electrode.
2.3 Generation of oxygen functionalities on MWCNTs
The oxygen functionalities on the surface of MWCNTs can improve their electrochemical properties, and long MWCNTs (several microns in length) present diffusion. These mass transport restrictions can be minimized with short MWCNTs. The most popular reported method to cut MWCNTs is acid oxidation [19-21]. As-received MWCNTs were first oxidized in a hot acid solution of HNO3 and H2SO4 (1: 3 by volume) at 90 ℃ for 8h to remove impurities and to generate surface
functional groups. Then it was allowed to cool down to room temperature and the resulting slurry was filtered, washed thoroughly with deionized water, and dried at 90 ℃ in a vacuum oven for 20 h.
2.4 Preparation of the SDS-MWCNTs/GC modified electrode
Glassy carbon (GC) electrodes (3 mm diameter) were carefully polished with 1.0, 0.3 and 0.05 μm alumina slurry in sequence to a mirror, washed the electrode with deionized water, then sonicated in H2SO4, ethanol, and deionized water in turn. The acidified MWCNTs and SDS were dissolved and
sonicated in deionized water, Lastly 0.5 μl slurry containing SDS and MWCNTs was dropped onto the surface of the electrodes, and dried under infrared light. Then SDS-MWCNTs modified glassy carbon electrode was obtained.
3. RESULTS and DISCUSSION
3.1 Electrochemical characterization of bare GCE and SDS-MWCNTs/GCE electrode
Figure 1 showed the cyclic voltammograms of bare GCE and SDS-MWCNTs/GCE electrode
-0.4 -0.2 0.0 0.2 0.4 0.6 0.8
-80 -60 -40 -20 0 20 40 60
I / A
E / V
Figure 1. Cyclic voltammograms of GCE (red line) and SDS-MWCNTs/GCE(black line) in 0.1 M KCl solution containing 5 mM [Fe(CN)6]3-/4- at scan rate of 50 mV/s
Compared with the bare GCE, the peak currents increased significantly at the modified electrode. The peak current at SDS-MWCNTs/GC electrode is larger than that at the bare glassy carbon electrode, which indicate that the introduction of SDS and MWCNTs play an important role in the increase of the electroactive surface area and provide the conducting bridges for the electron-transfer of Fe(CN)63−/4−. It showed that the SDS-MWCNT/GC electrode could act as a promoter to
[image:4.596.153.428.100.308.2]enhance the electrochemical reaction[13,15].
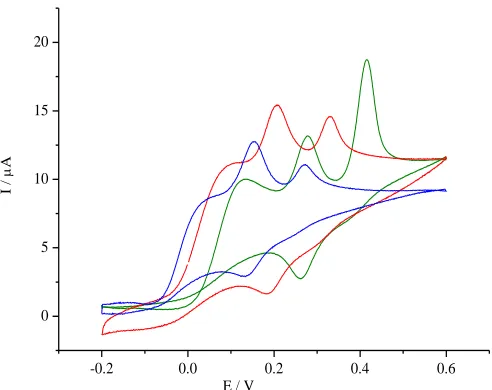
Figure 2 and Figure 3 showed the cyclic voltammograms of DA, UA, AA and mixture of these ternary molecules on bare GCE and SDS-MWCNTs/GCE, respectively.
-0.2 0.0 0.2 0.4 0.6 0.8 -1.0
-0.5 0.0 0.5 1.0 1.5 2.0 2.5 3.0 3.5
I
/
A
E/V AA
DA UA
A
-0.2 0.0 0.2 0.4 0.6
-15 -10 -5 0 5 10 15 20 25
I
/
A
E/V
AA DA
UA
B
[image:4.596.79.494.531.680.2]
-0.2 0.0 0.2 0.4 0.6 -10
0 10 20
I
/
A
E/V AA
DA UA
Figure 3. Cyclic voltammograms of mixture of DA, UA and AA on bare GCE (red line) and SDS-MWCNT/GCE(black line); scan rate: 50 mV/s
Compared with the bare GCE, the peak currents of DA, UA and AA increased significantly at the modified electrode. Figure 2(B) show the peak potential of AA shifts to a more negative oxidation side and the difference in peak potential between DA and AA was found to be 200 mV. It is obvious from Figure 3 that only one broad voltammetric signal for DA, AA and UA was observed at approximately 0.31 V, so bare GCE failed to resolve the voltammetric response of AA, DA and UA while SDS-MWCNTs/GCE succeeded in discriminating the overlapped voltammetric response. Three distinct peaks at 3.6, 202.8 and 335.7 mV for AA, DA and UA were observed at SDS-MWCNTs/GCE. The peak separation was large enough to estimate DA in presence of large excess of AA and UA.
3.3 Influence of buffer pH
-0.2 0.0 0.2 0.4 0.6
0 5 10 15 20
I
/
A
E / V
[image:5.596.176.395.83.249.2] [image:5.596.167.413.517.712.2]
The electrochemical response of DA, UA and AA at SDS/MWCNTs/GCE was generally dependent on pH[22]. The voltammograms of the ternary molecules were recorded at 0.1 M phosphate buffer solution of different pH by cyclic voltammetric method.
The pH of the supporting electrolyte has a significant influence on the electrochemical behaviors of DA, UA and AA with the changes of the redox peak currents and potentials. Using multi-walled carbon nanotubes and SDS modified electrode under comparable conditions, achieved effective separation of the oxidation peaks of dopamine, ascorbic acid and uric acid. However, the results indicated that at pH 7 the separation of oxidation peak for simultaneous determination of AA, DA and UA more obvious compare to other pH, so pH 7.0 was used for the further investigation.
3.4 Effect of the concentration of SDS on the performance of SDS-MWCNTs/GC
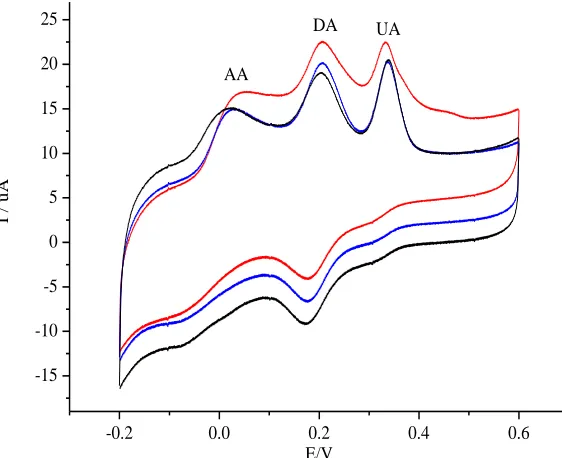
Figure 5 showed the cyclic voltammograms of SDS/MWCNTs/GCE modified with different concentration of SDS. The concentration of the surfactant was increased from 3 mg/mL to 8 mg/mL placed on to the surface, which is known as the immobilization method.
-0.2 0.0 0.2 0.4 0.6
-15 -10 -5 0 5 10 15 20 25
I
/
u
A
E/V AA
DA UA
Figure 5. Cyclic voltammograms recordings of 1×10⁻³ M AA,3×10-5 M DA,8.0×10-5 M UA at SDS/MWCNTs/GCE with different concentration of SDS, 3 mg/mL(blue line), 5 mg/mL(red line), 8 mg/mL(black line), scant rate: 50 mV/s.
[image:6.596.139.420.367.596.2]
3.5 Simultaneous determination of AA, DA and UA
-0.2 0.0 0.2 0.4 0.6 20 40 60 80 100 120 140
0 500 1000 1500 2000 2500 3000 3500 10 20 30 40 50 60 70 80 90 I/ uA C/uM I / A E/V A a i
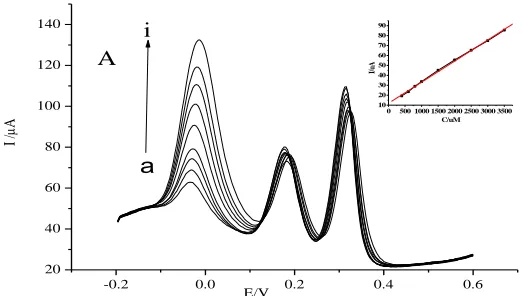
Figure 6A. DPVs of AA at SDS/MWCNTs/GCE in the presence of 8 μM DA and 60 μM UA in 0.1 M PBS (pH 7.0). AA concentrations (from a to i): 400, 600, 800, 1000, 1500, 2000, 2500, 3000 and 3500 μM
Since differential pulse voltammetry (DPV) has much higher current sensitivity and better resolution than cyclic voltammetry, it was used in the oxidation of AA, DA and UA in a mixture[11]. We carefully examined the oxidation current of DA and UA at the SDS-MWCNTs/GCE in the presence of various concentration of AA. Figure 6A shows the differential pulse voltammograms (DPVs) at various concentrations of AA at SDS-MWCNTs/GCE. The concentration of AA was varied from 4.0 × 10⁻⁴ M to 3.5 ×10⁻³ M in phosphate buffer of pH 7.0. The calibration plot of Ipa versus
concentration of AA (inset of Figure 6A). showed a linear dynamic range of 4.0 × 10⁻⁴ to 3.5 × 10⁻³ M with R2= 0.99922. The linear regression equation for this range is Ipa = 11.89585+0.02124C(inset of
Fig.7A). The detection limit of AA at this electrode is found to be 3.0 × 10⁻⁶ M(S/N=3).
Similarly, the effect of various concentrations of DA and UA are carefully examined by differential pulse voltammetric response.
-0.2 0.0 0.2 0.4 0.6
0 5 10 15 20 25 30 35 40 45 50 55 60 I / A E/V B a i
[image:7.596.155.419.107.255.2] [image:7.596.176.410.528.708.2]
Figure 6B shows the differential pulse voltammograms (DPVs) at various concentrations of DA at SDS/MWCNTs/GCE. The concentration of DA was varied from 8.0 × 10⁻⁷ M to 8.0 ×10⁻⁵ M in phosphate buffer of pH 7.0.
The calibration plot of Ipa versus concentration of DA (Figure 6B) showed a linear dynamic
range of 8.0 × 10⁻⁷ to 8.0 × 10⁻⁵ M with R2= 0.9996. The linear regression equation for this range is Ipa
=-0.10551+0.99109C (inset of Figure 6B). The detection limit of DA at this electrode is found to be 1.0 × 10⁻⁸ M(S/N=3).
-0.2 0.0 0.2 0.4 0.6
0 5 10 15 20 25 30 35 40
0 5 10 15 20 25 30
0 5 10 15 20 25 30 35
Ip
/u
A
C/uM
I
/
A
E/V
C
a
j
Figure 6C. DPVs of UA at SDS/MWCNTs/GCE in the presence of 800 μM AA and 6 μM DA in 0.1 M PBS (pH 7.0). UA concentrations (from a to j):4.0, 6.0, 8.0, 10.0, 12.0, 15, 18, 20, 25 and 30 μM.
Figure 6C shows the differential pulse voltammograms (DPVs) at various concentrations of UA at SDS-MWCNTs/GCE. The concentration of UA was varied from 4.0 × 10⁻⁶ M to 3.0 ×10⁻⁵ M in phosphate buffer of pH 7.0.
The calibration plot of Ipa versus concentration of UA (Figure 6C) showed a linear dynamic
range of 4.0 × 10⁻⁶ to 3.0 × 10⁻⁵ M with R2= 0.99929. The linear regression equation for this range is Ipa =-1.46298+1.17458C (inset of Figure 6C). The detection limit of UA at this electrode is found to be
4.0 × 10⁻⁷ M(S/N=3).
The linear range of DA are from 1~100 μM by sodium dodecyl sulfate-modified electrochemical paper-based analytical device[15] and 5.0× 10⁻⁶ to 5.0× 10⁻⁶ M using single-walled carbon nanotubes modified electrode [22] respectively.
[image:8.596.169.427.214.402.2]
4. CONCLUSION
This process of fabricating SDS-MWCNTs/GCE was simple without using expensive equipments and complicated methods. The resulting material was characterized by means of CV and DPV. The SDS-MWCNTs/GCE was easily fabricated and could be used to detect DA, UA and AA. The newly developed SDS-MWCNTs/GCE presented a number of attractive features such as high sensitivity, excellent stability, good reproducibility and selectivity.
This paper has indicated that the multi-walled carbon nanotubes SDS-MWNTs modified electrode has higher selective and sensitive to determination of UA and DA in phosphate buffer solutions at pH 7.0. So a simple, fast, selective and sensitive method can be improved for DA and UA determination.
ACKNOWLEDGEMENTS
This work was supported by China Scholarship Council,the National Natural Science Foundation of China (No.20803030), the Science and Technology Development Plan of Jilin Province, China (No.20130521003JH) and the Fundamental Research Funds for the Central Universities.
References
1. T. Thomas, R.J. Mascarenhas, B.E. Kumara Swamy, P. Martis, Z. Mekhalif, B.S. Sherigara, Colloids and Surfaces B: Biointerfaces, 110 (2013) 458.
2. C. Andre, I. Castanheira, J. M. Cruz, Trends in Food Science & Technology 21 (2010) 229. 3. P. Kalimuthu, S. A. John, Electrochimica Acta, 55 (2009) 183.
4. J.C. Ndamanisha, L. Guo, Biosensors and Bioelectronics, 23 (2008) 1680.
5. J. Balamurugan, S.M. Senthil Kumar, R. Thangamuthu, A. Pandurangan,J. Molecular Catalysis A: Chemical, 372 (2013) 13.
6. M.R. Majidi, R.F. Baj, A.Naseri, Central European J. Chem., 11(2013) 1172.
7. T. Thomas, R.J.Mascarenhas, P. Martis, Materials Science & Engineering C-Materials for Biogical Applications, 33(2013) 3294.
8. A.X. Oliveira, S.M. Silva, L. Figueiredo, R. Fernando, Electroanalysis, 25(2013) 723. 9. B. Habibi, M.H. Pournaghi-Azar, Electrochimica Acta, 55(2010) 5492.
10.X. Wang, M. Wu, W. J. Tang, Elec. Chem., 695(2013) 10.
11.A. Babaei, M. Aminikhah, A.R. Taheri, Sensor letters, 11(2013) 413. 12.Z. Temocin, Sensors and Actuators B: Chemical, 176 (2013)796.
13.L.C. Jiang, W.D. Zhang, Biosensors and Bioelectronics, 25 (2010)1402.
14.W.D. Zhang, J. Chen, L.C. Jiang, Y.X. Yu, J.Q Zhang, Microchim Acta,168(2010) 259. 15.P. Rattanarat, W. Dungchai, W. Siangproh, O. Chailapakul, C.S. Henrye, Analytica Chimica
Acta,744 (2012) 1.
16.E. Colin-Orozco, M. T. Ramirez-Silva, S. Corona-Avendano, Electrochimica Acta, 85(2012) 307. 17.S. Haloi, P. Goswami, D. K. Das, Applied Clay Science, 77-78(2013) 79.
18.J.B. Zheng, X.L. Zhou, Bioelectrochemistry, 70(2007) 408.
19.R.J. Tony Thomasa, B.E. Mascarenhasa, P.M. Kumara Swamyb, B.S. Zineb Mekhalifc, Colloids and Surfaces B: Biointerfaces, 110(2013) 458.
20.L. Wang, L. Ge, T.E. Rufford, J.L. Chen, W. Zhou, Z.H. Zhu, V. Rudolph, Carbon,49(2011) 2022. 21.J.M. You, S. Jeon, Electroanalysis 23(2011)2103-2108.
![Figure 1. Cyclic voltammograms of GCE (red line) and SDS-MWCNTs/GCE(black line) in 0.1 M KCl solution containing 5 mM [Fe(CN)6]3-/4- at scan rate of 50 mV/s](https://thumb-us.123doks.com/thumbv2/123dok_us/1896354.147458/4.596.153.428.100.308/figure-cyclic-voltammograms-sds-mwcnts-black-solution-containing.webp)