Bio Analytical Method Development and Validation of Saxagliptin in Human Plasma by RP-HPLC Method.
131
0
0
Full text
(2) BIO-ANALYTICAL METHOD DEVELOPMENT AND VALIDATION OF SAXAGLIPTIN IN HUMAN PLASMA BY RP-HPLC METHOD. Dissertation Submitted to The Tamilnadu Dr. M.G.R. Medical University, Chennai. In partial fulfillment for the award of the Degree of. MASTER OF PHARMACY (Pharmaceutical Analysis) APRIL-2014 Submitted by (Reg.no: 261230751) Under the guidance of Dr. K.Suresh Kumar, M.Pharm, Ph.D., Professor, KMCH College of Pharmacy. DEPARTMENT OF PHARMACEUTICAL ANALYSIS, KMCH COLLEGE OF PHARMACY, KOVAI ESTATE, KALAPPATTI ROAD, COIMBATORE-641048..
(3) Dr. A.Rajasekaran, M.Pharm, Ph.D., Principal, KMCH College of Pharmacy, Kovai Estate, Kalapatti Road, Coimbatore -641048.. CERTIFICATE This is to certify that, the work embodied in the thesis entitled “Bio-Analytical method development and validation of saxagliptin in human plasma by RP-HPLC ” is a bonafide research work carried out by Reg.No: 261230751, Student in Master of Pharmacy, Department of Pharmaceutical Analysis, KMCH College of Pharmacy, Coimbatore, Tamil Nadu, under the guidance of Dr. K.Suresh Kumar.,Professor, KMCH College of Pharmacy during the academic year 2013-2014.. Date: Place: Coimbatore.. Signature. Dr. A. Rajasekaran, M. Pharm, Ph.D., Principal.
(4) Dr. K.Suresh Kumar, M.Pharm, Ph.D., Professor, KMCH College of Pharmacy, Kovai Estate, Kalapatti Road, Coimbatore -641048.. CERTIFICATE This is to certify that, the work embodied in the thesis entitled “Bio analytical method development and validation of saxagliptin in. human plasma by RP-HPLC” is a bonafide research work carried out by Reg.No: 261230751, Student in Master of Pharmacy, Department of Pharmaceutical Analysis, KMCH College of Pharmacy, Coimbatore, Tamil Nadu, under my supervision and guidance during the academic year 2013-2014. I am fully satisfied with his performance and work with great pleasure. I forward this Dissertation work for evaluation.. Date: Place: Coimbatore.. Signature. Prof. Dr.K.Suresh Kumar,M.Pharm, Ph.D.,.
(5) DECLARATION. I am here by stating that, to the best of my knowledge and belief, the project report entitled “Bio analytical method development and validation of saxagliptin in human plasma by RP-HPLC” being submitted for the partial fulfillment of Master of Pharmacy in Pharmaceutical Analysis for the academic year 2013-2014 of KMCH College of Pharmacy affiliated to The Tamil Nadu Dr. M.G.R. Medical University carried out under the guidance of Dr.K.Suresh Kumar, M.Pharm, Ph.D., Professor KMCH College of Pharmacy, Coimbatore.. Date: Place: Coimbatore.. Signature.
(6) EVALUATION CERTIFICATE This is to certify that, the work embodied in the thesis entitled “Bio analytical method development and validation of saxagliptin in human plasma by RP-HPLC” submitted by. Reg.No: 261230751, to The. Tamilnadu Dr. M.G.R. Medical University, Chennai, in partial fulfillment for the Degree of Master of Pharmacy, in Pharmaceutical Analysis, is a bonafide research work carried out by the candidate at KMCH College of Pharmacy, Coimbatore, Tamil Nadu, the same was evaluated by us during the academic year 2013-2014.. Examination Center: KMCH College of Pharmacy, Coimbatore. Date:. Internal Examiner. External Examiner. Convener of Examinations.
(7) ACKNOWLEDGEMENT My dissertation entitled “Bio analytical method development and validation of saxagliptin in human plasma by RP-HPLC” would not have been a feasible one without the grace of god almighty who gave me instructions till the completion of my project. I am extremely thankful to my Academic Guide, Dr.K.Suresh Kumar, M.Pharm, Ph.D., Professor KMCH College of Pharmacy, for his constant insight, guidance, countless serenity, encouragement and pain taking efforts in my project work. I am indebted to his kindness and never failing co- operation. I will always remain indebted to Dr. A.Rajasekaran, M.Pharm, Ph.D., Principal, KMCH College of Pharmacy, for his constant encouragement and support. I would like to thank Dr. Nalla G.Palanisamy, Chairman, and Dr.Thavamani D.Palanisamy, Managing Trustee, KMCH College of Pharmacy, Coimbatore for all the facilities, which have been provided to us at the institution, enabling me to do work of this magnitude. My. thank esteemed and beloved staff. Mr. J.Dharuman,. M.Pharm.(Ph.D), Professor, Department of Pharmaceutical Analysis, KMCH College of Pharmacy, for his sensible help and suggestions. I owe my. gratitude to our esteemed and beloved staff. Mrs.N.Tamilselvi, M.Pharm, Assistant professor for their support, timely help and suggestions. I express my deep sense of respect and gratitude towards Mr.A.Vijaya Kumar, M.Pharm., Professor, Department of Pharmacy.
(8) practice , KMCH college of pharmacy for their timely help and support in the course of the work. My special thanks to my. all teaching and non-teaching staff. members of KMCH College Pharmacy,. Library and lab faculty. (Mr.Murugesan, Mrs.Ananthi) who directly or indirectly gave a helping hand during the course of study. My special thanks to my AZALEA friends and KMCH college friends. A.Prabu. ,N.Senthil. prabu,. S.Arunpandiyan,. P.Madhesh,. G.Krishnakumar, V.Nagesh rao, P.Manikandan S.Srinivasan and all my friends. I express my sincere thanks to all my classmates, senior, juniors, and friends for their timely help and co-operation. My loveable thanks to my beloved brothers Mr.K.Balachandren and Mr.K.Ilaiyaraja for always encouraging me to do my project. Last but not the least; I thank all those who directly and indirectly helped me in this project work to finish with great success. Above all I dedicate myself before the unfailing presence of god..
(9) ABBREVIATIONS. HPLC. High Performance Liquid Chromatography. UV. Ultra violet. IP. Indian Pharmacopoeia. USP. United States Pharmacopoeia. M.W.. Molecular weight. e.g.. Example. i.e.. That is. %. Percentage. PDA. Photo Diode Array. ACN. Acetonitrile. Met. Methanol. mg. Milligram. ng. Nanogram. g. gram. µg. Microgram. ml. Milliliter. w/w. Weight by weight. v/v. Volume by volume. µg/ml. Microgram per milliliter. RSD. Relative standard deviation. SD. Standard deviation. LOD. Limit of detection. LOQ. Limit of quantification. pH. Hydrogen ion concentration. °C. Degree Celsius. t. Time.
(10) Abs.. Absorbance. Conc.. Concentration. Min. Minutes. Fig.. Figure. NMT. Not more than. HETP. Height equivalent to theoretical plate. ICH. International conference on harmonization. API. Active pharmaceutical ingredients. SAXA. saxagliptin.
(11) CONTENTS. S.NO.. TOPICS. PAGE. 1. INTRODUCTION. 1. 2. LITERATURE REVIEW. 13. 3. DRUG PROFILE. 14. 4. AIM AND OBJECTIVES. 16. 5. PLAN OF WORK. 17. 6. METHODOLOGY. 18. 7. RESULTS AND DISCUSSION. 44. 8. SUMMARY AND CONCLUSION. 58. 9. BIBLIOGRAPHY. 60. 10. GLOSSARY. 63.
(12) ABSTRACT An accurate, simple and precise RP-HPLC Bio-Analytical method has been developed and validated for the estimation of Saxagliptin from human plasma.. The method was developed using enable C18 column and potassium di hydrogen ortho phosphate buffer with 0.01 M 1-heptane sulphonic acid used as aqueous phase (pH adjusted to 3.5 with orthophoshoric acid) and organic phase as acetonitrile (72:28). The flow rate was maintained at 1.0 ml/min and detected at a wavelength of 223 nm using PDA detector. Separation of Saxagliptin was achieved with a C18 column (250mmx4.6mmx50 µm ) and the retention time was found to be 4.4 min. The method was linear over the range of 0.5 to 2.5µg/ml . The good percentage recovery clearly confirmed the reproducibility and accuracy of the developed method. The %RSD value for precision was also within the acceptable limit. The robustness studies were performed by changing the pH, wavelength and flow rate by chemometric method. Satisfactory data was obtained for all the method validation parameters tested. The results of the study showed that the developed RP-HPLC method was found to be simple, rapid, precise, accurate, robust and stability indicating which can be used for routine analysis of Saxagliptin from plasma and biological matrix..
(13) Introduction. 1. INTRODUCTION1-7 Analytical Techniques An analytical chemistry helps to find the characteristics of drug components and related products by checking its quality and quantity measurements. With such those uses it is still taking important place in chemistry. Common Analytical Techniques for Analysis ; Chemical methods a) Titrimetric or volumetric methods b) Gravimetric methods c) Gasometrical analysis Electrical methods a) Potentiometry b) Conductometry c) Polarography d) Voltametry e) Amperometry Instrumental methods Spectroscopic methods Chromatographic techniques: X-ray methods: Radioactivity: Optical methods: Thermal methods: Biological and microbiological methods. Dept. of Pharmaceutical Analysis. Page 1.
(14) Introduction HIGH PERFORMANCE LIQUID CHROMATOGRAPHY In the modern pharmaceutical industry, HPLC is a major analytical tool applied at all stages of drug discovery, development and production . Most of the drugs in multicomponent dosage forms can be analyzed by HPLC method because of the several advantages like good separation, rapidity, specificity, accuracy, precision and ease of automation in this method. HPLC method eliminates tedious extraction and isolation procedures. Some of the advantages are:. PRINCIPLE The HPLC separation is performed by injecting the sample dissolved in solvent into a stream of solvent being pumped into a column. Here the principle is a liquid-solid separation. It occurs when mixture of compounds dissolved in a solvent can either stay in the solvent or adhere to the packing material in the column.. Types of liquid chromatography a. Partition Chromatography b. Adsorption Chromatography c. Ion exchange Chromatography d. Size exclusion or gel permeation Chromatography. Depending on the relative polarity of the two phases: Normal-Phase Chromatography Reversed-Phase Chromatography. Nature of the stationary phase and the separation process, Three modes can be specified: Adsorption Chromatography: Ion-Exchange Chromatography: Size Exclusion Chromatography:. Dept. of Pharmaceutical Analysis. Page 2.
(15) Introduction Instrumentation of HPLC: The features of modern HPLC are illustrated in the block diagram comprise of components.. 1. Pumping system: Features of pumping system High pressures up to 6000 psi, Constant & reproducible flow, Pulse free output, Flow rate (0.1-10mL), Adaptable to gradient flow, Corrosion resistant components, Easy to dismantle & repair and Low maintenance cost.. 2. An injector:. 3. Chromatographic column: Types of column: . Analytical Column:. . Preparative Column:. 4. Detector: There are six main detectors used for HPLC: Refractive index (RI),. Ultraviolet. (UV), Fluorescence (FL), Conductivity (CD), Electrochemical (EC) and Mass Spectrometric (MS).. 5.Data system. Quantification Methods in HPLC The four primary techniques for quantification are . Normalized peak area method. . External Standard method. . Internal Standard method. . Method of Standard addition. Dept. of Pharmaceutical Analysis. Page 3.
(16) Introduction System Suitability System suitability testing is an integral part of analytical procedures. System suitability test parameters to be established for a particular procedure depend on the type of procedure being validated.. i) Resolution (Rs): The resolution, Rs, of two neighboring peaks is defined by the ratio of the distance between the two peak maxima. For baseline separation, the ideal value of Rs is 1.5. It is calculated by using the formula, Rs =. Rt 2 Rt1 0.5W1 W2 . Where, Rt1 and Rt2 are the retention times of components 1 and 2 and W1 and W2 are peak widths of components 1 and 2. ii) Capacity factor (k’): Capacity factor k’, is defined as the ratio of the number of molecules of solute in the stationary phase to the number of molecules of the same in the mobile phase. Capacity factor can be determined by using the formula, K’ =. V1 V0 S V0. Where, V1 = retention volume at the apex of the peak (solute) V0 = void volume of the system. Typically an increase in percentage of the organic phase by 10 % by volume will decrease k’ of the bands by a factor of 2-3. iii) Selectivity (): The selectivity (or separation factor), is a measure of relative retention of two components in a mixture. The ideal value of selectivity is 2. It can be calculated by using the formula, α =. Dept. of Pharmaceutical Analysis. V 2 V0 V1 V0. Page 4.
(17) Introduction. Where, V0 is the void volume of the column and V2 and V1 are the retention volumes of the second and the first peak respectively. iv) Column efficiency (N): Efficiency, N, of a column is measured by the number of theoretical plates per meter. It is a measure of band spreading of a peak. Columns with N ranging from 2000 100,000 plates/meter are ideal for a good system. Efficiency is calculated by using the formula, N = 16. Rt 2 , W2. Where, Rt is the retention time and W is the peak width.. v) Peak asymmetry factor (As): Peak asymmetry factor, as, can be used as a criterion of column performance. The peak half width, b, of a peak at 10 % of the peak height, divided by the corresponding front half width, a, gives the asymmetry factor. As =. b a. For a well packed column, an asymmetry factor of 0.9 to 1.1 should be achievable.. vi)Theoretical plate number / Efficiency (N): A measure of peak band spreading determined by various methods, some of which are sensitive to peak asymmetry. 4-sigma / tangential. N = 16 (tR / W) 2 = L / H. Dept. of Pharmaceutical Analysis. Page 5.
(18) Introduction. Half height N = 5.54(tR/ W) 2 = L / H Where,. tR - Retention time for the sample peak. W - Peak width. N is fairly constant for each peak on a chromatogram with a fixed set of. operating conditions. H (height), or HETP (height equivalent of a theoretical plate), measures the column efficiency per unit length (L) of the column. Parameters which can affect N or H include. Peak position, particle size in column, flow-rate of mobile phase, column temperature, viscosity of mobile phase, and molecular weight of the analyte. The theoretical plate number depends on elution time but in general should be > 2000. vii) Tailing factor (T): It is the measure of the symmetry of a peak. T = W0.05 / 2f Where,. W0.05 - Peak width at 5% height F - Distance from peak front to apex point at 5% height.. Limits -T</= 2.. Dept. of Pharmaceutical Analysis. Page 6.
(19) Introduction. Analytical method development and validation [8-18] Analytical method development and validation play an important role in the discovery, development, and manufacture of pharmaceutical formulations. Method development. Validation of chromatographic methods. Basic criteria for new method development of drug analysis . The drug or drug combination may not be official in any pharmacopoeias.. . A proper analytical procedure for the drug may not be available in the literature due to patent regulations.. . Analytical methods may not be available for the drug in the form of a formulation due to the interference caused by the formulation excipients.. . Analytical methods for the quantification of the drug in biological fluids may not be available.. Validation of chromatographic methods . A detailed discussion on the parameters to be validated: Specificity: peak purity determination * Linearity * Range * Accuracy * Precision * Detection Limit * Quantification Limit * Robustness. Accuracy/recovery studies: The accuracy of an analytical method is the closeness of test results obtained by that method to the true value. Cm × 100 Ct The % recovery was calculated using the formula, % Re cov ery . ( a b) a bX 100. Where, a – Amount of drug present in sample b – Amount of drug added to the sample Dept. of Pharmaceutical Analysis. Page 7.
(20) Introduction. Acceptance Criteria: . For an assay method, mean recovery will be 100%± 2% at each concentration over the range of 80-120% of the target concentration.. . For an impurity method, mean recovery will be 0.1% absolute of the theoretical concentration or 10% relative, whichever is greater for impurities in the range of 0.1-2.5 % (V/W).. Precision: Precision is the measurement of the degree of repeatability of an analytical method under normal operation, and is normally expressed as the % relative standard deviation for a statistically significant number of samples. Acceptance Criteria: . Percentage Relative deviation (%RSD) NMT 1 % (Instrument precision). . (%RSD) NMT -2% (Intra- assay precision). Precision may be per-formed at three different levels: Repeatability, Intermediate Precision And Reproducibility. Repeatability: Repeatability (intra-day assay precision) is the results of the method operating over a short time interval under the same conditions (intra-assay precision). Intermediate Precision: Intermediate precision (inter-day variation) is the results from within lab variations, due to random events, such as different days, analysts, equipment, etc. Reproducibility: Reproducibility is determined by testing homogeneous samples in multiple laboratories, often as part of inter-laboratory crossover studies. Dept. of Pharmaceutical Analysis. Page 8.
(21) Introduction Limit of Detection and Quantitation: The Limit of Detection (LOD) and Limit of Quantitation (LOQ) tests for the procedure are performed on samples containing very low concentrations of analyte. The detection limit (DL) may be expressed as: LOD = 3.3 σ / S The low limit of quantification may be expressed as LOQ = 10 σ / S. Dept. of Pharmaceutical Analysis. Page 9.
(22) Introduction Bio-Analytical method development. [19-24]. The procedures that demonstrate that a particular method used for quantitative measurement of analytes in a given biological matrix, such as blood, plasma, serum, or urine, is reliable and reproducible for the intended use. Pharmaceutical products prepared with one drug or more than that ,but every drug formulations used depends on the bioavailability of that particulars in human or animal body. So to check the bio availability and its half life analyst having responsible to analyse the drugs in human and animal plasma. This is also applies to bioanalytical methods used for non-human pharmacology/toxicology studies and preclinical studies. Following instrumentation methods can be used for bio-analytical method development, 1.Gas Chromatography(GC) 2.High-pressure Liquid chromatography (LC) 3.Combined GC and LC mass spectrometric (MS) 4. LC-MS 5.LC-MS-MS 6.GC-MS and 7. GC-MS-MS The process by which a specific bioanalytical method is developed, validated, and used in routine sample analysis can be divided into 1. Reference Standard preparation 2. Bioanalytical method development and establishment of assay. procedure. 3. Application of validated bioanalytical method to routine drug analysis and acceptance criteria for the analytical run and/or batch.. Dept. of Pharmaceutical Analysis. Page 10.
(23) Introduction. 1. Reference Standard: Analysis of drugs and their metabolites in a biological matrix is carried out using samples spiked with calibration (reference) standards and using quality control (QC) samples. If possible, the reference standard should be identical to the analyte. When this is not possible, an established chemical form (free base or acid, salt or ester) of known purity can be used. 2. Bioanalytical Method Development: The method development and establishment phase defines the chemical assay. Typical method development and establishment for a bioanalytical method include determination of (1) selectivity, (2) accuracy, precision, recovery, (3) calibration curve, and (4) stability of analyte in spiked samples. A. Selectivity It is the ability of an analytical method to differentiate and quantify the analyte in the presence of other components in the sample mixture. If the method is intended to quantify more than one analyte, each analyte should be tested to ensure that there is no interference. B. Accuracy, Precision, and Recovery Accuracy – The accuracy of an analytical method describes the closeness of mean test results obtained by the method to the true value (concentration) of the analyte. The mean value should be within 15% of the actual value except at LLOQ, where it should not deviate by more than 20%. Precision The precision of an analytical method describes the closeness of individual measures of an analyte when the procedure is applied repeatedly to multiple aliquots of a single homogeneous volume of biological matrix.. Dept. of Pharmaceutical Analysis. Page 11.
(24) Introduction subdivided into 1.Within-run, intra-batch precision or repeatability: This assesses precision during a single analytical run, 2.Between-run, inter-batch precision or repeatability: This measures precision with time, and may involve different analysts, equipment, reagents, and laboratories. Recovery The recovery of an analyte in an assay is the detector response obtained from an amount of the analyte added to and extracted from the biological matrix, compared to the detector response obtained for the true concentration of the pure authentic standard. .. Dept. of Pharmaceutical Analysis. Page 12.
(25) Literature Review 2. LITERATURE REVIEW 1.. P. Srinivasa Rao et al25 studied Stability indicating isocratic reverse phase HPLC method for the estimation of Saxagliptin in bulk drugs and in its formulation Separation was achieved with a Eclipse XDB C18, ( 150 mm × 4.6 mm X 5 μm) Column and Potassium di-hydrogen orthophosphate buffer with TEA (pH adjusted to 3.4 with OPA): Acetonitrile (80:20) v/v as eluent at a flow rate of 1.0 mL/min. UV detection was carried out at 213 nm. The retention time of Saxagliptin was found to be 3.8 minutes.. 2.. Bhagavanji26 reported that, a study on development and validation of stability indicating liquid chromatographic method for the simultaneous estimation of Metformin and Saxagliptin in combined dosage form by thermo Hypersil BDS C8 (250mmX4.6mmX5μ) column was used with mobile phase containing water pH 3.0 adjusted with ortho phosphoric acid: methanol in the ratio of (70: 30, v/v). The flow rate was 1.0 mL/min, column temparature was 30°C and effluents were monitored at 241 nm. The retention times of Metformin and Saxagliptin were 4.7min and 6.8 min, respectively.. 3.. Karkhanis Vaishali et al27 has reported and study on development and validation of a liquid chromatographic method for estimation of Saxagliptin in tablet dosage form achieved by Hypersil C18 column (250mm X 4.6mm, 5μm) in isocratic mode, the mobile phase comprises of Acetonitrile: Buffer in ratio of 30:70 v/v, buffer was 0.02M Potassium Di-hydrogen Phosphate (pH 4.5 adjusted with OPA). The flow rate of mobile phase was 1.0ml/min and detection UV wavelength 220nm. The retention time of saxagliptin was 3.487 min.. 4.. Sarat et al28 has been reported and study on reverse phase HPLC method for simultaneous estimation of Saxagliptin and Pioglitazone in tablets. Chromatographic seperation achieved isocratically on Inerstil C18 column (150mmX 4.6 mmX5μm) using mobile phase of Acetonitrile and Phosphate buffer pH 7.0 (60:40 v/v)at a flow rate of 0.8 ml/min with UV wave length of 260 nm. Aceclofenac was used as internal standard. The RT of Saxagliptin, pioglitazone and aceclofenac was 2.48, 4.45 and 6.34 min respectively.. Dept. of Pharmaceutical Analysis. Page 13.
(26) Drug Profile 3. DRUG PROFILE [25-28] Drug Name. :. Saxagliptin. Molecular formulae. :. C18H25N3O2. Molecular weight. :. 315.41 g/mol. Chemical structure. Chemical name. :. 2-[(2S)-2-amino-2-(3-hydroxy-1-adamantyl) acetyl]-2-azabicyclo[3.1.0]hexane-3-carbonitrile. Colour and nature. :. White to yellow or light brown crystalline powder.. Solubility. :. Sparingly soluble in water ,slightly soluble in ethyl acetate and soluble in methanol, ethanol ,isopropyl alcohol, acetonitrile ,acetone and PEG-400.. Category. :. Oral hypoglycemic agent (anti-diabetic drug) (DPP-4 inhibitor.). Dosage Form. :. Available as 2.5 mg and 5 mg tablet.. Index of Refraction. :. 1.6.. Boiling Point. :. 548.7±35.0 °C at 760 mmHg.. Dept. of Pharmaceutical Analysis. Page 14.
(27) Drug Profile. Molar Refractivity. :. 84.2±0.4 cm3 .. :. 95.2±6.0 kJ/mol.. Class. :. Carboxylic Acids and Derivatives.. Subclass. :. Amino Acids, Peptides, and Analogues.. Direct Parent. :. Alpha Amino Acid Amides.. Half life. :. 2.5 hours.. Enthalpy of Vaporization. pKa (strongest acidic) :. 14.74.. pKa (strongest basic) :. 7.9.. Toxicity. Upper respiratory tract infection, urinary tract infection,. :. and headache. Route of elimination. :. Eliminated by both renal and hepatic pathways.. Pharmacology: Saxagliptin is used along with the diet and activities to lower blood sugar levels in patients with type 2 diabetes Saxagliptin is in a class of oral diabetic drugs called dipeptidyl peptidase-4 (DPP-4) inhibitors. Saxagliptin is not used to treat type 1 diabetes or diabetic ketoacidosis. It works by increasing the quantity of insulin produced by the body after meals when blood sugar is high.. Dept. of Pharmaceutical Analysis. Page 15.
(28) Aim & Objectives 4. AIM AND OBJECTIVES OF THE WORK Importance of analytical chemistry is to gain information about the qualitative and quantitative composition of substance and chemical species, that is, to find out what a substance is composed of and exactly how much it is present. Drug analysis plays an important role in the development of drugs, their manufacture and therapeutic use. Pharmaceutical industries rely up on quantitative chemical analysis to ensure that the raw material used and the final product obtained meets the required specification.. Saxagliptin is part of a class of diabetes medications called dipeptidyl peptidase4 (DPP-4) inhibitors. DPP-4 is an enzyme that breaks down incretin hormones. As a DPP-4 inhibitor, Saxagliptin slows down the breakdown of incretin hormones, increasing the level of these hormones in the body.. The literature revealed that only four methods. [29-32]. have been reported for. estimation of saxagliptin in single or combined dosage forms by RP-HPLC.. Previously described methods for saxagliptin were technically lack of sensitivity and using high proportion of organic mobile phases. However Bio anlytical methods were not been reported for saxagliptin estimation in human plasma.. The prime objective of this work is to develop rapid, selective, sensitive and economical Bio analytical method for saxagliptin in human plasma with an internal standard by RP-HPLC method.. Dept. of Pharmaceutical Analysis. Page 16.
(29) Plan of Work 5. PLAN OF WORK The work plan was to develop RP-HPLC method for Bio analytical estimation of Saxagliptin. The plan of work was divided into two phases. Phase I: Optimization of chromatographic conditions . Selection of wavelength. . Selection of initial separation conditions. . Selection of mobile phase (pH, peak modifier, solvent strength, ratio and flow rate). . Nature of the stationary phase. . Selection of separation method and agent. Phase II: Validation of the method The developed method were proposed to be validated using the various validation parameters such as, Accuracy Precision Interday Intraday Repeatability Linearity Limit of detection (LOD) Limit of quantification (LOQ) Robustness Ruggedness System suitability.. Dept. of Pharmaceutical Analysis. Page 17.
(30) Methodology 6. METHODOLOGY HPLC METHOD DEVELOPMENT [29-33] MATERIALS AND INSTRUMENTS USED a) Drug samples: Saxagliptin gift sample was procured from Madras pharmaceuticals, Chennai. b) Chemicals and Solvents used: . Water HPLC Grade. . Acetonitrile HPLC grade. . Methanol HPLC grade. . Orthophosphoric acid AR grade. . 1-Heptane sulphonic acid. . Tri ethyl amine. c) Instruments used: . Shimadzu AY 220 Electronic Weighing Balance. . Eutech pH meter. . Sonica Ultrasonicator.. . Millipore membrane filter. . Shimadzu prominence HPLC. . Pump – Prominence LC-20AT. . Column -Enable C18 (2) 100A, (250 X 4.6m.m x i.d, 5µ). . Injector - Rheodyne 7725i with 20 μl loop. . Detector - Photo Diode Array Detector. Dept. of Pharmaceutical Analysis. Page 18.
(31) Methodology METHOD DEVELOPMENT AND OPTIMIZATION OF CHROMATOGRAPHIC CONDITION FOR THE ESTIMATION OF SAXAGLIPTIN The present work is the development of the RP-HPLC method development of saxagliptin. a) Selection of Wavelength The wavelength for the analysis of saxagliptin was selected by injecting several times of standard of 10 µg/ml of saxagliptin, for an optimum detection of the drug. since it have shown maximum absorbance at 223 nm, finally which was selected as an optimum wave length for the estimation. b) Selection of method for separation Proper selection of the method depends upon the nature of the sample (ionic/ionisable/neutral molecule), its molecular weight and solubility. The drug selected in the present study is polar in nature and hence the reverse phase HPLC was selected for the initial separations because of its simplicity and suitability. c) Initial chromatographic conditions adopted for the separation of Saxagliptin Chromatographic Conditions – 1 Stationary phase. : Enable C18 column. Mobile phase. : Solvent A – HPLC grade water : Solvent B - Acetonitrile:Methanol(30:20). Solvent ratio. : 50: 50 (A: B). Detection Wavelength. : 223 nm. Flow rate. : 1.0 ml/min. Temperature. : 25ºC. At the above chromatographic conditions saxagliptin was eluted at the retention time of 5.3 min. The peaks observed was broad and asymmetric hence not selected further for method development.. Dept. of Pharmaceutical Analysis. Page 19.
(32) Methodology Chromatographic Conditions – 2 Stationary phase. : Enable C18 column. Mobile phase. : Solvent A – HPLC grade water : Solvent B - Acetonitrile: Methanol(30:20). Solvent ratio. : 40: 60 (A: B). Detection Wavelength. : 223 nm. Flow rate. : 1.0 ml/min. Temperature. : 25ºC. At the above chromatographic conditions saxagliptin was eluted at the retention time of 5.3 min. The peak observed was broad and asymmetric hence not selected further for method development. Hence no development from last method it would not be followed for further studies.. Chromatographic Conditions – 3 Stationary phase. : Enable C18 column. Mobile phase. : Solvent A – HPLC grade water pH adjust to 4.0 (with orthophosphoric acid) : Solvent B - Acetonitrile:Methanol(30:20). Solvent ratio. : 50: 50 (A: B). Detection Wavelength. : 223 nm. Flow rate. : 1.0 ml/min. Temperature. : 25ºC. At the above chromatographic conditions saxagliptin was eluted at the retention time of 5.3 min. The peak observed was broad and asymmetric hence not selected further for method development. Hence no development from last method it would not be followed for further studies .Mostly the same result was observed same like chromatographic condition-2.. Dept. of Pharmaceutical Analysis. Page 20.
(33) Methodology Chromatographic Conditions – 4 Stationary phase. : Enable C18 column. Mobile phase. : Solvent A - Water pH 3.5 with 0.5%TEA : Solvent B - Acetonitrile:Methanol(30:20). Solvent ratio. : 50:50 (A: B). Detection Wavelength. : 223 nm. Flow rate. : 1.0 ml/min. Temperature. : 25ºC. At the above chromatographic conditions saxagliptin was eluted at the retention time of 2.2 min. The peak observed was good but the RT of plasma will be in same RT of saxagliptin hence not selected further for method development.. Chromatographic Conditions – 5 Stationary phase. : Enable C18 column. Mobile phase. : Solvent A - Water pH 3.5 with 0.5%TEA : Solvent B - Acetonitrile:Methanol(30:20). Solvent ratio. : 65: 35 (A: B). Detection Wavelength. : 223 nm. Flow rate. : 1.0 ml/min. Temperature. : 25ºC. At the above chromatographic conditions saxagliptin was eluted at the retention time of 2.2 min. The peak observed was splitting and asymmetric hence not selected further for method development. Hence no development from last method it would not be followed for further studies.. Dept. of Pharmaceutical Analysis. Page 21.
(34) Methodology. Chromatographic Conditions – 6 Stationary phase. : Enable C18 column. Mobile phase. : Solvent A –Phosphate buffer pH Adjusted to 4.0 (with Orthophosphoric acid) : Solvent B – Acetonitrile:Methanol(30:20). Solvent ratio. : 50: 50 (A: B). Detection Wavelength. : 223 nm. Flow rate. : 1.0 ml/min. Temperature. : 25ºC. At the above chromatographic conditions saxagliptin was eluted at the retention time of 2.02 min. The peak observed was sharp but 2.02 min RT hence not selected further for method development in plasma.. Chromatographic Conditions – 7 Stationary phase. : Enable C18 column. Mobile phase. : Solvent A –Phosphate buffer pH Adjusted to 4.0 (with Orthophosphoric acid) : Solvent B – Acetonitrile:Methanol(30:20). Solvent ratio. : 60: 40 (A: B). Detection Wavelength. : 223 nm. Flow rate. : 1.0 ml/min. Temperature. : 25ºC. At the above chromatographic conditions saxagliptin was eluted at the retention time of 1.09 min. The peak observed was good but RT in too short hence not selected further for method development.. Dept. of Pharmaceutical Analysis. Page 22.
(35) Methodology Chromatographic Conditions – 8 Stationary phase. : Enable C18 column. Mobile phase. : Solvent A –Phosphate buffer pH Adjusted to 4.0 (with Orthophosphoric acid) : Solvent B – Acetonitrile. Solvent ratio. : 70: 30 (A: B). Detection Wavelength. : 223 nm. Flow rate. : 1.0 ml/min. Temperature. : 25ºC. At the above chromatographic conditions saxagliptin was eluted at the retention time of 3.2 min. The peak observed was good but because of the same RT problem not selected further for method development Chromatographic Conditions – 9 Stationary phase. : Enable C18 column. Mobile phase. : Solvent A –Phosphate buffer pH Adjusted to 4.0 (with Orthophosphoric acid) : Solvent B – Acetonitrile. Solvent ratio. : 80: 20 (A: B). Detection Wavelength. : 223 nm. Flow rate. : 1.0 ml/min. Temperature. : 25ºC. At the above chromatographic conditions saxagliptin was eluted at the retention time of 3.2 min. The peak observed was broad and asymmetric hence not selected further for method development.. Dept. of Pharmaceutical Analysis. Page 23.
(36) Methodology Chromatographic Conditions – 10 Stationary phase. : Enable C18 column. Mobile phase. : Solvent A –Phosphate buffer pH Adjusted to 4.0 (with Orthophosphoric acid) : Solvent B – Acetonitrile. Solvent ratio. : 60: 40 (A: B). Detection Wavelength. : 223 nm. Flow rate. : 1.0 ml/min. Temperature. : 25ºC. At the above chromatographic conditions saxagliptin was eluted at the retention time of 3.02 min. The peak observed was sharp RT will come with plasma peak hence not selected further for method development Chromatographic Conditions – 11 Stationary phase. : Enable C18 column. Mobile phase. : Solvent A –Phosphate buffer pH Adjusted to 4.0 (with Orthophosphoric acid) : Solvent B – Acetonitrile. Solvent ratio. : 65:35 (A: B). Detection Wavelength. : 223 nm. Flow rate. : 1.0 ml/min. Temperature. : 25ºC. At the above chromatographic conditions saxagliptin was eluted at the retention time of 3.04 min. The peak was sharp. Hence no development from last method it would not be followed for further studies.. Dept. of Pharmaceutical Analysis. Page 24.
(37) Methodology Chromatographic Conditions – 12 Stationary phase. : Enable C18 column. Mobile phase. : Solvent A –Phosphate buffer pH Adjusted to 4.0 (with Orthophosphoric acid) : Solvent B – Acetonitrile. Solvent ratio. : 70:30 (A: B). Detection Wavelength. : 223 nm. Flow rate. : 1.0 ml/min. Temperature. : 25ºC. At the above chromatographic conditions saxagliptin was eluted at the retention time of 3.2 min. The peaks observed was broad and asymmetric hence not selected further for method development.. Chromatographic Conditions – 13 Stationary phase. : Enable C18 column. Mobile phase. : Solvent A –Phosphate buffer pH Adjusted to 5.0 (with Orthophosphoric acid) : Solvent B – Acetonitrile. Solvent ratio. : 65:35 (A: B). Detection Wavelength. : 223 nm. Flow rate. : 1.0 ml/min. Temperature. : 25ºC. At the above chromatographic conditions saxagliptin was eluted at the retention time of 3.28 min. The peaks observed was sharp and no change in RT hence not selected further for method development.. Dept. of Pharmaceutical Analysis. Page 25.
(38) Methodology Chromatographic Conditions – 14 Stationary phase. : Enable C18 column. Mobile phase. : Solvent A –Phosphate buffer pH Adjusted to 3.0 (with Orthophosphoric acid) : Solvent B – Acetonitrile. Solvent ratio. : 65:35 (A: B). Detection Wavelength. : 223 nm. Flow rate. : 1.0 ml/min. Temperature. : 25ºC. At the above chromatographic conditions saxagliptin was eluted at the retention time of 2.89 min. The peaks observed was sharp and RT was before three min hence not selected further for method development.. Chromatographic Conditions – 15 Stationary phase. : Enable C18 column. Mobile phase. : Solvent A –Phosphate buffer pH Adjusted to 3.5 (with Orthophosphoric acid) : Solvent B – Acetonitrile. Solvent ratio. : 65:35 (A: B). Detection Wavelength. : 223 nm. Flow rate. : 1.0 ml/min. Temperature. : 25ºC. At the above chromatographic conditions saxagliptin was eluted at the retention time of 2.8 min. The peaks observed was sharp but no development in RT hence not selected further for method development.. Dept. of Pharmaceutical Analysis. Page 26.
(39) Methodology Chromatographic Conditions – 16 Stationary phase. : Enable C18 column. Mobile phase. : Solvent A –Phosphate buffer pH Adjusted to 3.5 (with Orthophosphoric acid) : Solvent B – Acetonitrile. Solvent ratio. : 70:30 (A: B). Detection Wavelength. : 223 nm. Flow rate. : 1.0 ml/min. Temperature. : 25ºC. At the above chromatographic conditions saxagliptin was eluted at the retention time of 3.2 min. The peaks observed was sharp but RT near to 3 min hence not selected further for method development. Chromatographic Conditions – 17 Stationary phase. : Enable C18 column. Mobile phase. : Solvent A –Phosphate buffer pH Adjusted to 3.5 (with Orthophosphoric acid) : Solvent B – Acetonitrile. Solvent ratio. : 75:25 (A: B). Detection Wavelength. : 223 nm. Flow rate. : 1.0 ml/min. Temperature. : 25ºC. At the above chromatographic conditions saxagliptin was eluted at the retention time of 3.4 min. The peaks observed was sharp but RT not shifted after fourth min hence not selected further for method development.. Dept. of Pharmaceutical Analysis. Page 27.
(40) Methodology Chromatographic Conditions – 18 Stationary phase. : Enable C18 column. Mobile phase. : Solvent A –Phosphate buffer pH Adjusted to 3.5(with Orthophosphoric acid) : Solvent B – Acetonitrile. Solvent ratio. : 70:30 (A: B). Detection Wavelength. : 223 nm. Flow rate. : 1.0 ml/min. Temperature. : 25ºC. At the above chromatographic conditions saxagliptin was eluted at the retention time of 3.2 min. The peaks observed was sharp but RT not shifted after fourth min hence not selected further for method development.. Chromatographic Conditions – 19 Stationary phase. : Enable C18 column. Mobile phase. : Solvent A –Phosphate buffer pH Adjusted to 3.5 (with Orthophosphoric acid) : Solvent B – Acetonitrile. Solvent ratio. : 73:27 (A: B). Detection Wavelength. : 223 nm. Flow rate. : 1.0 ml/min. Temperature. : 25ºC. At the above chromatographic conditions saxagliptin was eluted at the retention time of 3.4 min. The peaks observed was sharp but no change in RT hence not selected further for method development.. Dept. of Pharmaceutical Analysis. Page 28.
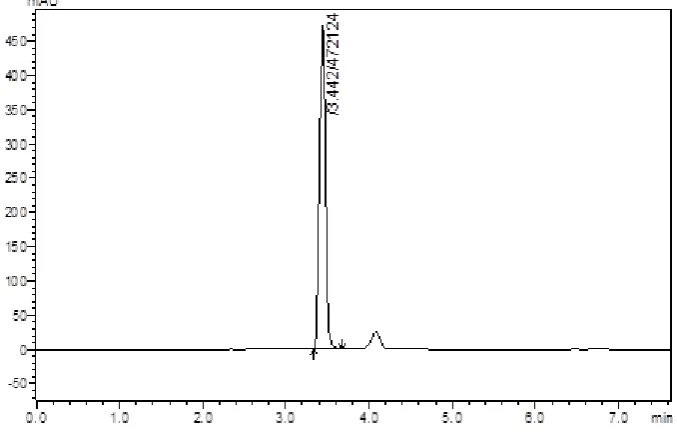
(41) Methodology Chromatographic Conditions – 20 Stationary phase. : Enable C18 column. Mobile phase. : Solvent A – 1-heptane sulphonic acid Phosphate buffer pH adjusted to 3.5(with Orthophosphoric acid) : Solvent B – Acetonitrile. Solvent ratio. : 70: 30 (A: B). Detection Wavelength. : 223 nm. Flow rate. : 1.0 ml/min. Temperature. : 25ºC. At the above chromatographic conditions saxagliptin was eluted at the retention time of 3.4 min. The peaks observed was sharp but no change in RT hence not selected further for method development.. Chromatographic Conditions – 21 Stationary phase. : Enable C18 column. Mobile phase. : Solvent A – 1-heptane sulphonic acid Phosphate buffer pH adjusted to 3.5(with Orthophosphoric acid) : Solvent B – Acetonitrile. Solvent ratio. : 73: 27 (A: B). Detection Wavelength. : 223 nm. Flow rate. : 1.0 ml/min. Temperature. : 25ºC. At the above chromatographic conditions saxagliptin was eluted at the retention time of 4.5 min. The peaks observed was sharp and RT also shifted after fourth min hence this buffer has been selected further for method development.. Dept. of Pharmaceutical Analysis. Page 29.
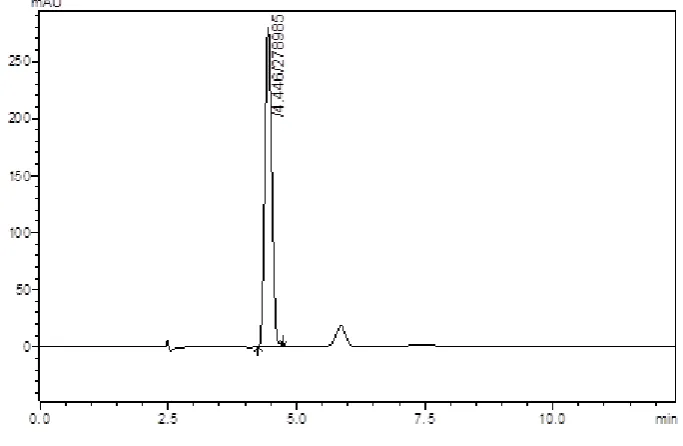
(42) Methodology Chromatographic Conditions – 22 Stationary phase Mobile phase. : Enable C18 column : Solvent A – 1-heptane sulphonic acid Phosphate buffer pH adjusted to 3.5(with Orthophosphoric acid) : Solvent B – Acetonitrile. Solvent ratio. : 75:25 (A: B). Detection Wavelength. : 223 nm. Flow rate. : 1.0 ml/min. Temperature. : 25ºC. At the above chromatographic conditions saxagliptin was eluted at the retention time of 4.4 min. The peaks observed was sharp and RT also shifted after fourth min but RT was moving towards the zero hence this ratio of mobile phases need to some change further for method development.. Chromatographic Conditions – 23 Stationary phase Mobile phase. : Enable C18 column : Solvent A – 1-heptane sulphonic acid Phosphate buffer pH adjusted to 3.5(with Orthophosphoric acid) : Solvent B – Acetonitrile. Solvent ratio. : 73: 27 (A: B). Detection Wavelength. : 223 nm. Flow rate. : 1.0 ml/min. Temperature. : 25ºC. At the above chromatographic conditions saxagliptin and cipfloxacin were eluted at the retention time of 4.4 min and 8.4 min respectively. The peaks observed was sharp hence this method has been selected further for method development.. Dept. of Pharmaceutical Analysis. Page 30.
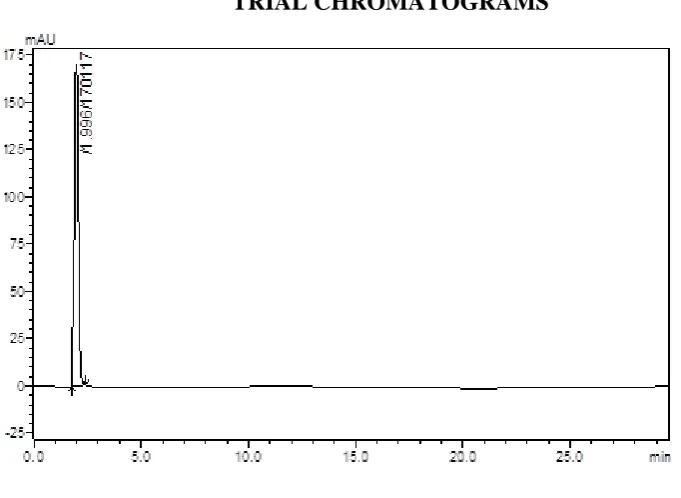
(43) Methodology Chromatographic Conditions – 24 Stationary phase. : Enable C18 column. Mobile phase. : Solvent A – 1-heptane sulphonic acid Phosphate buffer pH adjusted to 3.5(with Orthophosphoric acid) : Solvent B – Acetonitrile. Solvent ratio. : 72: 28 (A: B). Detection Wavelength. : 223 nm. Flow rate. : 1.0 ml/min. Temperature. : 25ºC. At the above chromatographic conditions saxagliptin and cipfloxacin were eluted at the retention time of 4.53 min and 6.65 min respectively. The peaks observed was sharp hence this method has been selected further for method development.. TRIAL CHROMATOGRAMS. Fig :01 MP: ACN & MEOH: KH2PO4 Buffer pH 4.0 (Adjusted with OPA) 40:60 (30:20). Dept. of Pharmaceutical Analysis. Page 31.
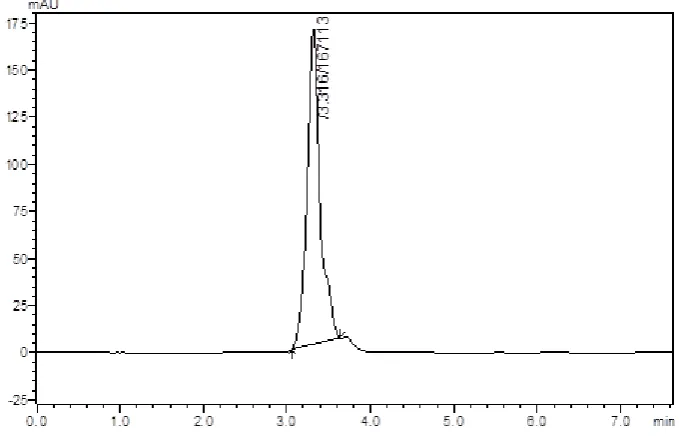
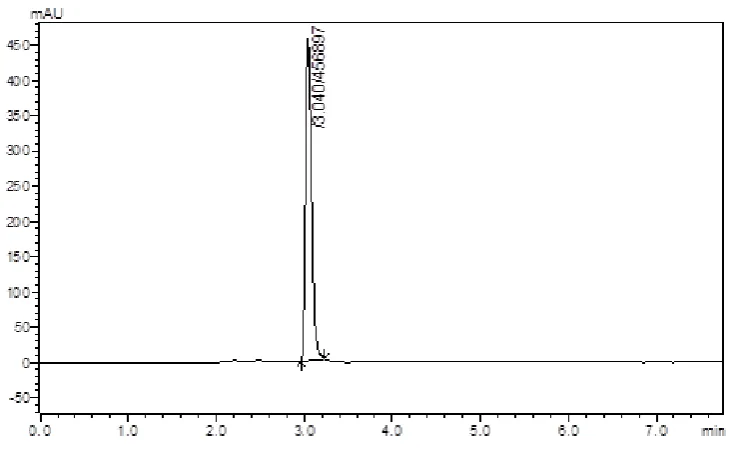
(44) Methodology. Fig :02 MP:ACN: KH2PO4 Buffer pH 4.0(Adjusted with OPA) 30:70. Fig :03 MP:ACN: KH2PO4 Buffer pH 4.0(Adjusted with OPA) 30:70. Dept. of Pharmaceutical Analysis. Page 32.
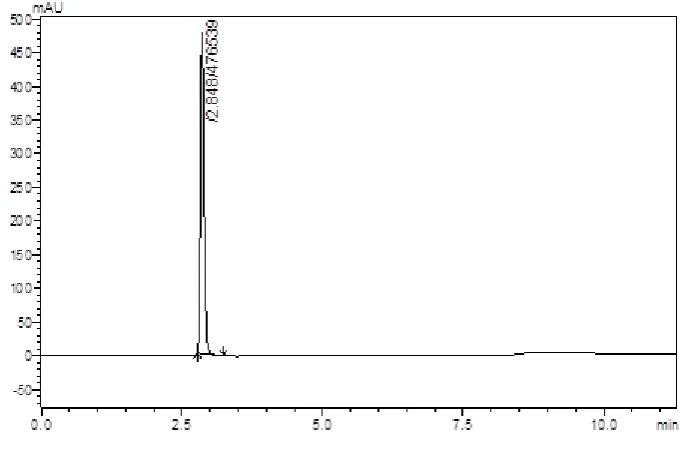
(45) Methodology. Fig :04 MP:ACN: KH2PO4 Buffer pH 4.0(Adjusted with OPA) 40:60. Fig :05 MP:ACN: KH2PO4 Buffer pH 5.0(Adjusted with OPA) 35:65. Dept. of Pharmaceutical Analysis. Page 33.
(46) Methodology. Fig :06 MP:ACN: KH2PO4 Buffer pH 3.0(Adjusted with OPA) 35:65. Fig :07 MP:ACN: KH2PO4 Buffer pH 3.5(Adjusted with OPA) 35:65. Dept. of Pharmaceutical Analysis. Page 34.
(47) Methodology. Fig :08 MP:ACN: KH2PO4 Buffer pH 3.5(Adjusted with OPA) 30:70. Fig :09 MP:ACN: KH2PO4 Buffer pH 3.5(Adjusted with OPA) 25:75. Dept. of Pharmaceutical Analysis. Page 35.
(48) Methodology. Fig :10 MP:ACN: KH2PO4 Buffer pH 3.5(Adjusted with OPA) 30:70. Fig :11 MP:ACN: KH2PO4 Buffer pH 3.5(Adjusted with OPA) 27:73. Dept. of Pharmaceutical Analysis. Page 36.
(49) Methodology. Fig :12 MP:ACN: KH2PO4 Buffer with 1-Heptane sulphonic acid pH 3.5(Adjusted with OPA) 27:73. OPTIMIZATION OF SEPARATION CONDITIONS Effect of pH change in phosphate buffer and mobile phase ratio: Table 1. Effect of pH and mobile phase ratio Drug. Saxagliptin. 5.02. 70:30. Retention time (min) 3.20. 5.50. 35:65. 3.28. Sharp peak. 3.03. 35:65. 2.89. Sharp peak. 3.52. 35:65. 2.82. Sharp peak. 3.5. 30:70. 3.2. Sharp peak. pH. Dept. of Pharmaceutical Analysis. Buffer:ACN. Observation Splitting. Page 37.
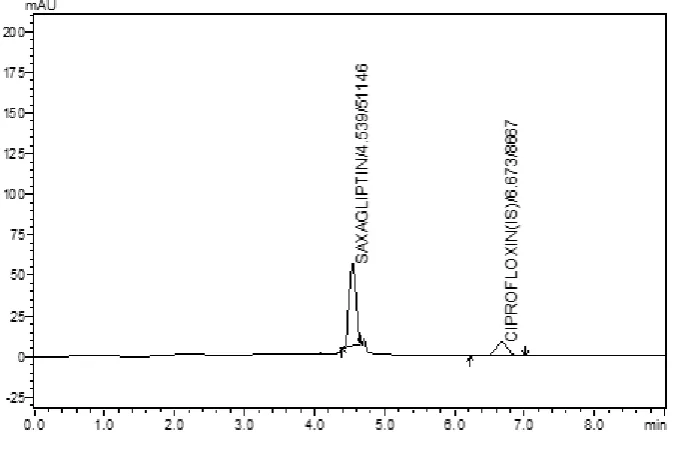
(50) Methodology Effect of Ratio of Mobile phase The mobile phase of Acetonitrile: Methanol: Water:Buffer in various ratios, were tried and the chromatograms were recorded at 223 nm with a flow rate of 1ml/min. Finally phosphate buffer with 1-Heptane sulphonic acid was selected ( pH was adjusted to 3.5 with ortho phosphoric acid) as aqueous phase and acetonitrile as organic phase then 72:28 v/v was an ideal ratio for the estimation of Saxagliptin from human plasma. The standard solution was chromatographed for 12 min, using 28% acetonitrile and buffer solution in different pH ranging from 5.0,4.0,4.5,3.0 and 3.5 at 223 nm, the mobile phase has the flow rate of 1.0 ml/min using Enable C18 column as stationary phase for Saxagliptin determination and pH 3.5 was selected as the ideal pH for the separation of Saxagliptin. Effect of flow Rate: Keeping the mobile phase ratio 28:72 ACN : phosphate buffer with 1-Heptane sulphonic acid were used and the chromatograms were recorded at a flow rate of 1.0 ml/min. At this flow rate, the peaks were sharp with good resolution. So 1.0 ml/min was kept constant for the analysis (flow rate 0.9 ml/min 1.1 ml/min, up to 1.3 ml/min were also tried, but did not give any satisfactory results). Mobile Phase: Prepare a filtered and degassed mixture of ACN and phosphate buffer pH 3.5 with 1-Heptane sulphonic acid (28:72 v/v ) which was used as a mobile phase. Fixed chromatographic conditions: Final Method With Plasma Chromatographic Conditions –25 Stationary phase Mobile phase. : Enable C18 column : Solvent A –Phosphate buffer with 1heptane sulphonic acid pH adjusted to 3.5(with Orthophosphoric acid) : Solvent B – Acetonitrile. Dept. of Pharmaceutical Analysis. Page 38.
(51) Methodology Solvent ratio. : 72: 28 (A: B). Detection Wavelength. : 223 nm. Flow rate. : 1.0 ml/min. Temperature. : 25ºC. Saxagliptin was eluted at retention time of 4.49 min and Ciprofloxacin at 6.7 min with sharp peaks. So this method has been selected for the further studies. Bio analytical method: Stationary phase. : Enable C18 column. Mobile phase. : Solvent A – 1-heptane sulphonic acid Phosphate buffer pH adjusted to 3.5(with Orthophosphoric acid) : Solvent B – Acetonitrile. Solvent ratio. : 72: 28 (A: B). Detection Wavelength. : 223 nm. Flow rate. : 1.0 ml/min. Temperature. : 25ºC. Estimation of Saxagliptin: Estimation of Saxagliptin in plasma by RP- HPLC method was carried out by standard calibration method. Preparation of standard solution: Solution-A ; Weigh 10 mg of Saxaglptin was taken in to separate 10 ml standard flask and dissolved and made up to 10 ml with ACN (A) Solution-B : From the stock solution(A) pipette out 1 ml in to another 10 ml standard flask then made up the volume up to 10 ml with water and ACN with the ratio of 50:50(B) . Solution (C) : From the B solution pipette out 1 ml and made up to the volume in 10 ml standard flask and made up the volume up to 10n ml with water and ACN with the ratio of 50:50 (solution C). Dept. of Pharmaceutical Analysis. Page 39.
(52) Methodology . From the C solution prepared the different concentration of solutions such as 0.5 , 1.0 , 1.5 , 2.0 and 2.5 µg /ml .. Preparation of internal standard solution: Preparation of ciprofloxacin was same like saxagliptin, solubility. but based on the. water was used as solvent for the dilution. The final concentration of. ciprofloxacin was 50 µg /ml . These ciprofloxacin solution was used as internal standard to Bio analytical method development of saxagliptin. Validation: Calibration curves were plotted using peak area against concentration of corresponding standard solutions. Peak areas of the sample chromatograms were reordered and the amount of Saxagliptin were calculated from the regression equation. Validation is a process of establishing documented evidence, which provides a high degree of assurance that a specific activity will consistently produce a desired result or product meeting its predetermined specifications and quality characteristics.. Dept. of Pharmaceutical Analysis. Page 40.
(53) Methodology Significance of Method Validation: The quality of analytical data is a key factor in the success of a drug development program. The process of method development and validation has a direct impact on the quality of these data. Analytical validation is a very important feature of any package of information submitted to international regulatory agencies in support of new product marketing or clinical trials applications. A thorough method development can almost rule out all potential problems, at the same time, a thorough validation programmed can address the most common ones and provide assurance to the intended purpose (can be used with 100% confidence). In other words, a thorough validation can fulfil all the technical and regulatory objectives. Analytical characteristics listed below may not be applicable to every test procedure or every particular material. It will mostly depend on the purpose for which the procedure is required, however, these following aspects of validation should be given due importance. a) Accuracy: Accuracy of the method was determined by recovery experiments. The reference standards of the respective drug were added to the sample solution at the level of 50%, 100% and 150%. These were further diluted by procedure as followed in the estimation of formulation. The concentrations of the drugs present in the resulting sample solution were determined by using assay method.. b) Precision: The precision of the developed method was determined in terms of intermediate precision (intra-day and inter-day). Three same concentrations were analyzed in five independent series during the same day (intra-day precision) and three consecutive days (inter-day precision); with each series every sample was injected in triplicate. The %RSD values of intra-day and inter-day studies showed that the precision of the method was satisfactory.. Dept. of Pharmaceutical Analysis. Page 41.
(54) Methodology. c) Linearity and range: From the standard stock solutions, a suitably mixed standard and Internal standard solution was prepared. Saxagliptin were found to be linear in the range of 0.5 to 2.5 µg/ml. The solutions were examined by the assay procedure. The calibration curve was plotted using peak area Vs concentration of the standard solution. From the calibration curve, the slope and intercept were calculated. d) Limit of detection (LOD) and Limit of quantification (LOQ): The LOD and LOQ were separately determined and reported, based on the calibration curve of standard solution. The residual standard deviation of the regression line or the standard deviation of y – intercepts of regression lines may be used to calculate LOD and LOQ. LOD = 3.3 × D/S and LOQ = 10 × D/S, where, D is the Standard deviation of y – intercepts of regression line and S is the slope of the calibration curve. LOD is the smallest concentration of the analyte that can be detected and gives the measurable response (signal to noise ratio of 3). The signal to noise ratio were performed by comparing by measured signal of known low concentration of drug. LOQ is the smallest concentration of the analyte that can be accurately quantified (signal to noise ratio 10). e) Specificity: The specificity of the RP-HPLC method was determined by complete separation of Saxagliptin with parameters like retention time(Rt), resolution (Rs) and tailing factor (T), peak purity curve and peak purity index. Tailing factor for peaks of Saxagliptin less than 2% and resolution was satisfactory. The peaks obtained for Saxagliptin were sharp and have clear baseline separation. The peak purity studies were performed to prove that the method is specific in nature. f) Ruggedness: It expresses the precision within laboratory variations like different days, different analyst, and different equipments. Ruggedness of the method was assessed by spiking the standard concentrations of Saxagliptin , 5 times in two different days with different analyst. Dept. of Pharmaceutical Analysis. Page 42.
(55) Methodology. g) Robustness: In order to demonstrate the robustness of the method, the following optimized conditions were slightly varied. 1) ± 2% in ratio of acetonitrile in mobile phase, 2) ± 0.2 ml of flow rate, 3) ± 0.2 units in the pH of buffer. The separation factor, retention times and peak symmetry were then calculated. The deviation among the results obtained is well within the limits. Hence the method is robust. h) System Suitability Studies: The system suitability studies were carried out as specified in USP. These parameters include column efficiency, resolution and capacity factor.. Dept. of Pharmaceutical Analysis. Page 43.
(56) Results and Discussion 7. RESULTS AND DISCUSSION. 1. HIGH PERFORMANCE LIQUID CHROMATOGRAPHIC METHOD A Bio-analytical RP-HPLC method was developed for the Saxagliptin. The chromatographic conditions were stabilized in order to provide a good performance of the assay. The standard and internal standard solutions were prepared and chromatograms were recorded. This project proposes a method for the determination of Saxagliptin from human plasma by liquid-liquid extraction method using RP-HPLC.. Chromatographic separation of standard Saxagliptin: The chromatogram of Saxagliptin was recorded alone and shown in figure (Fig 13).The standard solution which contains internal standard Ciprofloxacin was injected with the developed chromatographic conditions, and the chromatograms were recorded and shown in figure (Fig 14).. Fig:13 - Chromatogram of standard Saxagliptin 100µg/ml. Dept. of Pharmaceutical Analysis. Page 44.
(57) Results and Discussion. Fig:14 Chromatogram of standard Saxagliptin 0.5µg/ml with (IS). The retention time of Saxagliptin and internal standard (Ciprofloxacin) was 4.5 and 7.2 min respectively with percent RSD of less than 2%. The results are shown in table (Table no 3). The peak purity study reveals that signal ratios (relative absorbance at different wavelengths) were constant across the peak profile of Saxaglptin. The peaks obtained in the present study were symmetric, good and no interference was observed between the peak.. Table No 2: Retention time of Saxagliptin and ciprofloxacin (IS) Retention time of Drugs (min) S. No. Method. Saxagliptin. Internal Standard (Ciprofloxacin). 1. 4.523. 6.654. 2. 4.494. 6.672. 4.572. 6.592. 4. 4.508. 6.618. 5. 4.534. 6.673. 3. HPLC. Dept. of Pharmaceutical Analysis. Page 45.
(58) Results and Discussion The method developed was advantageous than the reported methods by its lesser precision values and increased accuracy values. The run time of 10 minutes makes the method rapid and economical than the previously reported methods.. Chromatographic separation of Saxagliptin in biological fluid: The chromatogram of the blank plasma was recorded at the fixed chromatographic conditions and shown in figure (Fig 15).. Fig: 15- Chromatogram of blank plasma. Various eluting solvents were used for extraction of Sxagliptin in human plasma. But, out of all eluting solvents acetonitrile was proved to be good because of its maximum percentage recovery. The percentage recoveries were calculated and shown in table (Table no 3). The retention time for Saxagliptin and internal standard (Ciprofloxacin) were 4.4 and 6.8 minutes as shown in (Fig 14). The peaks were symmetric with straight baseline.. The extraction method used for the present study was simple and newer than previous methods. For present study protein precipitation technique was used and ACN as eluting solvent was selected because of its maximum recovery of drug from plasma and it is advantageous.. Dept. of Pharmaceutical Analysis. Page 46.
(59) Results and Discussion Table no 3: Recovery study of Saxagliptin Level. Conc. of. Amt. of drug recovered from. drug. plasma (µg/ml). added. Methanol. ACN. (µg /ml). ACN. % Recovery. Methanol. ACN and. and. methanol. methanol. mixture. ACN. mixture I. 0.5. 0.23. 0.34. 0.48. 46. 68. 96. II. 1.0. 0.64. 0.78. 0.97. 64. 78. 97. III. 1.5. 1.02. 1.12. 1.47. 68. 74.6. 98. METHOD VALIDATION a) Accuracy and precision: At two –levels these accuracy and precision studies were conducted i.e. intra-day and inter-day. In this the present developed method, shown the good accuracy and precision. Accuracy ranges from 99.4% to 100.5% with the precision 5.82% to 6.94% in intra-day method. In inter-day method the accuracy ranges from 99.8% to 100.8% with the precision 6.61% to 7.69%. Finally the data obtained here, was found to be within limits as per ICH guidelines and method was accurate. Intra-day studies: In this plasma concentration 500-2500 ng/ml were injected six times and mean peak area was calculated separately for each concentration and from that accuracy and precision percentage RSD values were calculated and shown in table. (Table No 4). Dept. of Pharmaceutical Analysis. Page 47.
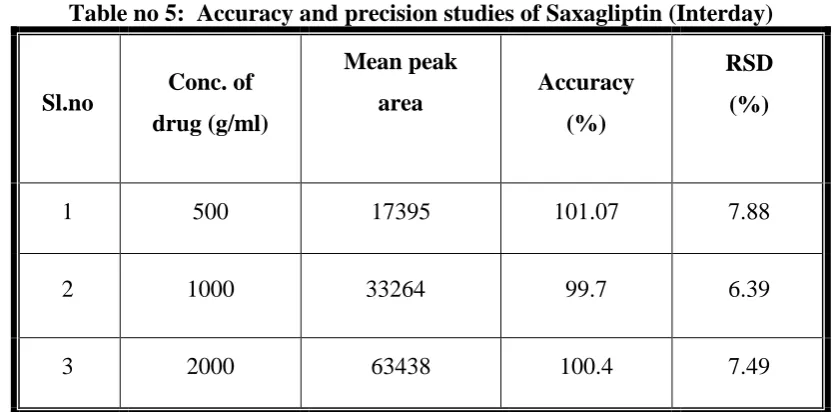
(60) Results and Discussion. Table no 4: Accuracy and precision studies of Saxagliptin(Intraday). Sl.no. Conc. of. Mean peak area. drug (ng/ml). Accuracy (%). RSD (%). 1. 500. 16795. 100.5. 7.52. 2. 1000. 32564. 99.8. 6.96. 3. 2000. 64438. 99.4. 6.65. **Average of six determinations. Inter-day studies: In this the plasma concentrations of 500-2500 ng/ml were injected into HPLC six times in three different days and mean peak areas were calculated and from that accuracy and precision percentage RSD were calculated and shown in table (Table no 5). The percentage relative standard deviation of precision for Saxagliptin was less than 15% for the bioanalytical study. The results obtained were within limits. Acceptance criteria: The percentage RSD value should be less than 15% for bioanalytical study. Table no 5: Accuracy and precision studies of Saxagliptin (Interday). Sl.no. Conc. of drug (g/ml). Mean peak area. Accuracy (%). RSD (%). 1. 500. 17395. 101.07. 7.88. 2. 1000. 33264. 99.7. 6.39. 3. 2000. 63438. 100.4. 7.49. **Average of six determinations. Dept. of Pharmaceutical Analysis. Page 48.
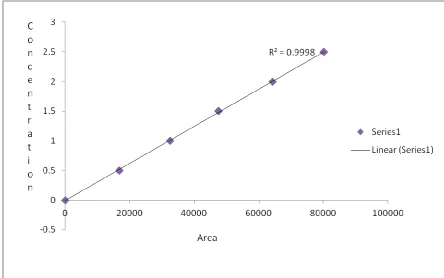
(61) Results and Discussion. b) Linearity and range: This method proved to be linear between ng/ml of Saxagliptin in human plasma, with a typical calibration curve of correlation equation y = 0.1535x + 0.0274, correlation coefficient > 0.999 shown in table (Table no 6). Fig: 16 - Calibration curve for Saxagliptin The chromatograms of the plasma calibration standards with concentrations 500, 1000, 1500, 2000 and 2500 ng/ml were recorded and shown in figures (Fig 17,18,19, 20 and 21) and their peak areas of both drug and internal standard were noted. The calibration curve for Saxagliptin was plotted as peak response Vs concentration of the Saxagliptin calibration standards in plasma was shown (in Fig : 16). As we were using internal standard peak response was calculated for calibration curve. Peak response is the ratio of internal standard peak area to drug peak area. The correlation coefficient of Saxagliptin shown was 0.999 which was within limits. This calibration curve plotted was linear and showed that the method had adequate sensitivity to the concentration (500 ng/ml-2500 ng/ml) of the drug. Finally the data obtained, in this was within limits . Coefficient of correlation of Saxgliptin was found to be less than 0.9998.. Dept. of Pharmaceutical Analysis. Page 49.
(62) Results and Discussion Acceptance criteria: The correlation coefficient should not less than 0.99. Fig 17 - Chromatogram of IS and Saxagliptin in human plasma 500ng/ml. Fig :18 - Chromatogram of IS and Saxagliptin in human plasma 1000ng/ml. Dept. of Pharmaceutical Analysis. Page 50.
(63) Results and Discussion. Fig :19 - Chromatogram of IS and Saxagliptin in human plasma 1500ng/ml. Fig :20 - Chromatogram of IS and Saxagliptin in human plasma 2000ng/ml. Dept. of Pharmaceutical Analysis. Page 51.
(64) Results and Discussion. Fig: 21 - Chromatogram of IS and Saxagliptin in human plasma 2500ng/ml. c) Lower Limit of Quantification: The LLOQ is the smallest concentration of the analyte, which shows response that can be accurately quantified and LLOQ = 10 × D/S, where, D is the standard deviation of y – intercepts of regression line and S is the slope of the calibration curve. This signal to noise ratio were performed by comparing measured signal of known low concentration of drug with those of blank plasma sample. The Lower limit of quantification (LLOQ) for Saxagliptin were separately determined and reported, based on the calibration curve for spiked plasma solutions was found to be 96.5 ng/ml.. d) Recovery from plasma: A recovery study for Saxaglitpin in plasma using acetonitrile was shown in table (Table no 8). With concentrations 500 ng/ml, 1000 ng/ml, 2000 ng/ml of Saxagliptin recovery was calculated and showed 100.3%, 99.8%, 100.3% relative recoveries and percentage RSD as 8.7%, 8.0% and 7.2% respectively. From the data obtained, it was observed that the recovery of drugs in plasma was found to be 9% which is sufficient for bio-analytical study. Acceptance criteria: For an assay method, mean recovery should be 85-105% ± 2%.. Dept. of Pharmaceutical Analysis. Page 52.
(65) Results and Discussion Table no 6: Recovery studies of Saxagliptin Conc. of drug added (ng/ml). Amt of drug recovered in plasma sample (ng /ml). Percentage recovery (%). I. 500. 500.3. 100.3. 8.7. II. 1000. 998.5. 99.8. 8.0. III. 2000. 2001.1. 100.3. 7.2. Levels. % RSD. **Average of six determinations.. e) Ruggedness: It expresses the precision within laboratories variations like different days, different analyst, and different equipments. Ruggedness of the method was assessed by spiking the plasma standard 6 times in two different days with different analyst and the standard solutions were analyzed by a different chemist and same instruments on a different day had been performed the reports were shown in table (Table no 7). The deviation among the results obtained by two chemists on a different day was well within the limits. Hence the method was rugged. Acceptance criteria: The percentage RSD should be less than 15%.. Dept. of Pharmaceutical Analysis. Page 53.
(66) Results and Discussion Table no 7: Ruggedness studies for Saxagliptin Concentration (ng/ml). Drug. Mean peak area. %RSD. Day I analyst – I 500. Saxagliptin. 17395. 6.44. Day II analyst – II 500. Saxagliptin. 18146. 7.78. **Average of six determinations.. f) Specificity: For specificity the peak purity studies were done. Here for Saxagliptin the peak purity index was 000 and the peak properties like peak profile were good for both standard and the sample. The peak purity and peak profiles for Saxagliptin without plasma and with plasma were shown in figures (Fig 22, 23,24 and 25) respectively. By the data obtained in this, the present method developed was specific as values were within limits. Acceptance criteria: Purity angle should be less than purity threshold i.e.0.99-1.00 mAU 325 214nm 217nm 220nm 300 223nm 226nm 229nm 275 232nm 250 225 200 175 150 125 100 75 50 25 0 4.15. 4.20. 4.25. 4.30. 4.35. 4.40. 4.45. 4.50. 4.55. 4.60. 4.65. 4.70. 4.75. 4.80. 4.85 min. Fig :22 - Peak profile of standard Saxagliptin. Dept. of Pharmaceutical Analysis. Page 54.
(67) Results and Discussion mAU 213nm 75 216nm 219nm 70 222nm 225nm 228nm 65 231nm 60 55 50 45 40 35 30 25 20 15 10 5 0 4.400. 4.425. 4.450. 4.475. 4.500. 4.525. 4.550. 4.575. 4.600. 4.625. 4.650 min. Fig: 23 - Peak profile of Saxagliptin in human plasma. mAU 0.275 Purity Curve Zero Line. Peak. 300.0. 0.250. 275.0. 0.225. 250.0. 0.200. 225.0. 0.175. 200.0. 0.150. 175.0. 0.125. 150.0. 0.100. 125.0 100.0. 0.075. 75.0. 0.050. 50.0 0.025 25.0 0.000 0.0 4.15. 4.20. 4.25. 4.30. 4.35. 4.40. 4.45. 4.50. 4.55. 4.60. 4.65. 4.70. 4.75. 4.80. 4.85 min. Fig :24 - Peak purity of standard Saxagliptin. Dept. of Pharmaceutical Analysis. Page 55.
(68) Results and Discussion. mAU Purity Curve 0.225 Zero Line. Peak 175.0. 0.200 150.0. 0.175 0.150. 125.0. 0.125 100.0. 0.100 0.075. 75.0 0.050 50.0. 0.025 0.000. 25.0 -0.025 -0.050. 0.0 4.350. 4.375. 4.400. 4.425. 4.450. 4.475. 4.500. 4.525. 4.550. 4.575. 4.600. 4.625. 4.650. min. Fig :25 - Peak purity of Saxagliptin in human plasma. Table no 8: Peak parameters S.NO. Parameters. Saxagliptin. 1.. Theoretical Plate. 6179.9. 2.. Tailing Factor. 0.910. 3.. HETP. 40.08. 4.. LLOQ. 96.5ng/ml.. 5.. Resolution. Dept. of Pharmaceutical Analysis. 3.56. Page 56.
(69) Results and Discussion g) System suitability: These parameters were shown to be within specified limits. Column efficiency (theoretical plates), resolution factor and peak asymmetry factor, HETP, tailing factor, LLOQ are the system suitability parameters. These parameters of the optimized methods were found satisfactory. The results of the system suitability studies in plasma were shown in table (Table no 8). These parameters were shown to be within specified limits. Dept. of Pharmaceutical Analysis. Page 57.
(70) Summary And Conclusion 8. SUMMARY AND CONCLUSION A simple Reverse Phase High Performance Liquid Chromatographic method has been developed and subsequently validated for Saxagliptin estimation in human plasma. The separation method was carried out by using a mobile phase consisting of Acetonitrile and potassium dihydrogen ortho phosphate pH 3.5 ±0.05 with 1-Heptane sulphonic acid in the ratio of 28:72 v/v. The detection was carried out by using PDA detector at 223 nm. The column was Enable C18 (250 X 4.6mm 5 µ). The flow rate was selected as 1.0 ml/min. The retention time of Saxagliptin was found to be 4.4 min. The asymmetry factor or tailing factor of Saxagliptin was found to be 0.910 which indicates symmetrical nature of the peak. The number of theoretical plates of Saxagliptin was found to be 6179.9 which indicates the efficient performance of the column. These parameters represent the specificity of the method. From the linearity studies, specified concentration levels were determined. It was observed that Saxagliptin was linear in the range of 50% to 150% for the target concentration by RP-HPLC. The linearity range of Saxagliptin 0.5-2.5µg/ml was found to obey linearity with a correlation coefficient of 0.9998. The validation of the proposed method was verified by system precision and method precision by RP-HPLC. The %RSD of system suitability for Saxagliptin was found to be 0.81. The validation of the proposed method was verified by recovery studies. The percentage recovery range was found to be satisfied which represent in results. The ruggedness study was also performed.. Dept. of Pharmaceutical Analysis. Page 58.
(71) Summary And Conclusion CONCLUSION A RP-HPLC method for bio analytical estimation of Saxagliptin was developed and validated from human plasma as per ICH Guidelines. Shimadzu Prominance with PDA Detector and Enable C18 (250x4.6mm, 5µ) column, injection of 20 µl was injected and eluted with the mobile phase of Acetonitrile and potassium dihydrogen phosphate buffer pH 3.5 with 1-Hetane sulphonic acid and Acetonitrile in the ratio 28:72, which was pumped at a flow rate of 1.0 ml at 223 nm. The peak of Saxagliptin and Ciprofloxacin (IS) was found well separated at 4.56 min and 6.7 min respectively. The developed method was validated for various parameters as per ICH guidelines like system suitability, accuracy, precision, linearity, specificity, ruggedness, robustness and solution stability. The Bio-analytical method validation of Saxagliptin by RP HPLC was found to be satisfactory and could be used for the routine pharmaceutical analysis of Saxagliptin from biological matrix.. Dept. of Pharmaceutical Analysis. Page 59.
(72) Bibliography 9. BIBLIOGRAPHY 1. Robert Brown D. Introduction of chemical analysis.1st ed. New Delhi: IVY Publishing House; 2001.p.145. 2. Garry D Christian. Analytical Chemistry. 4th ed. London: University of Wellingt 2001.p.1-4. 3. David Lee, Michael Webb. Pharmaceutical Analysis. 1st ed. Blackwell Publication; 2003.p.219. 4. Willard HH, Merritt LL, Dean JJA, Frank AS. Instrumental Method of Analysis. 7th ed. New Delhi: CBS Publishers and Distributors; 1986. p. 1-4. 5. Takeru higuchi, Einar brochmann, Hamffen hanssen. Text book of pharmaceutical analysis.1st ed. New Delhi: CBS publishers and distributors; 2005.p.1-2. 6. Rashmin. An Introduction To Analytical Method Development For Pharmaceutical Formulations. 6th ed. 2008.p.83. 7. Sharma B K. Instrumental Methods of Chemical analysis. 18th ed. Meerut: Krishna Prakashan Media (P) Ltd; 1999.p.10-30. 8. Johnson J D, Van Buskirk. Analytical method validation. Journal of validation technology. 1998; Vol 2: 88-105. 9. Shah PV, Midha KK, Dighe S, McGilvery JI, Skelly P J, Yacobi A, and Pittman A.. Analytica. method. validation:. Bioavilbility. ,Bioequivalence. and. Pharmacokinetic studies, Journal of Pharmaceutical Sciences.1992:81:309-312. 10. Shabir GA. Validation of HPLC Chromatography Methods for Pharmaceutical Analysis. Understanding the Differences and Similarities Between Validation Requirements of FDA, the US Pharmacopeia and the ICH. J Chromatogram 2003; 987(1-2):57-66. 11. Lindsay S. High Performance Liquid Chromatography. 1st ed. New York: Wiley InterScience; 1991. p. 4,27,71 Dept. of Pharmaceutical Analysis. Page 60.
(73) Bibliography. 12. Meyer VR. Practical High Performance Liquid Chromatography. 2nd ed. New York: Wiley InterScience; 1994. p. 98-105. 13. Sethi P D. High performance liquid Chromatography. 1st ed. New Delhi: CBS publishers and distributors.1996.p.17-19. 14. Lough WJ, Wainer IW. High Performance Liquid Chromatography: Fundamental Principles and Practice. Glasgow (UK): Blackie Academic & Professional; 1995. p. 23-8. 15. Turowski. M, Morimoto T, Kimata. K, Monde. H, Ikegami T, Hosoya. K.. Selectivity of stationary phases in reversed-phase liquid Chromatography based on the dispersion interactions. Journal of Chromatography. 2001; A 911; 177-190. 16. Snyder L R, Kirkland J J. Introduction to modern liquid chromatography. 2nded. Newyirk: John Wiley and Sons:1979. 17. Roger A, Schimer, Quantitative analysis in HPLC, Vol 2, 2nd ed. Pg: 307-311. 18. Joachim Ermer, Miller. Method Validation in Pharmaceutical Analysis. Weinheim: Wiley-vch Verlag GmbH & Co; 2005.p.132. 19. ICH: Q2B Analytical Validation-Methodology (November 1996). 20. Joachim Ermer.Validation in pharmaceutical analysis. Part I: An integrated Approach. Journal of Pharmaceutical and Biomedical Analysis.2001;vol 24: 755– 767. 21. Johnson J D, Van Buskirk,Analytical method validation. journal of validation technology.1998;vol 2: 88-105. 22. Jenke D R. Chromatographic method validation: A review of current practices and procedures. II. Guidelines for primary validation parameters. Journal of Liquid Chromatography. 1996; vol 19: 737-757. 23. Mulholland M. Ruggedness testing in analytical chemistry. Trends in analytical Chemistry. 1988;vol 7: 383-389. Dept. of Pharmaceutical Analysis. Page 61.
(74) Bibliography 24. Douglas A, Skoog J James, Leary. Principles of instrumental analysis. 7th edt. Thomson Publication;2001.p.1-13. 25. Srinivasa Rao.P, Rama chandran.D, Murali.K and Srinivasu.S "Stability indicating isocratic reverse phase HPLC method for the estimation of saxagliptin in bulk drugs and in its formulation" International journal of pharma sciences vol.3,No.5(2013):333-342. 26. Bhagavanji N.V.M.S "Development and validation of stability indicating liquid chromatographic method for the simultaneous estimation of metformin and saxagliptin in combined dosage form" VSRD International Journal of Technical & Non-Technical Research, Vol. 3 No. 11 November 2012 . 27. Vaishali V.Karkhanis , Anandhakumari D.Captain "Development and Validation of liquid chromatographic method for Estimation of saxagliptin in tablet dosage form " Journal of Research in Chemistry . Jun2013, Vol. 6 Issue 6, p6-6. 1/3p. 28. Sarat.M, Murali Krishna.P and Rambabu.C "RP-HPLC method for simultaneous estimation of Saxagliptin and Pioglitazone in tablets" International research journal of pharmacy, 2012. 29. Munson J W. Modern Methods of Pharmaceutical Analysis, Part-B. New York: Marcel Dekker Inc; 1984.p.109. 30. Sethi P D. Quantitative Analysis of drugs in pharmaceutical formulations. 3rd ed. New Delhi: CBS publishers and distributors;1997. 31. Chung Chow Chan, Lee Y C, Herman Lam, Xue Ming Zhang.Analytical Method Validation and Instrument performance Verification.p.no. 35-45. 32. Joachim Ermer.Validation in pharmaceutical analysis. Part I, An integrated approach. Journal of Pharmaceutical and Biomedical Analysis.2001;(2) 24: 755– 767. 33. ICH, Q2A, 1994, Validation of Analytical procedure: Methodology. In Proc. Int. Con. Harmonization, Geneva. 34. ICH: Q2B Analytical Validation Methodology (November 1996).. Dept. of Pharmaceutical Analysis. Page 62.
(75) Glossary 10. GLOSSARY 1.. Degassing: The process of removing dissolved gas from the liquid mobile phase before or during use. Degassing is done by heating, by vacuum, or by helium purging.. 2.. Drift: The change in the baseline value over time, expressed mathematically as the slope of the least line squares line fitted to the base line in a specified region chromatogram.. 3.. Eluent: Mobile phase used to perform a chromatographic separation .The liquid that exits through a chromatographic column during a separation.. 4.. Equilibration: The process of bringing a chromatographic solvent (solvent, column, and interactive surfaces) to a thermally and chemically stable state, usually indicated by a drift –free base line.. 5.. External Standard: A separate sample that contains known quantities of the same compounds that are in unknown samples. External standards are used for quantitation by matching the detector response of a component peak to a point on a calibration curve for that component. The calibration curve is generated from a separately processed standard (or set of standards).. 6.. Fronting peak: An asymmetrically shaped chromatographic peak in which the front part of the peak (before the apex) contains more area than the rear of the peak. The asymmetry factor for fronting peak has value less than one. The opposite of fronting peak is a tailing peak. 7.. Fused peak: Two or more no baseline-resolved peaks in a chromatogram that share the same base line, the same base line start and end points, and the same slope and offset.. 8.. Gradient Elution: Also called as solvent programming, a technique for decreasing the separation time by increasing the mobile phase strength over time during a chromatographic separation. Gradients can be continuous or stepwise. Binary (2-. Dept. of Pharmaceutical Analysis. Page 63.
Figure
+7

Related documents
For a polar stationary bed like silica we need to choose a relatively non polar mobile phase. This mode of operation is termed as Normal phase chromatography. Here the
high performance liquid chromatographic (RP-HPLC) method for simultaneous estimation of AMBL and VAL on RP C-18 column using acetonitrile : phosphate buffer (0.02 M, pH 3.0), (56 :
Saiful Islam, et al, (2016), Development and validation of RP-HPLC method for determination of saxagliptin hcl in bulk and tablet dosage form, World journal of pharmacy and
Optimizations of chromatographic conditions were performed to obtain the best peak and parameter (asymmetry, theoretical plates). For the selection of mobile phase
The stability studies of plasma samples spiked with morin were subjected to three freeze - thaw cycles, short term stability at room temperature for 3 h and long term stability
To estimate the LOQ, a drug free blank plasma sample was extracted and injected ten times and analyzed as described under optimized chromatographic conditions
From this solution appropriate dilution was made using mobile phase and injected in stabilized chromatographic condition.. Volumetric flask kept at room temperature for
The changeable method parameters in HPLC technique may intertwine flow rate, column temperature, sample temperature, mobile phase and Ph
