Int. J. Electrochem. Sci., 9 (2014) 2316 - 2326
International Journal of
ELECTROCHEMICAL
SCIENCE
www.electrochemsci.org
Electrocoagulation Process Application in Bilge Water
Treatment Using Response Surface Methodology
Kubra Ulucan, Harun Akif Kabuk, Fatih Ilhan, Ugur Kurt
Yildiz Technical University, Environmental Engineering Department, Istanbul, 34220, Turkey
*
E-mail: [email protected]
Received: 26 September 2013 / Accepted: 23 January 2014 / Published: 2 March 2014
Marine pollution problems have been noted in increasing manner depending on the increment in sea transportation every succeeding day. Bilge water can be count as one of the main pollution source, which contains petroleum, oil and hydrocarbons in high concentrations. Due to interference of seawater to the bilge water, it contains in high chloride concentration; and therefore it is high in conductivity. This feature is an advantage for treatability of bilge water by electrochemical processes. High conductivity leads to increment of current intensity and decrement in voltage and energy costs. Contrary to conventional chemical treatment, extra consumption of chemicals can be avoided by electrochemical treatment methods. In this study, treatment of bilge water by electrocoagulation/electroflotation process is investigated. The experiments were carried out in accordance with statistical runs assigned by response surface methodology. Before optimization via response surface methodology, a pre-study was performed and the highest removal efficiencies in all pre-studies are obtained in original pH (pH6,95). in consideration of pre-studies, statistical runs were carried out and, the optimum removals of both COD and Oil & Grease were obtained under 9,87 mA/cm2 of current density in approximately 13 minutes and in approximately 29º C of inlet temperature; optimum COD and Oil & Grease were removed by 90,3% and 81,7%, respectively.
Keywords: Bilge water, Electrochemical Treatment, Electrocoagulation, Response Surface Methodology, Central Composite Design.
1. INTRODUCTION
Bilge water stored in bilge tanks consists of wastewaters from machinery department such as cooling waters, oil leaks and also the sludgy wastewaters from oil storage tank; hence it contains oil in high concentration. Some conventional physical and chemical treatments such as centrifugation, filtration, coagulation, sedimentation and flotation had been applying for the treatment of bilge water. Due to the fact that the majority of bilge water’s oil content is emulsified, physical treatment applications are to be insufficient. It is also reported by Caplan et al. [1] and Woytowich et al. [2] that conventional oil/water separation systems can not separate the emulsified oil droplets under 20 microns. As stated before, conventional treatments are not effective for oil containing wastewater, and for bilge water treatment there are also a limited number of studies in which ultrafiltration [3-4], UF/membrane distillation [5-6] water oxidation [7], biotechnology [8], electrocoagulation [2], photocatalytic [9] methods are applied.
Within advanced wastewater treatment processes, electrochemical wastewater treatment is one of the fastest advancing, most applied processes and will be most applicable process in more application in future. Besides electrochemical treatment of domestic wastewater is applied successfully, it is proved to be effective in treatment of phenol, aniline, olive oil, cyanide and industrial wastewaters from leather tanning, textile, paint industry.
As an electrochemical wastewater treatment process, electrocoagulation is a process based on dissolving Al+3, Fe+2 and Fe+3 ions as coagulant, which forms metal hydroxides with high adsorption capacity in water, via aluminum and iron electrodes. Electrically charged metal ions can form high-gravity flocks by binding emulsified materials, suspended solids and colloidal materials. In addition, H2 gas produced in cathode generates large surface areas for the adsorption of flocks and precipitates,
and removes them by floating (electroflotation process).
Electrochemical treatment applications to treat bilge water are very few in number. In the electrocoagulation research with aluminum and iron electrodes by Woytowich et al. [2], it is stated that electrocoagulation becomes gaining acceptance compared to the much higher cost conventional treatment processes.
Due to the high chloride concentration, conductivity of bilge water is high and this makes it appropriate to treat by electrochemical methods by considering the advantages of low energy consumption and less chemical usage. High conductivity leads to increment of current intensity and decrement in voltage and energy costs. Besides the number of researches on treatment of bilge water by electrochemical processes are few in literature; researches on wastewaters contaminated with oil and/or diesel fuel which is thought to be main pollution of bilge water are exist [10-19]. In these studies it is demonstrated that the removal of O&G is carried out by being adsorbed on metal hydroxides produced in electrocoagulation process or by floating via produced gasses[11-12]. In the treatment of oily wastewaters, generally, aluminum and iron electrodes are used and in researches it is specified that aluminum electrodes are more effective than iron electrodes in the treatment of oily wastewaters by proving that O&G adsorption capability of ferrous hydroxides are considerably lower than the adsorption capability of aluminum hydroxides.
response surface methodology and by monitoring chemical oxidation demand (COD) and oil & grease (O&G) removals, optimum conditions are determined.
2. MATERIAL AND METHOD
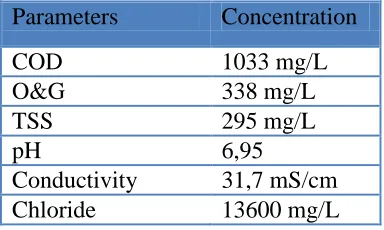
[image:3.596.203.395.269.384.2]The wastewater used in this research was taken from the stabilization tank of Haydarpaşa Port Waste Acceptance Plant. The characterization of bilge water can be seen in Table 1.
Table 1. Characterization of Bilge Water Used
Parameters Concentration
COD 1033 mg/L
O&G 338 mg/L
TSS 295 mg/L
pH 6,95
Conductivity 31,7 mS/cm
Chloride 13600 mg/L
An electrocoagulation reactor made of Plexiglas in size of 60x60x200mm (LxWxH), aluminum electrodes in size of 50x1x220 mm(LxWxH) and a power supply (GW Instek GPS-3030 DD) was used.
All analyses were performed adhering to “Standard Methods for the Examination of Water and Wastewater”. In COD analysis, Method 5220-B, in O&G analysis Method 5520, in TSS analyses Method 2540-D were used. To measure conductivity, Hach Lange HQ 40D conductivity meter is used.
To optimize the experimental data, response surface method, which is a method of the D-optimal designs provided by a computer algorithm, was applied. In order not to make several analyses, response surface method minimizes the number of combinations for the treatment influenced by several variables. Another advantage is that it helps to determine the optimum response and optimum conditions within the variables. After a pre-study was applied, the variables are detected and a matrix is prepared.
3. RESULTS AND DISCUSSION
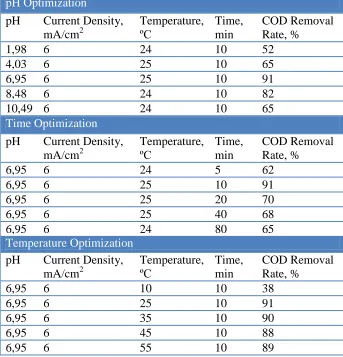
Table 2. Pre-study Results
pH Optimization
pH Current Density, mA/cm2
Temperature, ºC
Time, min
COD Removal Rate, %
1,98 6 24 10 52
4,03 6 25 10 65
6,95 6 25 10 91
8,48 6 24 10 82
10,49 6 24 10 65
Time Optimization
pH Current Density, mA/cm2
Temperature, ºC
Time, min
COD Removal Rate, %
6,95 6 24 5 62
6,95 6 25 10 91
6,95 6 25 20 70
6,95 6 25 40 68
6,95 6 24 80 65
Temperature Optimization
pH Current Density, mA/cm2
Temperature, ºC
Time, min
COD Removal Rate, %
6,95 6 10 10 38
6,95 6 25 10 91
6,95 6 35 10 90
6,95 6 45 10 88
6,95 6 55 10 89
Results taken from the studies under acidic, basic and neutral conditions showed that neutral pH condition is more effective in removal of COD and O&G. As Haris et.al. [20] studied, pollutant removal is increasing when pH is alter to neutral conditions. During process, the pH was observed as increasing. This is a known advantage of electrocoagulation on settling efficiency, without and requirement of pH adjustment by base addition [21]. In the following studies, in order to avoid of pH adjustment costs, the original pH (pH 6,95) of wastewater was used.
When the effect of time in electrocoagulation/electroflotation process was investigated, the COD removal rates were in optimum level in 20 minutes, but as the time passed it started to decrease; because of the TSS increment. When the treatment time was lengthen out, the produced sludge grew, so it caused TSS increment in the effluent.
Temperature is known to be one of the effective mechanisms in the removal of O&G [23-24]. For this purpose, the studies performed under low and high initial temperatures showed that the conditions under 25ºC of inlet temperature were not satisfactory, and any significant change was not seen in O&G removal under the conditions of high inlet temperatures more than 35ºC.
[image:5.596.153.445.165.242.2]
considering current density, temperature and time as variant (Table 3). The complete design matrix involved 20 experiments, and also summarized in Table 4.
Table 3. Working Matrix
Factors Coded Factors
-2 -1 0 +1 +2 Current Density, mA/cm2 x1 3 6 9 12 15
Temperature, ºC x2 20 25 30 35 40
Time, dak x3 0 5 10 15 20
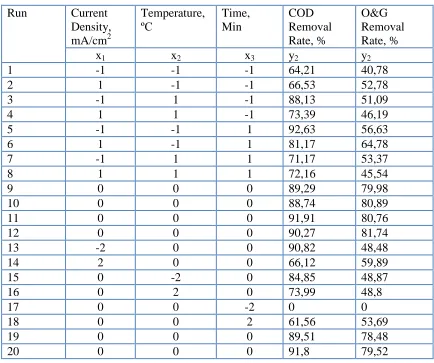
Table 4. Working Conditions Obtain via Response Surface Method
Run Current
Density, mA/cm2
Temperature, ºC
Time, Min
COD Removal Rate, %
O&G Removal Rate, %
x1 x2 x3 y2 y2
1 -1 -1 -1 64,21 40,78
2 1 -1 -1 66,53 52,78
3 -1 1 -1 88,13 51,09
4 1 1 -1 73,39 46,19
5 -1 -1 1 92,63 56,63
6 1 -1 1 81,17 64,78
7 -1 1 1 71,17 53,37
8 1 1 1 72,16 45,54
9 0 0 0 89,29 79,98
10 0 0 0 88,74 80,89
11 0 0 0 91,91 80,76
12 0 0 0 90,27 81,74
13 -2 0 0 90,82 48,48
14 2 0 0 66,12 59,89
15 0 -2 0 84,85 48,87
16 0 2 0 73,99 48,8
17 0 0 -2 0 0
18 0 0 2 61,56 53,69
19 0 0 0 89,51 78,48
20 0 0 0 91,8 79,52
“y” is expressed as a function of independent variables by using second-order polynomial regression model as in the following,
2
0 aixi aijxixj aiixi
a y
[image:5.596.81.515.298.661.2]
where y represents the response variables, a0 is a constant, ai, aii and aij are the linear, quadratic
and interactive coefficients, respectively and xi and xj are the levels of the independent variables. The
variables were coded according to the following equation:
x x xi
0
(Eq.2)
where is the coded value of the independent variable;. xi is its real value; x0 is the its real
value at the center point; and x is the step change in the variable xi. Coded factors and uncoded
factors are listed in Table 3.
Between response surface methodology approaches central composite design is the most widely used one and in this study it was employed to determine the effects of time, current density and temperature on the COD and O&G removal from bilge water (Table 4).
[image:6.596.73.525.311.683.2]The best fitting model was generated by Statistica Program for COD Removal and O&G Removal.
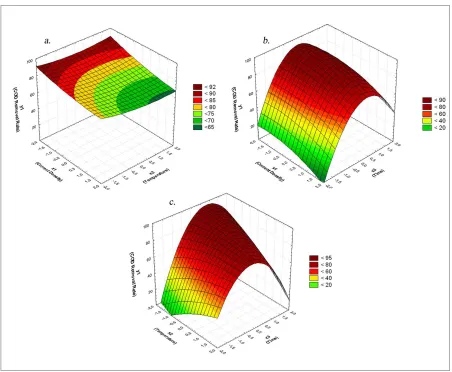
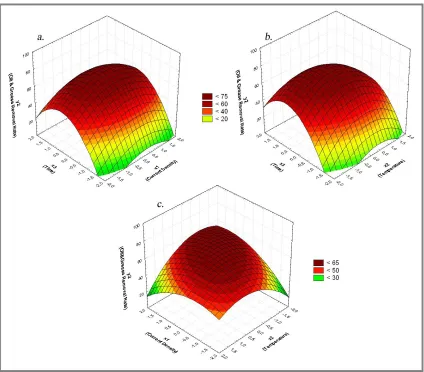
On Figure 1 the graphics that shows the effects of reaction time, current density and initial temperature on COD removal efficiencies can be seen. R2 of the study was %99,1 and the significance in ANOVA results was 1,51 x 10⁻⁷. When the ANOVA results are compared, there was not significant interaction (P > 0,05) between x1x2 and x1x3 within the experimental range. The equation obtained from the model for COD removal can be seen in the following equation (Eq.3).
2 3 2
2 2
1 3
2 3
2
1 2,2781 9,9394 6,7763 2,1447 2,1572 16,0672
7031 , 4 6057 ,
90 x x x xx x x x
y (Eq.3)
Even though a slight decrease on y1 (COD removal) was observed with the increase on x1 (current density) (Figure 1(a) and (b)), changes on x1 (current density) was not seen to be very effective on the COD removal mechanism of applied bilge water. Similarly from Figure 1(b) and (c) the reduction of x2 (temperature) to negative is low effective in removal. It can be said that the main effective parameter was x3 (Time), removal was retrogressed, when it decreased in negative way and increased from app. +0,5. This is also proved by Khandegar and Saroha [26] that when the applied time was more than optimum retention time, a reduction is obderved in the pollutant removal as the adsorbed pollutants desorbs back into supernatant.
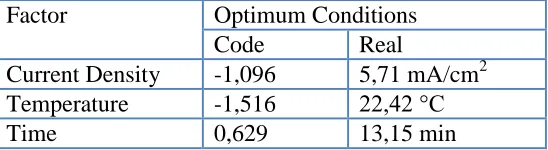
[image:7.596.163.437.439.514.2]Optimum operating conditions obtained from the optimization of three graphics (Fig.1) was shown in Table 5. For COD removal, optimum initial temperature was 22,42 °C, optimum current density is 5,71 mA/cm2 and optimum reaction time was 13,15 minutes. Under these conditions, optimum COD removal was %98,04.
Table 5. Optimum Conditions for the COD Removal
Factor Optimum Conditions
Code Real
Current Density -1,096 5,71 mA/cm2 Temperature -1,516 22,42 °C
Time 0,629 13,15 min
In order to control the formula obtained, the pre-study results was checked if the formula meets. When the current density was 6 mA/cm2, temperature was 25 ºC and the time was 10 minutes; 91% of COD removal rate was obtained in the laboratory study, and 93% of COD removal rate was obtained via formula (It was in the confidence interval of 95%). When the conditions were 6 mA/cm2, 35 ºC and 10 minutes; 90% of COD removal rate was obtained in the laboratory study, and 89% of COD removal rate was obtained via formula (It was in the confidence interval of 95%). When the conditions were 6 mA/cm2, 25 ºC and 5 minutes; 62% of COD removal rate was obtained in the laboratory study, and 60,5% of COD removal rate was obtained via formula. It can be said that the formula for COD was in the confidence internal.
The results of the O&G analyses were evaluated by Statistica 8.0 Program (StatSoft, Inc., USA). On Figure 2 the graphics that shows the combinations of the effects of reaction time, current density and initial temperature on O&G removal efficiencies can be seen. R2 of the graphic was %99,63 and the significance of ANOVA result was 1,84 x 10⁻⁹. When the ANOVA results were compared, there was not significant interaction (P > 0,05) between x1x3 within the experimental range. The equation obtained from the model for O&G removal can be seen in the following equation (Eq.4).
2 3 2 2 2 1 3 2 2 1 3 2 1 4306 , 14 0581 , 8 3456 , 6 3488 , 2 5713 , 4 5881 , 9 4667 , 1 6694 , 2 5589 , 80 x x x x x x x x x x y (Eq.4)
[image:8.596.87.511.349.721.2]As can be seen in all graphics on Figure 2, x1(current density) and x2 (temperature) showed similar behavior on y2 (O&G Removal). When the current density was increased, a decrease on O&G removal was observed [25-26]. Haris et. al. [20] also behold similar effect on removal mechanism as that the current density was increased to 36 mA/cm2 from 21 mA/cm2, the removal was decreased around 10%. It can be said from the Eq.4 that the main effective parameter between x1,x2 and x3 was x3 (time). The removal was low when x3 (time) decreased to negative way, and it gave optimum removal at app. +1,0.
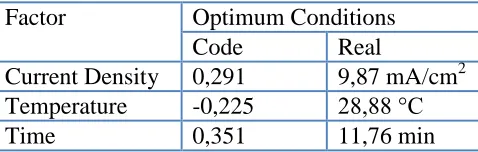
Table 6. Optimum Conditions for O&G Removal
Factor Optimum Conditions
Code Real
Current Density 0,291 9,87 mA/cm2 Temperature -0,225 28,88 °C
Time 0,351 11,76 min
[image:9.596.180.419.104.180.2]Optimum operating conditions obtained from the optimization of three graphics (Fig.2) was shown in Table 6. For O&G removal, optimum initial temperature was 28,88 °C, optimum current density was 9,87 mA/cm2 and optimum reaction time was 11,76 minutes. Under these conditions, optimum O&G removal was %82,8.
Table 7. Optimum Codnitions for both COD and O&G Removal
Factor Optimum
Current Density, mA/cm2 9,87
Temperature, C 28,88
Time, min 13,15
As the similar effects observed in Karhu et.al. [22] that COD and O&G removal showed similar results in our research. Optimum operating conditions obtained from the optimization of three graphics (Fig.3) was shown in Table 7. For both COD and O&G removal, optimum initial temperature was 28,88°C, optimum current density was 9,87 mA/cm2
and optimum reaction time was 13,15 minutes.
but it is not more than that it can not be overcome by application of a conventional ultimate treatment as discussed above.
4. CONCLUSION
Before analyzing optimum conditions by response surface methodology, a pre-study was prepared and belong to data obtained optimum pH was the original pH. With the conditions determined, runs of central composite design were analyzed statistically by Statistica 8.0 Program (StatSoft, Inc., USA).
The optimum conditions belong to both COD and O&G removal were attained with 9,87 mA/cm2 of current density, optimum temperature of 28,88ºC and in 13,15 minutes (optimum reaction time), the COD removal rate was 90,31% and O&G removal rate was 81,74%. For these optimum conditions, effluent concentrations of COD and O&G were 100 and 62mg/L, respectively. Despite the fact that the effluent of O&G is above the discharge limits; but by applying a conventional ultimate treatment, the discharge limits can be provided.
Solely, this is also to be known that this treatment results are for the bilge water that we have worked with. Bilge water can be in very different characterizations. In this research, the bilge water taken from the treatment plant was used and; due to its high conductivity, the performance of electrocoagulation treatment process was investigated. The results obtained are promising and open-to-improvement. In addition, the performance of the treatability of bilge water by direct and indirect electrooxidation processes (for exp. Electrofenton, electrooxidation with Ti / BDD electrodes) and also the energy potential of all electrochemical treatment processes is an important issue to be investigated.
References
1 Caplan, J.A., Newton, C., Kelemen, D., Marine Maritime, 37(2) (2000) 111–3314.
2 Woytowich, D.L., Dalrymple, C.W., Gilmore, F.W. , Britton, M.G., MTS Journal, 27(1) (1993) 62–67.
3 Peng, H., Tremblay, A.Y., Veinot, D.E., Desalination, 149 (2002) 151-152. 4 Tremblay, A,Y., Peng, H., Veinot, D.E., Desalination, 181 (2005) 109-120.
5 Benito, J.M., Sanchez, M.J., Pena, P., Rodriguez, M.A., Desalination, 214 (2007) 91–101. 6 Gryta, M., Karakulski, K., Morawski W.A., Water Res., 35(15) (2001) 3665-3669.
7 Bernal, J.L., Miguélez, J.R.P., Sanz, E.N., J. Hazard. Mater., B67 (1999) 61–73. 8 Yang, L., Lai, C-T., Shieh, W.K., Water Res. 34(13) (1999) 3303–3314.
9 Karakulski, K., Morawski, W.A., Grzechulska, J., Sep. Purif. Technol., 14 (1998) 163–173. 10 Beck, E. C., Giannini, A. P., Ramirez, E. R., J. Hazard. Mater. 22 (1974) 18-19.
11 Tir, M., Moulai-Mostefa, N., J. Hazard. Mater., 158 (2008)107-115.
12 Khemis, M., Tanguy, G., Leclerc, J.P., Valentin, G., Lapıque, F., Inst. of Chem. E., 83(B1)(2005) 50-57.
13 Kurt U., Gonullu M.T., Ilhan F.,Varinca K., Environ. Eng. Sci. 25 (2) (2008) 153-161
14 Asselin, M., Drogui, P., Brar, S. K., Benmoussa, H., Blais, J.F., J. Hazard. Mater., 151 (2008) 446-455.
17 Ibanez, J.G., Takimoto, M.M., Vasquez, R.C., Basak, S., Myung, N., Rajeshwar, K., J. Chem. Edu.; 72 (1995) 1050–1052.
18 Ogutveren, U.B., Koparal, S., J. Environ. Sci. Heal. A 32 (9–10) (1997) 2507–2520. 19 Emamjomeh, M.M., Sivakumar, M., J. Environ. Manage., 90 (2009) 1663-1679.
20 Hariz I.B., Halleb A. ,Adhoum N., Monser L., Sep. Purif. Technol., 107 (2013) 150–157. 21 Aji B.A., Yavuz Y., Koparal A.S., Sep. Purif. Technol. 86 (2012) 248–254
22 Karhu M., Kuokkanen V., Kuokkanen T., Rämö J., Sep. Purif. Technol.,96 (2012) 296–305 23 Korbahti B.K., Artut K., Desalination 258 (2010) 219–228
24 Yu L., Han M., He F., Arab. J. Chem. (2013) in Press
25 Lakshmi P. M., Sivashanmugam P., Sep. Purif. Technol 116 (2013) 378–384 26 Khandegar V., Saroha A.K., J. Environ. Manage. 128 (2013) 949 – 963
27 Moreno-Casillas A.H., Cocke D.L., Gomes J.A.G., Morkovsky P., Parga J.R., Peterson E., Sep. Purif. Technol., 56 (2007) 204–211