R E S E A R C H
Open Access
Modeling of non-Gaussian colored noise
and application in CR multi-sensor networks
Zheng Dou, Chengzhuo Shi
*, Yun Lin and Wenwen Li
Abstract
Motivated by the practical and accurate demand of intelligent cognitive radio (CR) sensor networks, a new modeling method of practical background noise and a novel sensing scheme are presented, where the noise model is the non-Gaussian colored noise based onαstable process and the sensing method is improved fractional low-order moment (FLOM) detection algorithm with balance parameter. First, we establish the non-Gaussian colored noise model through combiningα-distribution with a linear system represented by a matrix. And a fitting curve of practical noise data is given to verify the validity of the proposed model. Then we present a parameter estimation method with low complexity to obtain the balance parameter, which is an important part of the detection algorithm. The balance parameter-based FLOM (BP-FLOM) detector does not require any a priori knowledge about the primary user signal and channels. Monte Carlo simulations clearly demonstrate the performance of the proposed method versus the generalized signal-to-noise ratio, the characteristic exponentα, and the number of detectors in sensing networks.
Keywords: Non-Gaussian colored noise model, BP-FLOM, Estimation, Practical noise data, CR multi-sensor networks
1 Introduction
The cognitive radio (CR) nodes with sensing and adap-tive abilities have been recognized as a promising solution [1] to realize the next-generation intelligent sensing net-works; the key ideas behind detector nodes lie in sensing spectrum information accurately under the practical noise background. Gaussian white noise are typically used to model practical noise processes that affect digital sensing systems [1], such as the multi-radar system and under-water acoustic detection system. In practice, however, Gaussian models reveal difficulties in fitting data that often have distinct spiky and impulsive characteristics leading them deviate from Gaussian distributions which is known as non-Gaussian [2]. Such non-Gaussian makes the common Gaussian assumption not valid for tradi-tional spectrum sensing [3]. One of the most important challenges in sensor networks is to detect as quickly and reliably as possible the absence or presence of the signal in complex radio environments such as those character-ized by non-Gaussian noises. Thus, the effective model of
*Correspondence: [email protected]
School of Electronics and Information Engineering, Harbin Engineering University, Nantong Street No.145, Nangang District, 150001 Harbin, China
practical noise and the realization of accurate detection are the main problems to be solved.
Non-Gaussian noise impairments may result from human factors and the natural factors, such as man-made impulse noise, electromagnetic equipment, atmospheric storms, and out of band spectral leakage [4, 5]. The non-Gaussian noise model should not only take into account its exact description of the nature for the noise, but also the simplicity of the calculation. Large measured data show that the probability density distribution of the impulse noise process is similar to the Gaussian pro-cess: symmetrical, smooth, and bell-shaped, but its tail is heavier than the Gaussian distribution [6]. The Gaus-sian mixture density (GMD) [7], centered generalized Gaussian density (GDD) [8], and the symmetricα-stable (SαS) density distribution [9] are most common models in recent years. The SαS distribution has proved to be the most promising model to fit many impulsive noise pro-cesses in communications channels, and, in fact, includes the Gaussian density as a special case [10]. Due to its good performance, theα-stable distribution is used to fit the noise and interference in cognitive radio multi-sensor networks [11, 12], but the colored noise is not considered.
Many spectrum sensing schemes for non-Gaussian noise has been presented in many literatures. The perfor-mances of Cauchy detector and global optimal detector are not ideal in the non-Gaussian noise [13, 14]. Polarity-Coincidence-Array (PCA)-based spectrum sensing is pro-posed in [15], a significant performance enhancement is achieved by the PCA detector, but the prior knowledge such as the variance of the noise and the PU signal cyclic frequency are also needed in the algorithm, which is diffi-cult in practical system. The Lp-Norm Spectrum Sensing method for cognitive radio networks is presented in [16]. It does not require any prior knowledge about the non-Gaussian noise, but the condition that the noise do not have second-order statistics and high-order statistics such asα-stable distribution are not taken into account, there are limitations when applied. The authors proposed a novel FLOM-based detector for the detection of a primary user in the SαS noises that can significantly enhance the detection performance compared to other detector algo-rithms [4, 17]. But it is same to other detection algoalgo-rithms, it is applicable only in the background non-Gaussian white noise. In addition, the algorithm relies on the characteris-tic exponentαof the SαS distribution, but it is difficult to obtain in the actual detection process.
Although non-Gaussian noise in sensing networks are given a variety of modeling and spectrum detection algo-rithm [18], most of them remain in the simulation and limit to white noise. We sample the practical noise data in laboratory environment with CR equipment USRP X-300 and analyze the power spectrum density. The result shows that it is not flat, which means the CR sensing system is working in the background of colored noise. That is why the performance of the algorithm mentioned above is declined when applied to practice, as pointed in [19, 20]. Therefore, we propose a novel model to describe the non-Gaussian colored noise and present a new detection method to sensing signals. What is more, at special values, Gaussian white noise or non-Gaussian white noise can be included, which is more widely used in the practical system.
In this paper, we first fit the curve of practice noise data to study its characteristics and give a novel model to present the colored non-Gaussian noise through combin-ing symmetricα-distribution with a linear system repre-sented by a matrix. Then we give an improved method to estimate the parameters (characteristic exponent α and dispersion γ same to α-stable density distribution) of the new distribution from a time series [21]. Accord-ing to the estimation result, we propose a new sens-ing method of balance parameter-based fractional lower order moment (BP-FLOM), referred to as BP-FLOM detector. No prior knowledge is needed and the calcula-tion is simplified. We also investigate the deteccalcula-tion per-formance with different characteristic exponentαand the
performance at different signal-to-noise ratios. In addi-tion, multi-sensor performance is also simulated to verify the validity.
The remainder of this paper is organized as follows: In Section 2, we present the analysis of practical noise and establish the model of non-Gaussian noise. The estima-tion method for the new model is proposed in Secestima-tion 3, and we give a new BP-FLOM algorithm based on the estimation result. Simulations results and analysis are presented in Section 4 and we conclude the paper in Section 5.
2 Observation models and problem description
In this section, a brief description of the most commonly models used in survival literature for the CR sensing node is provided. They include the system model of CR networks [22] and the symmetricα-stable density distri-bution [17]. And the new model is presented based on the analysis of practical noise data.
2.1 System model
Assume that the CR comprised of one Primer User (PU) andMSecondary Users (SU). The received observation vector at the multi-sensors CR form the PU at time n under each hypothesis (PU absent/present) is given by
H0:Ym[n]=ξm[n] , n=0, 1,. . .,N−1. H1:Ym[n]=Sm[n]+ξm[n] ,n=0, 1,. . .,N−1.
(1)
where Ym[n]=[y1(n),y2(n),. . .,ym(n)]T is the sample of received signal by mth detector at the time n, N is the length of the sample sequence. ξm[n]= [ξ1(n),ξ2(n),. . .,ξm(n)]Tis an additive background noise andSm[n] is primary signal to be detected. The primary signal is assumed to be random sequence of Gaussian distributions, and symmetric α-stable distribution has proved to be a good way to describe the non-Gaussian noise [4].
The probability density function (PDF) of an α -stable random variable cannot be given in closed form, but the characteristic function can always be given as followed [23]
2.2 Noise model
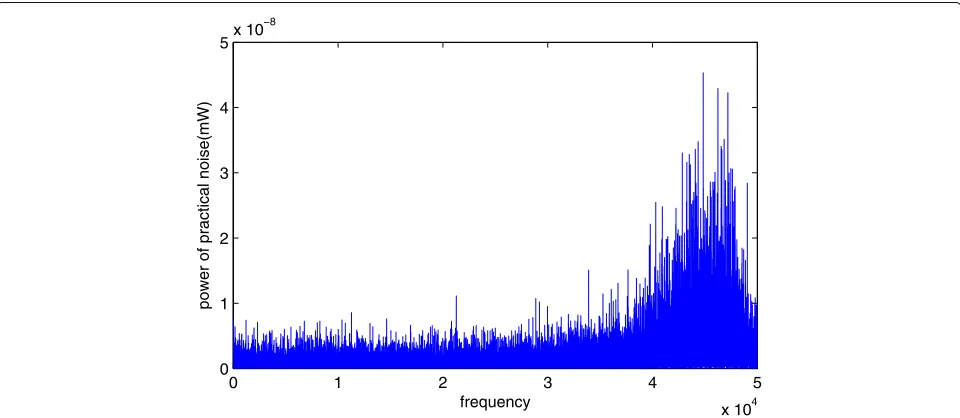
The power spectral density of the practical noise is shown in Fig. 1. It is obvious that the power spectral density of practical noise is not flat. So the SαS distribution can not describe the practical noise perfectly as it is colored. To describe the practical noise accurately, we analyze the characteristics of SαS distribution as follows.
ifX(n),∀n ∈ {1, 2,. . .,N}are independent and identi-cally distributed (I.I.D) copies ofXand
N
n=1
anX(n)Xnew (3)
whereN∈Z+andan,c∈R, thenXnewis the SαS distribu-tion with same parameterα[17]. According to the nature of colored noise that the noise in the sequence is corre-lated at each moment, we consider the colored noise to be a linear output driven by a white noise sequence. We propose a novel model for non-Gaussian colored noise as
ξ(n)=XT(n)·A
=
n
i=1
Xi∼(α, 0,aiγ, 0)
=Xnov∼(α, 0,γnov, 0)
(4)
whereX[n]=[x(n),x(n−1)] ,. . .,x(0)]T, is the sequence of SαS distribution. A =[a1,a2,. . .,aN] is the linear transformation matrix. ξ(n) = Xnov ∼ (α, 0,γnov, 0) is the colored noise sequence and has the same character-istic exponent to X(n) according to [17]. In particular, when special parameter is taken as A =[a1, 0,. . ., 0],
the proposed model is the SαS distribution. The PDF of the new model based on SαS and different characteristic
exponentα are plotted in Fig. 2. As expected, the heavy tail of non-Gaussian colored noise is consistent with the characteristics of theαdistribution.
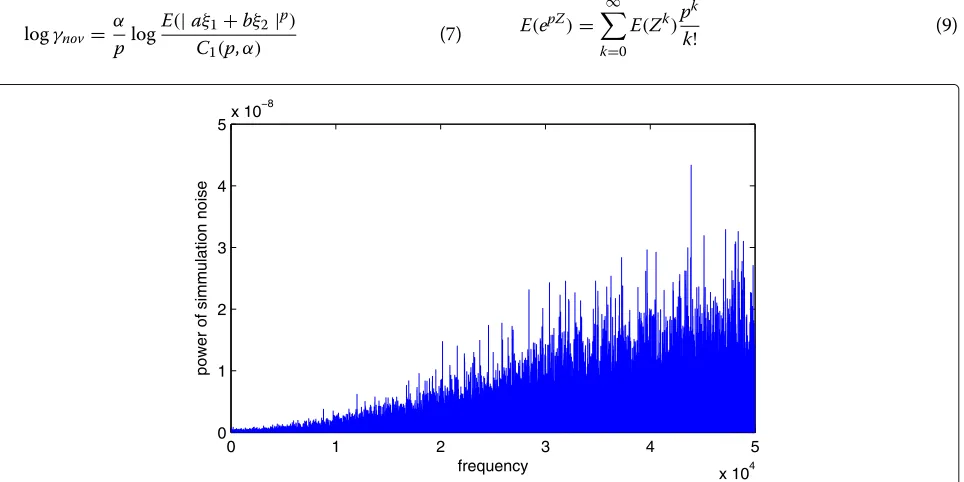
The power spectral density of the novel model is shown in Fig. 3, it can be concluded that it is very close to the practical noise that proves the validity of the model. As the SαS distribution has only the fractional lower moments, and its variance does not exist, the conventional signal-to-noise ratio is meaningless. So the signal-to-signal-to-noise ratio for non-Gaussian colored noise is defined by mixed signal-to-noise, we call it general signal-to-noise ratio (GSNR)
GSNRdB=10log10
σ2
s γnov
(5)
whereσs2is the variance of Gaussian signal, andγnovis the dispersion scale of Gaussian colored noise. The GSNR will be applied to the subsequent simulation analysis.
3 BP-FLOM-based spectrum sensing
In this section, we propose a new spectrum sensing scheme, namely balance parameter-based fractional low-order moment (BP-FLOM) detector, for the non-Gaussian colored noise background. Adopted parameter estimation method associated with the proposed BP-FLOM method along with the potential of employing BP-FLOM detector in cooperative sensing is presented.
3.1 Estimation of characteristic exponentαandγnov As introduced in Section 2, we assume thatξ =aξ1+bξ2, ξ1 and ξ2 are I.I.D sequence, the non-Gaussian colored
noiseξ has the same characteristic exponentαwith SαS, and a different dispersion scaleγnov. To simplify the cal-culation, we do not consider the specific value ofγnov, and
0 1 2 3 4 5
x 104 0
1 2 3 4 5x 10
−8
frequency
power of practical noise(mW)
3 3.5 4 4.5 5 0
0.005 0.01 0.015 0.02 0.025 0.03 0.035
Tail of Symmetric colored noise densities (β = 0, γ = 1, δ = 0)
Argument of PDF
PDF of S
α
S
α = 0.5
α = 1.0
α = 1.25
α = 1.5
α = 2
Fig. 2PDF tails of non-Gaussian colored noise with different characteristic exponentα
assume it is a known parameter. Then we improve the esti-mation method in [21], so it has a finite factional lower order moment foraξ1+bξ2
E(|aξ1+bξ2|p)=C1(p,α)γnovp/α, for 0<p< α (6) whereC1(p,α) = 2
p (p+1
2 ) (1−p/α)
√
π (1−p/2) , 0 < α ≤ 2,γ is the dispersion scale and (·)is the gamma function. Then we obtained from (6)
logγnov= α plog
E(|aξ1+bξ2|p)
C1(p,α)
(7)
Ifpth order ofξsatisfies (6), we can write E(|aξ1+bξ2|p))
asE(eplog|aξ1+bξ2|)and define a new variableZ=log|aξ1+
bξ2|. Then
E(|ξ|p)=Eeplog|aξ1+bξ2|=EepZ, 0<p< α
(8)
where E(epZ) is the moment-generating function ofZ. The power series can be expressed by
E(epZ)= ∞
k=0
E(Zk)p k
k! (9)
0 1 2 3 4 5
x 104 0
1 2 3 4 5x 10
−8
power of simmulation noise
frequency
It is obvious that the moment ofZis finite in any order, together with (6) we have
E(Zk)= d k
dpk(C1(p,α))γ p/α
nov, p=0 (10)
Simplify the above equation according to [21]
Elog|aξ1+bξ2| characteristic exponent, then combined (6) and (11) we have
Equation (12) can be used to estimateαin this way with-out calculating the value ofγnov, and it is easily obtained with (11).
Simulation result is given in Table 1. As can be seen from the table, we can estimate the value ofα exactly with a small relative error when the sampling of noise sequence is enough. The verification of the estimation method will be discussed in Section 4.
3.2 Spectrum sensing based on balance parameter We have known that the fractional low-order moment detection (FLOM) has a good performance under the SαS distribution noise that is presented in [4], and it is more suitable than Cauchy detector. But when applied to the non-Gaussian colored noise background, the performance is declined. Based on the analysis in Section 2, we give the hypothesis A: The practical non-Gaussian colored noise is obtained by the linear transformation of the non-Gaussian white noise sequence obeying the SαS distribution.
Since the impulse response of linear transformation is difficult to compute without prior knowledge, we propose a simpler and more accurate approximation algorithm.
3.2.1 Derivation of sensing threshold
It is easy for us to obtain a SαS distribution sequence based on the parameterαe, Xk ∼ (αe, 0, 1, 0),αeis esti-mated by the estimation algorithm presented in Section 2,
which is same to the practical noise sequence. Then, the sensing threshold of detector for the constructed sequenceXk ∼ (αe, 0, 1, 0), which is non-Gaussian white noise will be derived according to [4]. The detection statistic obtained in multi-user detection is :
TF =
whereMis the number of detectors, andNis the observa-tion signal of each detector. 0<pe< αe/2 is the order of the fractional moment, and it is the only parameter to be determined. Then make a comparison by statisticsTFand thresholdη, ifTF > η, it is considered that the primary signal is present, otherwise it is absent. The detection sig-nal does not require any priori information such as the channel gain and primary signal. It is practical and pro-vides a scheme for the detection of non-Gaussian colored noise. The expressions for the probability of false alarm and the detection under the hypothesis H0 andH1 are
derived, including the multi-detectors.
Under hypothesisH0, the mean of theTF is calculated by
According to the properties ofαstable distribution, the fractional lower order moments of any SαS random vari-ableScan be represented by its characteristic indexαand the dispersion scaleγ [24]
E(|S|p)=C(p,α)γp/α, for p< α (15) Eq. (14), it can be rewritten as
μ0=
Table 1Estimation ofα. The estimation result ofαwith different sample size, where real value is 1.5 and 1.2
Sample size 1000 5000 10,000 50,000
Test result 1.5301 1.4994 1.5088 1.5009
Real value 1.5 1.5 1.5 1.5
Relative error 2% 0.4% 0.59% 0.6%
Test result 1.2117 1.2030 1.1946 1.2021
Real value 1.2 1.2 1.2 1.2
And the variance of statistic underH0
According to the central limit theorem,TFis a Gaussian random variable whenNis large enough. With the result μ0in (17)andσ02in (18), the probability of false alarm is
Thus, the sensing threshold for constructed sequence Xk∼(αe, 0, 1, 0)is then
ηt=
σ2
0Q−1(Pfa1)+μ0, Pfa1≤ ¯Pfa1 (20)
3.2.2 Balance parameter-based FLOM detector
The simulation curve of ηt and thePfa1 for the Xk ∼ (αe, 0, 1, 0)constructed in the previous section can be fit-ted easily. When thePfa1is determined,ηtcan be obtained by (21). But if we use this value as standard sensing thresh-old, detection is invalid. So, another statisticsTpis needed to calculate the balance parameter.
According to hypothesis A, we assume that ξ(n) is the non-Gaussian noise sequence under H0, a different
statistics ofξ(n)can be obtained.
TP= 1
When the sampling sequence N is large, according to the central limit theorem, the statistical values of the two sequences tend to be stable value. Then we have the equation
ηp=ηt· (22)
where=TF/TP, we call it the balance parameter.ηpis the sensing threshold for practical sensing node. In partic-ular, when vector A in Section 2.2 is [ 1, 0,. . ., 0], = 1
where
φm,1=pe(2pe−1)C(2pe−2,αe)γe2(pe−1)/αe
−pe(pe−1)C(pe,αeγepe/αe)(2pe−2,αe)γe(pe−2)/αe According to the central limit theorem,TFis a Gaussian random variable whenNis large enough. With the result μp0in (24)andσp20in (25), the probability of false alarm is
obtained
Pfa= {TP> ηP|H0} =Q
⎛ ⎜
⎝ηt−μp0 σ2
p0
⎞ ⎟
⎠ (28)
and detection probability withμp1andσp21
Pd= {TP> ηP |H0} =Q
⎛ ⎜
⎝ηt−μp1 σ2
p1
⎞ ⎟
⎠ (29)
whereμpi andσi2 (i = 1, 2) are the mean and variance of practical noise sequence. The expression of probability detection can be deduced by the combination of (28) and (29)
Pd=Q ⎛ ⎜ ⎝
σ2
0
Q−1(Pfa)+μp0−μp1
σ2
p1
⎞ ⎟
⎠ (30)
Substituting(26−28)into (31)
Pd=Q ⎛ ⎜ ⎝
σ2
0
Q−1(Pfa)−!Mm=1φm,0
σ2
0 + σ2
s
M2N
!M
m=1φm,1
⎞ ⎟
⎠ (31)
The optimalPdcan be obtained by searching for the order vectorpm¯ becauseσ02,φm,0andφm,1are all related topm¯. Then numerical computation of (31) will be conducted in Section 4 as well as Monte Carlo simulations to validate our algorithm.
4 Simulation results
In this section, the simulation result will be discussed to evaluate the performance of the novel model for non-Gaussian colored noise as well as the BP-FLOM detector.
4.1 Effectiveness of noise models
First, we investigate the effectiveness of the non-Gaussian colored noise model as well as the parameter estimated method. The comparison for power spectral density is presented in Section 2, the proposed non-Gaussian col-ored noise model has the same statistical properties to the practical noise.
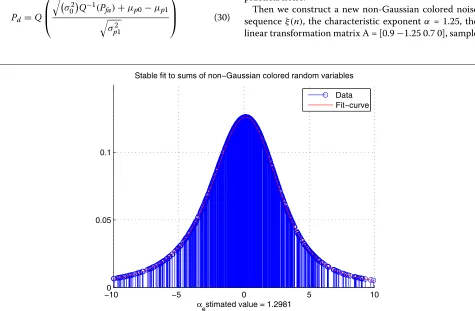
Then we construct a new non-Gaussian colored noise sequenceξ(n), the characteristic exponentα = 1.25, the linear transformation matrix A = [0.9−1.25 0.7 0], sample
−100 −5 0 5 10
0.05 0.1
Stable fit to sums of non−Gaussian colored random variables
αestimated value = 1.2981
Data Fit−curve
Table 2Estimation of result. The estimation result ofαwith different sample size, where real value is 1.5
Estimation times 1 2 3 4
Test result 1.2426 1.2513 1.2486 1.2509
Real value 1.25 1.25 1.25 1.25
Relative error 0.59% 0.14% 0.11% 0.07%
size is set toL= 100,000. As shown in Fig. 4, the distribu-tion of the data follow the shape of the probability density distribution.
Next we estimate the parameters of the sequence to draw a new fit curve. It is obvious that the fitted curve is consistent with the data distribution. The estimation result is shown in Table 2. The result of parameter esti-mation is very close to the parameterαof the constructed sequence, and the estimation relative error is very small.
In conclusion, the proposed model has the same sta-tistical characteristics, the practical noise is estimated, and the reconstructed data are consistent with the actual ones. all the analysis above show that non-Gaussian col-ored noise model we proposed can describe the real noise accurately.
4.2 The performance of BP-FLOM detector
We assume that the primary signal is Gaussian with 0 mean, variance σs2, the noise background is the non-Gaussian colored noise based on I.I.D SαS with dispersion scaleγ = 1. We set the sample sizeN = 1000, and the simulation results are achieved by 20,000 Monte Carlo simulations.
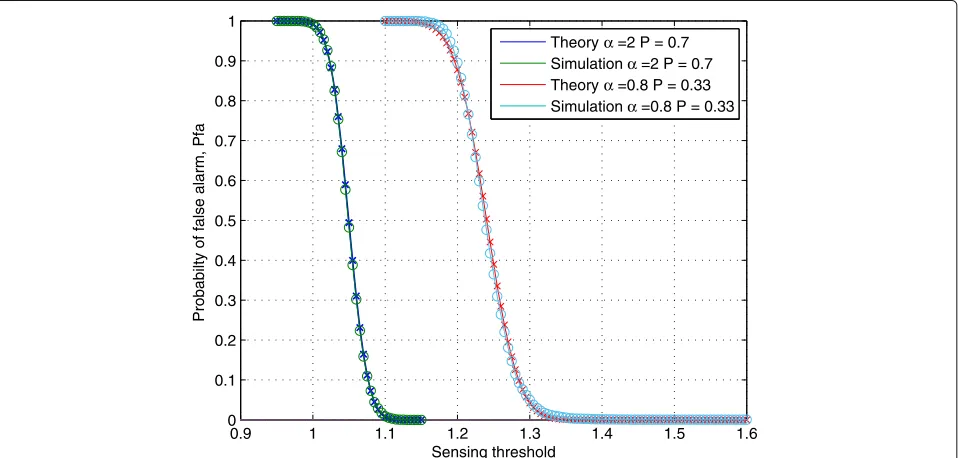
Figure 5 shows the curves of the detection threshold versus the probability of false alarm, and different values for the single-node detection parameters. Curves labeled with “theory” are calculated according to expression (28), curves labeled with “simulation” are obtained statistic and detection threshold. In the case of cooperative detection, we setα1 = 2,p1 = 0.7 for the first detector andα2 =
0.8,p2 = 0.33. Figure 6 shows M = 2 for cooperative
detection, the comparison is also displayed. It proves that the simulation is consistent with the theory.
Figure 7 shows the comparison of the three sets of simulation results, and the range of GSNR is −15 ∼ 5 dB. Three different characteristic exponents and corre-sponding fractional lower order are presented to make a comparison between FLOM detector and the BP-FLOM we proposed. When the characteristic componentα =2, it is the Gaussian colored noise and the performance of the two algorithm is close to each other. For α = 1.5 andα = 0.8, our proposed detector has a better detec-tion performance than the FLOM detector under all levels of GSNR. For instance, when GSNR =−4dB, Pfa = 0.1 andα = 1.5, the probability of detection of our detec-tor is 71.4%, but that of the FLOM detecdetec-tor is 42% only,
0.9 1 1.1 1.2 1.3 1.4 1.5 1.6
0 0.1 0.2 0.3 0.4 0.5 0.6 0.7 0.8 0.9 1
Sensing threshold
Probabilty of false alarm, Pfa
Theoryα =2 P = 0.7 Simulationα =2 P = 0.7 Theoryα =0.8 P = 0.33 Simulationα =0.8 P = 0.33
0.9 1 1.1 1.2 1.3 1.4 1.5 0
0.1 0.2 0.3 0.4 0.5 0.6 0.7 0.8 0.9 1
Sensing threshold
Probabilty of false alarm, Pfa
Theory M = 2 simulation M = 2
Fig. 6Probability of false alarm versus detection threshold of a multi-detector. The number of detector is 2, and the comparison of theory and simulation result are displayed
which fails to detect the primary signal. But the detection is effective only under a large GSNR whenα = 0.8. In summary, the performance of BP-FLOM detector is better than FLOM detector in the background of non-Gaussian colored noise.
Figure 8 shows the performance of the BP-FLOM detec-tor under single detection and multi-detection; it is obvi-ous that the performance of multi-detection is much
better than that of single detection. For example, the prob-ability of detection of multi-detection is 75% while the single detection is 42%, under the same conditionPfs = 0.1.
Figure 9 shows the ROC curves of the BP-FLOM detec-tor, both the simulation and theory curves. The simulation result are obtained with different values ofp = 0.33 and p=0.7 under two values of GSNR (−5 dB and−10 dB ).
−150 −10 −5 0 5
0.1 0.2 0.3 0.4 0.5 0.6 0.7 0.8 0.9 1
GSNR(dB)
Praobability of detection, Pd
BP−FLOM,α = 2 BP−FLOM,α =1.5 BP−FLOM,α = 0.8 FLOM,α = 2 FLOM,α = 1.5 FLOM,α = 0.8
0 0.2 0.4 0.6 0.8 1 0
0.1 0.2 0.3 0.4 0.5 0.6 0.7 0.8 0.9 1
Probability of false alarm, Pfa
Probability of detection
M=1,GSNR=−10,P=0.33 M=2,GSNR =−10,P=0.33
Fig. 8ROC of BP-FLOM detector with different number of detectors.M=2 andM=1 represent different number of detectors for sensing
The theory curves are obtained with (31) under the same conditions. As shown in the figure, our proposed detector performs better for smaller values ofp. For example, the probability of detection is 70% withp = 0.33 while 37% withp=0.7, under the same GSNR =−10 dB.
5 Conclusions
This paper propose a novel non-Gaussian noise model based on the analysis of practical noise, and present a
balance parameter-based fractional low-order moment (BP-FLOM) detector. It was shown that although the BP-FLOM scheme exhibits an approximately identical detection performance with the FLOM detector when it is Gaussian colored noise, performance is better when the background is the non-Gaussian colored noise, and the multi-detection performance is much better than FLOM detector and single detector. Simulation results, as well as the presented analysis, conform to the superior
0 0.2 0.4 0.6 0.8 1
0 0.1 0.2 0.3 0.4 0.5 0.6 0.7 0.8 0.9 1
Probability of false alarm (Pfa)
Probability of detection (Pd)
Theory GSNR=−5,P=0.33 simulation GSNR =−5,P=0.33 theory GSNR=−10,P=0.33 simulation GSNR =−10,P=0.33 Theory GSNR=−5,P=0.7 simulation GSNR=−5,P=0.7 Theory GSNR=−10,P=0.7 simulation GSNR=−10,P=0.7
performance of the proposed balance parameter-based sensing scheme relative to competing solutions, in partic-ular, the balance parameter is self adjusted when the noise sequence changed, which is practical for the system.
Acknowledgements
This work was supported by the National Nature Science Foundation of China (no. 61301095), National Nature Science Foundation of China (no. 61671167).
Authors’ contributions
CS proposed the non-Gaussian colored noise based on SαS distribution and presented a new detection method of balance parameter-based FLOM detector. CS completed all the computer simulation and wrote the whole paper as well as the proofreading. All authors read and approved the final manuscript.
Competing interests
The authors declare that they have no competing interests.
Publisher’s Note
Springer Nature remains neutral with regard to jurisdictional claims in published maps and institutional affiliations.
Received: 18 July 2017 Accepted: 7 November 2017
References
1. M Bkassiny, AL De Sousa, SK Jayaweera, Wideband spectrum sensing for cognitive radios in weakly correlated non-gaussian noise. IEEE Commun. Lett.13, 266–267 (1996)
2. JMS Proakis,Digital Communications. (McGraw-Hill higher education, New York, 2007)
3. M Bkassiny, SK Jayaweera, Robust, non-gaussian wideband spectrum sensing in cognitive radios. IEEE Trans. Wirel. Commun.13, 6410–6421 (2014)
4. BC Xiaomei Zhu, W-P Zhu, Spectrum sensing based on fractional lower order moments for cognitive radios in -stable distributed noise. Signal Process.11, 94–105 (2015)
5. TM Taher, MJ Misurac, JL LoCicero, DR Ucci, Microwave oven signal interference mitigation for wi-fi communication systems. IEEE Consum. Commun. Netw. Conf.13, 67–68 (2008)
6. G Laguna-Sanchez, M Lopez-Guerrero, On the use of alpha-stable distributions in noise modeling for plc. IEEE Trans. Power Deliv.30, 1863–1870 (2015)
7. Y Zhao, X Zhuang, S-J Ting, Gaussian mixture density modeling of non-gaussian source for autoregressive process. IEEE Trans. Sig. Process.
4, 894–903 (1995)
8. MS Allili, N Baaziz, M Mejri, Texture modeling using contourlets and finite mixtures of generalized gaussian distributions and applications. IEEE Trans. Multimed.16, 772–784 (2014)
9. F Wen, Diffusion least-mean p-power algorithms for distributed estimation in alpha-stable noise environments. Electron. Lett.49, 1355–1356 (2013)
10. K Pelekanakis, M Chitre, Adaptive sparse channel estimation under symmetric alpha-stable noise. IEEE Trans. Wirel. Commun.13, 3183–3195 (2014)
11. X Yang, AP Petropulu, Co-channel interference modeling and analysis in a poisson field of interferers in wireless communications. IEEE Trans. Signal Process.1, 64–76 (2003)
12. MZ Win, PC Pinto, LA Shepp, A mathematical theory of network interference and its applications. Proc. IEEE.97, 205–230 (2009) 13. EE Kuruoglu, WJ Fitzgerald, PJW Rayner, Near optimal detection of signals
in impulsive noise modeled with a symmetric alpha-stable distribution. IEEE Commun. Lett.2, 282–284 (1998)
14. HG Kang, I Song, S Yoon, YH Kim, A class of spectrum-sensing schemes for cognitive radio under impulsive noise circumstances: Structure and performance in nonfading and fading environments. IEEE Trans. Veh. Technol.59, 4322–4339 (2010)
15. T Wimalajeewa, PK Varshney, Polarity-coincidence-array based spectrum sensing for multiple antenna cognitive radios in the presence of non-gaussian noise. IEEE Trans. Wirel. Commun.10, 2362–2371 (2011) 16. F Moghimi, A Nasri, R Schober, Adaptive l-p norm spectrum sensing for
cognitive radio networks. IEEE Trans. Commun.59, 1934–1945 (2011) 17. A Mahmood, M Chitre, MA Armand, On single-carrier communication in
additive white symmetric alpha-stable noise. IEEE Trans. Commun.62, 3584–3599 (2014)
18. D Middleton, Non-gaussian noise models in signal processing for telecommunications: new methods an results for class a and class b noise models. IEEE Trans. Inf. Theory.45, 1129–1149 (1999)
19. G Laguna-Sanchez, M Lopez-Guerrero, On the use of alpha-stable distributions in noise modeling for plc. IEEE Trans. Power Deliv.30, 1863–1870 (2015)
20. G Bansal, MJ Hossain, P Kaligineedi, H Mercier, C Nicola, U Phuyal, MM Rashid, KC Wavegedara, Z Hasan, M Khabbazian, VK Bhargava, inAFRICON 2007. Some research issues in cognitive radio networks (IEEE, 2007), pp. 1–7
21. X Ma, CL Nikias, Parameter estimation and blind channel identification in impulsive signal environments. IEEE Trans. Signal Process.43, 266–267 (1995)
22. A Margoosian, J Abouei, KN Plataniotis, An accurate kernelized energy detection in gaussian and non-gaussian/impulsive noises. IEEE Trans. Signal Process.63, 5621–5636 (2015)
23. WJ Szajnowski, JB Wynne, Simulation of dependent samples of symmetric alpha-stable clutter. IEEE Signal Process. Lett.8, 151–152 (2001) 24. GA Tsihrintzis, CL Nikias, Performance of optimum and suboptimum