ISSN(Online): 2320-9801
ISSN (Print): 2320-9798
I
nternational
J
ournal of
I
nnovative
R
esearch in
C
omputer
and
C
ommunication
E
ngineering
(An ISO 3297: 2007 Certified Organization)
Vol. 4, Issue 1, January 2016
Threshold Based Segmentation Using Block
Processing
M.Chandrakala1, P.Durga Devi2
Assistant Professor, Department of ECE, MGIT, Hyderabad, Telangana, India1
Assistant Professor, Department of ECE, MGIT, Hyderabad, Telangana, India2
ABSTRACT: Image segmentation is a significant technology for image processing. Many segmentation methods
brought forward to deal with image segmentation, among these thresholding is more appropriate. This paper describes thresholding technique based on block processing, which removes non uniform illumination background. In this paper we compared proposed algorithm with the existing algorithms. We evaluated the performance of each algorithm. The performance evaluation is done on the basis of speed, PSNR, NAE, AD. After simulation, we have come to the conclusion that the proposed algorithm gives better result.
KEYWORDS: Image Segmentation, Thresholding, PSNR, NAE, AD.
I. INTRODUCTION
Thresholding is an important technique in image segmentation applications. The basic idea of thresholding is to select an optimal gray-level threshold value for separating objects of interest in an image from the background based on their gray-level distribution. While humans can easily differentiate an object from complex background and image thresholding is a difficult task to separate them [3].
Image segmentation by thresholding is a simple but powerful approach for segmenting images having light objects on dark background [3]. Thresholding technique is based on image space regions i.e. on characteristics of image [2]. Thresholding operation convert a multilevel image into a binary image i.e., it choose a proper threshold T, to divide
image pixelsinto several regions and separate objects from background.
The gray-level histogram of an image is usually considered as efficient tools for development of image thresholding algorithms. Thresholding creates binary images from grey-level ones by turning all pixels below some threshold to zero and all pixels above that threshold to one. If g(x, y) is a threshold version of f(x, y) at some global threshold T, it can be defined as [3],
g (x, y) = 1 if f(x, y) ≥ T = 0 otherwise.
ISSN(Online): 2320-9801
ISSN (Print): 2320-9798
I
nternational
J
ournal of
I
nnovative
R
esearch in
C
omputer
and
C
ommunication
E
ngineering
(An ISO 3297: 2007 Certified Organization)
Vol. 4, Issue 1, January 2016
II. THRESHOLDING TECHNIQUES
A. Simple thresholding:
Threshold is one of the widely used methods for image segmentation. It is useful in discriminating foreground from the background [3]. By choosing an adequate threshold value T, the gray level image can be transform in to binary image. The binary image must contain required information about the position and shape of the objects of interest (foreground) [5]. The advantage of obtaining first a binary image is that it reduces the complexity of the data and simplifies the process of recognition and classification. The most usual way to convert a gray-level image to a binary image is to select a single threshold value (T). Then all the gray level values below this T will be classified as black (0), and those above T will be white (1). The segmentation problem becomes one of selecting the proper value for the threshold T.
B. Otsu thresholding:
Otsu is an automatic threshold selection region based segmentation method [1]. Another way of accomplishing similar results is to set the threshold so as to try to make each cluster as tight as possible, thus minimizing their overlap. Obviously, we can’t change the distributions, but we can adjust where we separate them (the threshold). As we adjust the threshold one way, we increase the spread of one and decrease the spread of the other.
Otsu method is of type global thresholding in which threshold value depends only on gray value of the image. Otsu method was proposed by Scholar Otsu in 1979. Otsu method is global thresholding selection method, which is widely used because it is simple and effective [3].
The Otsu method requires computing a gray level histogram before running. However, because of the one-dimensional which only consider the gray-level information, it does not give better segmentation result. Otsu’s method was one of the better threshold selection methods for general real world images with regard to uniformity and shape measures. But this method does not work well with non-uniform illumination.
C. Polynomial Curve Fitting:
We segment an image by fitting a polynomial curve to the histogram and finding point of infliction to determine the minima for thresholding [5]. Polynomial fitting based algorithm is very robust and efficient in comparison with the original ray casting algorithm based on gradient features [6].
Polynomial curve fitting require clear cut linear (or) parabolic relationship .If it is not clear from the scatter of data, one may draw free hand curve. This method has however, the disadvantage of biasedness and impossibility of making a valid estimate of residual variation about the curve [7].
III. PROPOSED TECHNIQUE
In simple and Otsu thresholding techniques, a threshold value is selected based on only the pixel intensities in the image. But, in images with non-uniform contrast distribution where considerable background noise or non-uniform illumination exists, the pixels that cannot be easily classified as foreground or background based on pixel intensities.
ISSN(Online): 2320-9801
ISSN (Print): 2320-9798
I
nternational
J
ournal of
I
nnovative
R
esearch in
C
omputer
and
C
ommunication
E
ngineering
(An ISO 3297: 2007 Certified Organization)
Vol. 4, Issue 1, January 2016
I. Proposed Algorithm:
The proposed approach for image segmentation is based on threshold, performing some steps over it.
1. Read the image.
2. Image is divided in to sub-blocks of size M x N
3. For each sub block, standard deviation is calculated to increase intensity of image object.
4. Global threshold is applied for each sub block which has standard deviation as greater than one.
5. The above process is repeated for each and every sub block of entire image.
II. Block processing approach for image thresholding
In distinct block processing, image matrix is divided into m-by-n sections. These sections, or distinct blocks, overlay the image matrix starting in the upper left corner, with no overlap. If the blocks do not fit exactly over the image, padding can be added to the image with partial blocks on the right or bottom edges of the image.
The block processing function extracts each distinct block from an image and passes it to a function which is specified for processing. The block processing function assembles the returned blocks to create an output image.
OBJECTIVE QUALITY MEASUREMENTS
The objective quality measurements are save time more than subjective quality measurement [8], [4]. The seven simple objective measurements are selected and used for this research study. Definition: x(i, j) denotes the samples of original
image, denotes the samples of compressed image. M and N are number of pixels in row and column
directions, respectively
1. Peak Signal to Noise Ratio (PSNR): The small value of Peak Signal to Noise Ratio (PSNR) means that image is
poor quality. PSNR is defined as follow:
The measurement unit for the PSNR is measured in dB. The higher the value of PSNR is, the more the similarity between the clustered image and original image .
2. Average Difference (AD): This measure shows the average difference between the pixel values and is defined as
follows
Ideally it should be zero.
3. Normalized Absolute Error (NAE): The large value of Normalized Absolute Error (NAE) means that image is
ISSN(Online): 2320-9801
ISSN (Print): 2320-9798
I
nternational
J
ournal of
I
nnovative
R
esearch in
C
omputer
and
C
ommunication
E
ngineering
(An ISO 3297: 2007 Certified Organization)
Vol. 4, Issue 1, January 2016
IV. EXPERIMENT AND RESULT
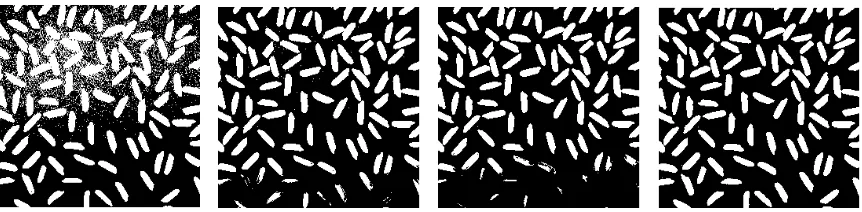
The proposed algorithm and some commonly used algorithms are implemented on the Rice and Grains images using MATLAB. To evaluate the performance of proposed method two images were chosen as test samples. We compare our method with other three methods, simple threshold, Otsu and poly curve fitting. The figure-1 shows results of our method and comparative methods for the rice sample.
Fig 1-(a) Original image
Fig 1-(b) Simple thresholding Fig 1-(c) Otsu method Fig1-(d) Poly curve fitting Fig 1-(e)Proposed technique
After applying simple thresholding technique still some noise is present in the image. In Otsu and poly curve fitting methods, rice grains which are in dark area were not segmented properly. But in our method all rice grains were segmented without any noise.
Table 1 Experimental result of Rice image
Source Image- Rice
Time PSNR NAE AD
Simple Thresholding
0.3573 56.86 0.996 110.87
ISSN(Online): 2320-9801
ISSN (Print): 2320-9798
I
nternational
J
ournal of
I
nnovative
R
esearch in
C
omputer
and
C
ommunication
E
ngineering
(An ISO 3297: 2007 Certified Organization)
Vol. 4, Issue 1, January 2016
Table 1 lists the corresponding time and objective quality measurements, PSNR, NAE and AD of the proposed and comparative methods for rice samples. The proposed method has taken less time compare to other three techniques. The proposed method has high PSNR, low NAE and AD.
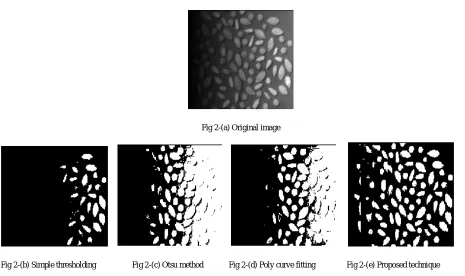
The figure-2 shows results of our method and comparative three methods, simple threshold, Otsu and poly curve fitting for the grain sample.
Fig 2-(a) Original image
Fig 2-(b) Simple thresholding Fig 2-(c) Otsu method Fig 2-(d) Poly curve fitting Fig 2-(e) Proposed technique
In simple threshold, Otsu and poly curve fitting methods, the grains on left side of the image which are in dark area were not segmented properly. But in our method all grains even in the dark area were also segmented effectively.
Table 2 Experimental result of Grains image
Source Image- Grains
Time PSNR NAE AD
Simple Thresholding
0.3524 58.966 0.998 71.98
Otsu method 0.3861 56.146 0.997 71.61
Polynomial curve fitting
0.3608 57.0647 0.995 71.69
Proposed Algorithm
ISSN(Online): 2320-9801
ISSN (Print): 2320-9798
I
nternational
J
ournal of
I
nnovative
R
esearch in
C
omputer
and
C
ommunication
E
ngineering
(An ISO 3297: 2007 Certified Organization)
Vol. 4, Issue 1, January 2016
Table (2) lists the corresponding time and objective quality measurements, PSNR, NAE and AD of the proposed and comparative methods for grains image.
V. CONCLUSION
In this paper, we present new method of thresholding for non-uniform illumination images. We used block processing approach for threshold based segmentation. The proposed technique is compared with other relevant methods and found to be better than other contemporary methods, both in terms of quality and speed. The above proposed approach is implemented on MATLAB programming language.
REFERENCES
1. Zhong Qu and Li Hang., “Research on Image Segmentation Based on the Improved Otsu Algorithm”, IEEE Conference on IHMSC, Vol.
2, pp. 228 – 231, 2010.
2. Kang, W. X., Yang, Q. Q., and Liang, R. R.,“The Comparative Research on Image Segmentation Algorithms”, IEEE Conference on ETCS, pp.703-707, 2009.
3. Rafael C. Gonzalez, Richard E. Woods, “Digital Image Processing”, 2nd Edition, Beijing: Publishing House of Electronics Industry, 2007.
4. Grgic, S., Grgic, M., and Mrak, M., “Reliability of Objective Picture Quality Measurement,” Journal of Electrical Engineering, Vol. 55, no. 1-2, pp. 3-10, 2004.
5. Jain, A., Fundamentals of Digital Image Processing, Prentice-Hall, p 408, 1986.
6. Chow, C. K., and Kaneko, T., “Automatic Boundary Detection of the Left Ventricle from Cineangiograms”, Comp. Biomed. Res.(5), pp.388-410, 1972.
7. Srivastava, R., Polynomial regression, I.A.S.R.I library Avenue New Delhi
8. Eskicioglu, M., and Fisher, P. S., “Image Quality Measures and Their Performance,” IEEE Transactions on Communications, Vol. 43, no. 12, pp. 2959-2965, 1995.
BIOGRAPHY
1. M. Chandrakala is Assistant Professor, Dept. of E.C.E, Mahatma Gandhi Institute of Technology, Affiliated
to JNT University, Hyderabad, Telangana, India. She completed Masters in Electronics and Communication in 2008 from Osmania University, Hyderabad, Telangana, India.
2. P. Durga Devi is Assistant Professor, Dept. of E.C.E, Mahatma Gandhi Institute of Technology, Affiliated to