University of South Carolina
Scholar Commons
Theses and Dissertations
1-1-2013
Energy Metrics for State Government Buildings
Trevor Michael
University of South Carolina
Follow this and additional works at:https://scholarcommons.sc.edu/etd
Part of theEarth Sciences Commons
This Open Access Thesis is brought to you by Scholar Commons. It has been accepted for inclusion in Theses and Dissertations by an authorized administrator of Scholar Commons. For more information, please [email protected].
Recommended Citation
Energy Metrics for State Government Buildings
by
Trevor Michael Bachelor of Arts
University of South Carolina,2001
Submitted in Partial Fulfillment of the Requirements
For the Degree of Masters in
Earth and Environmental Resource Management
College of Arts and Sciences
University of South Carolina
2013
Accepted by:
Mark Tompkins, Director of Thesis
Cary Mock, Reader
Andrew Berger-Gross, Reader
A
BSTRACTMeasuring true progress towards energy conservation goals requires the accurate
reporting and accounting of energy consumption. An accurate energy metrics framework
is also a critical element for verifiable Greenhouse Gas Inventories. Energy conservation
in government can reduce expenditures on energy costs leaving more funds available for
public services. In addition to monetary savings, conserving energy can help to promote
energy security, air quality, and a reduction of carbon footprint. With energy
consumption/GHG inventories recently produced at the Federal level, state and local
governments are beginning to also produce their own energy metrics systems.
In recent years, many states have passed laws and executive orders which require their
agencies to reduce energy consumption. In June 2008, SC state government established a
law to achieve a 20% energy usage reduction in state buildings by 2020. This study
examines case studies from other states who have established similar goals to uncover the
methods used to establish an energy metrics system. Direct energy consumption in state
government primarily comes from buildings and mobile sources. This study will focus
exclusively on measuring energy consumption in state buildings. The case studies reveal
that many states including SC are having issues gathering the data needed to accurately
measure energy consumption across all state buildings. Common problems found include
a lack of enforcement and incentives that encourage state agencies to participate in any
needed data. The various approaches at coercing participation will hopefully reveal
methods that SC can use to establish the accurate metrics system needed to measure
progress towards its 20% by 2020 energy reduction goal. Among the strongest incentives
found in the case studies is the potential for monetary savings through energy efficiency.
Framing energy conservation as budget enhancement is found to be a particularly useful
approach in political environments that are not always receptive to climate change
oriented efforts. For example, the NC Utility Savings Initiative claims to have saved over
$400 million in avoided tax costs. The case studies reveal a wide range of individual
successes as a result of energy conservation efforts. Despite the successes found, results
indicate that most states have not obtained or completely measured progress towards their
T
ABLE OFC
ONTENTSABSTRACT ... iii
LIST OF TABLES ... viii
LIST OF FIGURES ... ix
LIST OF ABBREVIATIONS ... xi
CHAPTER 1: INTRODUCTION………..1
CHAPTER 2: THE CASE STUDIES ...19
2.1MASSACHUSETTS ...19
2.2KENTUCKY ...22
2.3 MINNESOTA ...26
2.4 NEVADA ...31
2.5 NEW YORK ...34
2.6 NORTH CAROLINA ...39
2.7 OHIO ...41
2.8 SOUTH CAROLINA ...42
2.9 TEXAS ...44
2.10 WISCONSIN ...46
CHAPTER 3: ELEMENTS OF STATE GOVERNMENT METRICS SYSTEMS ...51
3.1 ESSENTIAL ELEMENTS ...51
3.2 MARGINAL ELEMENTS ...60
L
IST OFT
ABLESTable 1.1 Energy Efficiency/Conservation Laws and Executive Orders for State
Governments ...9
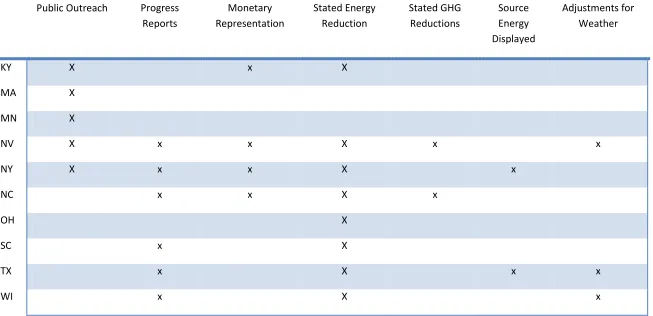
Table 3.1 Incentives Utilized ...55
Table 3.2 Executed Tracking Methods ...68
L
IST OFF
IGURESCHAPTER
1
I
NTRODUCTIONStates, Agencies and Local governments have found the need to track energy
consumption for reasons related to budget, energy security, air quality and carbon
footprint. The gathering of detailed information from energy usage can assist policy
makers in identifying potential savings. Energy information can also expose areas of
wasteful spending and empower users to make better choices for investments in building
infrastructure related to energy and monetary savings. Accurate energy metrics can then
be used as the primary input for Greenhouse Gas (GHG) inventories. These inventories
are essential to gauging the size of the U.S. government carbon footprint.
The passage of the Energy Independence and Security Act (EISA) in December
2007 contained provisions with GHG emissions reduction potential through Corporate
Average Fuel Economy (CAFÉ), Title V Energy Savings in Government, and Public
Institutions. EISA also included a reauthorization of State energy programs. About the
same time as the passage of the EISA, several state governments passed laws and
executive orders requiring energy usage reductions in their own buildings. President
Obama’s EO 13514 requires all federal government agencies to measure GHG emissions
and has resulted in the first comprehensive inventory of GHG emissions by federal
organizations (Executive Office of the President, 2011). EO 13514 establishes goals to
Standard GHG inventory protocol refers to scope 1 emissions as being direct
emissions from an organizations buildings and mobile sources. Direct emissions can
result from things such as an on-site natural gas boiler exhaust stack or tailpipe emissions
from an organization’s motor fleet. Scope 2 emissions generally refer to off-site
emissions created as a result of the energy an organization consumes. The most common
example of scope 2 emissions would be the electricity generated off site by a power plant
and then transferred to a building through the electrical grid. Although the consumption
of electricity within a building does not result in on-site emissions, the creation of that
electricity likely resulted in large part from coal fired emissions at a power plant. Scope
1, 2 and other forms of indirect emissions known as Scope 3 are used to create the
broader “carbon footprint” concept. A carbon footprint encompasses all emissions
resulting from an organization or and individuals activities. Examples of the broader
activities contributing to a carbon footprint include raw materials consumed by an
organization. Emissions as a result of raw materials consumption, such as office paper,
would normally be classified as Scope 3 emissions. Scope 3 emissions can also include
GHG emissions resulting from daily commutes of employees.
Some state and local governments are also developing their own energy metrics
and GHG tracking systems. Non-profit organizations such as the American Council for
an Energy Efficient Economy (ACEEE), and the Climate Registry are often found to be
closely involved with state and local energy tracking efforts. The Climate Registry (CR)
has initiated an effort to establish GHG Inventory standards for sub-federal government
entities in North America. To date, the database of carbon inventories available to the
entities at the state and local levels. However, no single state has been able to present a
cumulative GHG inventory for its entire state government. A quick review of
information available in the C.R.I.S. database reveals that these inventories are scattered
and incomplete. Among the state governments that have contributed GHG information to
the C.R.I.S.database, Massachusetts has made the most progress. Massachusetts’s
contributions to the Climate Registry, which includes several agencies and universities,
are featured in a separate database on the Climate Registry website. Although
Massachusetts represents the most complete source of GHG information for the CR’s
database, not all agencies and public universities are included. From a national
perspective, the participation of state and local governments in the CR is patchy and
incomplete. Gauging the size of the US sub-federal carbon footprint cannot be done with
this resource alone.
Estimating the complete energy consumption/carbon footprint of all government
agencies from the private sector is virtually impossible. Although a GHG inventory now
exists for the federal government, accurately measuring energy consumption for the
countless state agencies, universities, county and municipal departments at state and local
levels is difficult and few reliable resources exist. The Energy Information
Administration (EIA) as well the EPA US GHG Inventory Report group government
energy consumption and GHG estimates into the transportation and commercial sectors1.
Extracting the government contributions from these reports is impossible since the energy
and economic statistics that contribute to the EPA’s US GHG report are not designed to
treat the government sector as a separate economic entity. Government buildings, for
1 See the EPA’s report at http://www.epa.gov/climatechange/ghgemissions/usinventoryreport.html and the
example, are included with private sector buildings in the commercial sector of the
economy. The EPA’s inventory presents the carbon footprint of buildings for the
commercial sector as a whole. Estimates of building energy consumption for the
government sector are available through the EIA Commercial Building Consumption
Survey (CBECS) but this information has not been updated since 20032. Likewise GHG
emissions from government vehicles are grouped into the transportation sector which also
includes all mobile sources from the private sector.
Energy related information can be used to guide policy makers and the public.
Policy makers can learn more about their expenditures with the budget enhancement that
information related to energy consumption can offer. The amount and types of energy
consumed can allow policy makers to analyze which types of energy, such as electricity
or natural gas, would be more cost effective for buildings. Instead of energy costs being
a single budget item, energy can be divided into costs for computer hardware, building
heating cooling, transportation etc. These areas can then be targeted to identify savings
potential. Cost/benefit analysis can be performed for tradeoffs between fuel types such as
such as ethanol vs. unleaded gasoline. Where and how much energy is being consumed
can provide details for identifying where consumption is most and least cost effective in
buildings. Buildings which consume more energy per person or per square foot can be
identified. Decisions can then be made as to whether or not an organization should
continue to use a particular building or if retrofits can improve the building in a cost
efficient way. Energy consumption information can be combined with a life cycle
2
analysis of building heating and cooling equipment for further effective use of retrofitting
expenditures. The exposure of energy information to the public can also create incentive
for governments to become more efficient.
The concept of information providing incentives for organizations to reduce their
energy and material consumption has proven successful in other areas of environmental
policy. Khana et al. 1997 and Caplan et al. 2003 describe how the public disclosure of
information from the U.S. Toxic Release Inventory (TRI) provided incentives for private
firms to reduce their pollution. The TRI was the first legislatively mandated database in
the history of the U.S. government and represented the first time a U.S. law included a
requirement that information be made publicly available in a computer database (Jobe,
1999). In order to make this data available, the EPA had to design a system that could
store and distribute large amounts of data electronically in a manner that promoted easy
access and use. The simple exposure of toxic release information from companies to the
public is believed to be a direct cause of reduction in toxic releases from companies
(Jobe, 1999; Caplan 2003). The release of information to the public or possibly high
ranking government officials could have an effect on how people working in state
agencies behave. State agencies who don’t want to appear wasteful could begin changing
behavior to conserve energy. This concept of exposed wastefulness through the public
release of information appeared as a result of the TRI. Khanna et al. 1997 described how
investors perceived companies generating more waste as being inefficient. The TRI has
also been used by researchers to rank the environmental management policies of states.
(Jobe, 1999) Excess GHG emissions from an organization could also be seen as wasteful
in any organization will have to result in Carbon Dioxide (CO2) emissions, an inevitable
by-product of combustion. CO2 is by far the most common GHG created during the
burning of fossil fuels. Other GHGs such as Nitrogen Dioxide (NO2) also result from the
burning of fossil fuels. These gases are more potent than CO2 but the quantity of new
CO2 released into the atmosphere since before the industrial revolution is the most
significant. Atmospheric concentrations of CO2 since the beginning of the industrial
revolution have increased from approximately 280 parts per million (ppm) to 400 ppm.3
The cost of an organization’s energy budget could be seen as a factor in its overall
operational efficiency. Like the TRI, scope 3 emissions from an organization’s GHG
inventory could be used to analyze operational efficiency of material consumption from
computer equipment purchases to consumption rates of office paper. A GHG inventory
can offer budget enhancement in terms of detailed consumption rates for energy and
materials while also providing details of an organizations environmental impact.
Energy expenditures are often reviewed on a monthly or quarterly basis with a
“snapshot” analysis that does not show continuous trends in cost and consumption.
Studies of consumer decision making when buying automobiles have revealed that
buyers are often unable to calculate the long term cost savings of cars with higher fuel
efficiency. This lack of knowledge can lead to irrational decisions. This irrational
decision making process is further complicated when considering the other numerous
variables involved in the car buying process. It has also been implied that the limited fuel
use instrumentation available on most automobiles leads to less attention to fuel
economy. (Kurani, 2004) Information such as converting miles per gallon into cost per
3 CO2now.org is one of the most accessible references for tracking the rise of CO2 concetrations in the
mile should lead to better awareness of operating costs for automobiles. (Goldberg, 1998)
Other studies have also pointed to the consumer misperception of energy efficiency
benefits because of a lack of information. This lack of information can even lead to
over-expectations of the savings associated with a more fuel efficient automobile. (Parry,
2010) As with automobiles, detailed knowledge of energy consumption and expenditures
provides the basic building blocks necessary to make calculated decisions for budget and
GHG savings. Continuously providing information such as cost per gallon could help the
consumer to understand the trends of monetary expenditures for fuel and lead to more
rational decision making.
An energy management and benchmarking tool created by the EPA known as
Energy Star Portfolio Manager (ESPM) may have the potential to function as a database
of information similar to the TRI. This web based tool already contains energy
consumption information for many government buildings. The case studies found in this
paper will show that several states, such as New York, have utilized ESPM as their
primary energy tracking and benchmarking tool. High ranking government officials and
the public may find a complete energy usage database useful for assessing the operational
efficiency of agencies and public universities. Requiring users to report information
consistently empowers them to make better choices. The Climate Registry represents one
way in which a tracking and reporting standard has been established for metrics related to
energy use through verifiable GHG inventories. Energy benchmarking, such as the
scores available through ESPM, can present indicators of financial as well as
environmental performance in government. Energy consumption and expenditures can
provision from year to year of the TRI has allowed investors to track changes in the
environmental performance of firms. (Khanna, 1997). Likewise an energy metrics
system in government can allow policy makers to track the changes and improvements in
money saving energy efficiency efforts.
Stolaroff et al. 2009 suggests that GHG inventories for private sector industries
should include a system for identifying corporate ownership of reporting facilities.
Identifying the corporate ownership or “brand” from which these emissions originate
would likely have an influence on consumers. This effect on consumers is based on the
assumption that consumers would begin to associate a brand with higher or lower GHG
emissions. Just as the TRI influenced the decision making process of investors,
consumers may begin to choose brands that they perceive as more “environmentally”
because that product has a lower carbon footprint. This concept could have a similar
effect on the mind of voters if the carbon footprint of government entities is known.
Stolaroff also comments on the value of “Scope 2” (indirect emissions from purchased
electricity) vs the more direct “Scope 1” emissions that may be generated on site through
equipment such as a natural gas boiler. Scope 2 emissions for government buildings is
likely to be the largest contributor to the overall carbon footprint. Tracking the cost of
energy consumption in buildings would make the information necessary for calculating
Scope 2 emissions readily available. Once this information is available, simple
algorithms can be used to calculate GHG emissions.
The examples listed in this introduction introduce concepts of transparency and
budget/ trend analysis that can be applied to energy databases. If all government
Carbon Registry, a consistent source of information could develop. Policy makers and
the public could use this information to assess the operational efficiency of their
government agencies. The benchmarking information available from such databases
could assist policy makers in managing the energy consumption that is measured. Better
management of energy consumption will lead to budget and emissions savings.
This study examines case studies from state governments that have established
energy conservation/efficiency goals or measurement systems to identify the methods
used to establish useful sources for energy metrics systems. Energy consumption in state
government involves two primary types: buildings and mobile sources. Table 1 lists
states which have issued laws or executive orders outlining energy conservation goals for
public buildings and the deadlines for meeting them4.
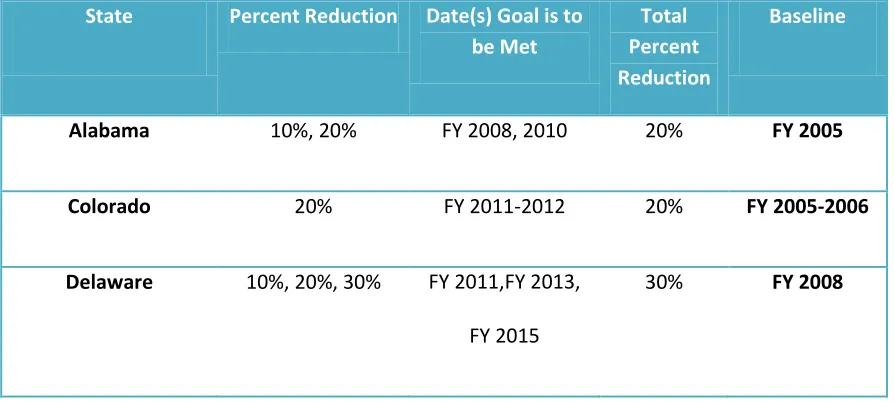
Table 1.1Energy Efficiency/Conservation Laws and Executive Orders for State Governments
State Percent Reduction Date(s) Goal is to be Met
Total Percent Reduction
Baseline
Alabama 10%, 20% FY 2008, 2010 20% FY 2005
Colorado 20% FY 2011-2012 20% FY 2005-2006
Delaware 10%, 20%, 30% FY 2011,FY 2013,
FY 2015
30% FY 2008
4 Minnesota has not established a goal date but has been included in the following list because of its
Florida GHG reductions of
10%, 25%, 40%
2012, 2017, 2025 40% 2007
Georgia 15% 2020 15% 2007
Illinois 10% 2018 10% 2007
Iowa 15% 2015 15% 2008
Kentucky 10% Annual Energy
Cost
Maryland 5%, 10% 2009, 2010 10% 2000
Massachusetts 20%, 35% 2012, 2020 35% 2004
Michigan 25% 2015 25% FY 2001-2002
Minnesota 20% none set
Missouri 2% Annually for the
next 10 years starting in 2009
20%
Nevada 20% 2015 20%
New York 35% 2010 35% 1990
North Carolina 20%, 30% 2010, 2015 30% FY 2003-2004
Ohio 5%, 15% 2008, 2011 15% FY 2007
Texas 5% Each year for 6 years beginning in
2010
30%
Washington 10% September 2009 10% FY 2003
Wisconsin 10%, 20% 2008, 2010 20% FY 2005
This table was compiled using a combination of the DSIRE and ACEEE databases. All states found in these two databases with either an Executive Order or Law for energy reductions are listed. Similar energy policies with energy reduction goals originating from areas other than the executive and legislative branches may exist in other states.
All of the laws and executive orders passed in Table 1.1 include energy
conservation/efficiency goals in public buildings expressed as a percentage reduction.
The study will focus on the common trend of measuring energy consumption and energy
efficiency goals in state buildings. The reader should be aware that language within the
various legislative actions and executive orders for meeting the goals in table 1 can vary
from state to state. For example, Alabama (AL) state government set a goal of 10%
energy reduction in all “conditioned”, state owned facilities by Fiscal Year (FY) 2008
and a 20% reduction in the same manner by FY 2010.5 Other states such as Ohio (OH)
specify their goals for buildings owned or leased.6 Such language can have a heavy
influence on where and how energy usage must be tracked across state government
systems. Many states which pass their laws as part of an executive order choose to
impose their energy conservation efforts only on agencies which are part of the
“executive branch” or those agencies in which the governor has direct authority7
. Other
5
AL Executive Order 33
6 OH House Bill 251 and Executive Order 2007-02S
differences include the incorporation of water conservation efforts8. Also, some states
such as Massachusetts and North Carolina designate total energy reduction goals from all
fuel and electricity usage as BTU’s per square foot. Others states such as Michigan and
Nevada specify only purchased, grid-based electricity. The following case studies will
reveal different approaches among the various states studied. The overall attitude in a
state government towards energy efficiency can influence whether the deadline
requirements are truly treated as goals or if they are merely aspirations.
The following case studies will feature energy conservation, emissions and budget
savings. Throughout the studies a relationship between energy consumption at buildings
and emissions reductions at the energy generating source is apparent. One of the goals is
to explore the cost saving oriented motivations of energy efficiency measures and their
relationship to the often separate but co-dependent goal of of GHG mitigation. In the
U.S., 1 kilowatt hour of electricity equals approximately 1.3 pounds of CO2 emissions.
(DOE, 2000) A reduction in carbon footprint for building(s) will almost always lead to
less power consumed leading to lower costs for energy for the building(s). Verifiable
GHG inventories usually require various types of energy consumption such as natural gas
and electricity to be accounted for separately, since the ultimate emissions from these
different energy sources are create varying amounts of GHG emissions. Energy budgets
can also separate different sources of energy to analyze cost effectiveness. Some studies
such as Massachusetts show that climate and energy goals can be integrated. Other cases
such as North Carolina will have a more budget oriented focus. The Texas example will
show the air quality benefits of energy efficiency/conservation. The research conducted
in this study will reveal that reducing cost can be a major motivator for the
implementation of energy efficiency/conservation measures in the public sector. In
addition to budget savings energy metrics is also a critical element for verifiable
Greenhouse Gas Inventories (GHG). These same inventories are almost always
accompanied by goals for reduction of carbon footprint. GHG reduction efforts can often
directly translate into reductions in energy related costs.
This study will reveal that regional trends in energy tracking and consumption
reductions are similar to regional trends in environmental policy engagement. With
states managing over 90 percent of environmental programs, the federal government also
has interest in how transfer dollars are spent. (Rabe, 2010) Funding from EISA and the
more recent American Reinvestment and Recovery Act (ARRA) has had a direct impact
on state energy agencies. ARRA funds have particularly left a direct mark on many of
the programs found in this study. Organizations such as the National Association of State
Energy Officials (NASEO) and the Climate Registry offer sizeable networks of
professionals interested in policy innovation related to energy and emissions
management. The creation of task forces and committees is a common theme throughout
the case studies. This creates new opportunities for policy innovation in state
government. Many of the innovations found in this study are shown in the form of
incentives that state energy offices use to collect the data needed for energy usage
analysis. While some states have taken a leadership role in energy management, others
have sought an economic advantage by imposing as few environmental policies as
possible. Almost none of the southeastern states featured in this study have any form of
any type of leadership role in innovation with its technological approach to managing its
energy consumption. Other regional issues that emerge are related to the quality of data.
“Many efforts to rank states according to their environmental regulatory rigor,
institutional capacity, or general innovativeness find the same subset of states at the top
of the list year after year”. (Rabe, 2010) This study will show that states such as
Massachusetts and New York, who often find themselves near the top of environmental
policy rankings, are also showing leadership in their self-imposed energy management
programs. Innovation is also found in states such as Texas who is consistently be ranked
in the middle in terms of environmental policy engagement. This study will show that
some states have focused on the GHG reduction potential of self-imposed public building
policies. GHG and related emissions management can force programs to focus on
conserving energy rather than becoming more energy efficient. Fewer emissions from an
organization can only result from a reduction in overall energy consumption. In contrast,
a focus on energy efficiency in per square foot or per person terms may not result in less
overall energy and emissions if on organization grows in size. A focus on emissions is
generally more oriented towards actual reductions in total emissions rather than on a per
square foot or per person basis.
The states chosen for case studies were the ones that generally had the most information
readily available for research. Many states not chosen had no mention of their internal
energy conservation programs on their websites. A visual representation using this
research approach can be seen in the map that follows. All states listed in Table 1 are
outlined. States represented in the case studies are shaded according to the amount of
State Government Energy Reductions
Some of the policies found specify state agencies while others will specify state-owned
buildings. Policies that specify state agencies could imply that property not owned by
state government would be included in the energy reduction goals and thus the state’s
energy metrics system. Issues regarding tracking energy in leased property will be
discussed throughout the following sections of this study. Many state agencies operate in
buildings shared with local government and private sector entities. These buildings can
be owned by the state, local government or a private entity. Such buildings will often
have one meter for the entire building for which the owner of the building pays the
utilities. Separating the energy consumption of the various tenants within these buildings
is difficult without the added cost of sub-metering. Many of the laws and executive
orders found in table 1 use the term “Energy Conservation” although the actual base
metric for measuring progress in in some form of Energy Usage Index (EUI). EUI is
often represented as energy usage per square foot. Energy from electricity and natural
gas are converted to BTU’s and then commonly expressed as kBTU/s.f. State laws and
executive orders entitled as “Energy Conservation” often do not represent conservation in
its truest sense. Policies will often state that energy per square foot is to be reduced
rather than a total energy reduction. The number of buildings in a state government could
increase to the point that more energy is consumed despite the fact that energy on a
per-building basis has decreased. Thus a government system could become more efficient in
its use of energy without conserving energy by reducing its overall energy consumption.
Whether or not a policy originated as an executive order can have implications to the
direct involvement of a state’s governor which in turn can have implications for the
follow. Some of the states in Table 2 have created multiple policies of different origins
for their energy goals. The third column of table 2 is designed to focus on the original
policy that was passed. Table 2 is designed to display some of the common themes and
differences in the way the policies were originally written.
Energy efficiency in government can help to reduce the tax dollars spent on
energy bills leaving more resources available for services to the public. (ACEEE, 2010)
The KY and NC examples found later in this study will show how strongly some states
have correlated their efforts with monetary savings. In addition to monetary savings,
conserving energy can help to promote energy security, air quality, and reducing carbon
footprint. Energy efficiency/conservation in state governments is primarily focused on
two areas, mobile fleet management and commercial buildings. This study will feature
energy metrics across state-owned and leased commercial buildings although many of the
incentive and leverage concepts presented in this study could also be applied to the
tracking of mobile fleet fuel consumption.
A state government-wide energy metrics system across a large, diverse group of
commercial buildings can provide the data necessary to compare and contrast energy
usage from multiple buildings together at one time. This effort can help to identify
“energy hogs”, allowing retrofitting resources to be targeted for maximization of their
value. The main elements of any effective energy tracking system are benchmarking,
analyzing and management of energy expenditures both in terms of utility billing and
efficiency investments. (Guess G., 2009) Utility billing can be audited to determine if
utilities have applied inappropriate rates to government buildings. If buildings have been
This represents another way that energy metrics can be used to save money. Utility
billing audits can be integrated with energy efficiency since both efforts use the same
information. The Kentucky and Nevada examples found in this study will show how this
integration can be done. Once the reporting and metrics system is established, buildings
can be benchmarked for optimal performance. Once the benchmark is established for a
particular building, that baseline can be set against the actual operating parameters to
measure energy and money saving potential.
Creating a consistent and accurate reporting system in which all subject state
agencies, public schools districts, public universities, etc. are willing to actively
participate is the first step to establishing a useful energy metrics system. None of the
energy offices found in these case studies feature the use of direct enforcement to
encourage reporting cooperation. The case studies will show that states use a variety of
incentives for reporting purposes. A major goal of this study is to identify these
CHAPTER 2
T
HEC
ASES
TUDIESMassachusetts
The state of Massachusetts (MA) has been designated as the first case study because its
GHG inventories are featured prominently on the CR website. Much of MA state
government energy policy creates a model example from which other states can learn. In
2007 the Governor of MA issued Executive Order 484 creating the Leading by Example
program. This program integrates GHG reductions and renewable energy targets with
energy conservation goals. State-wide GHG reduction targets were set in line with the
IPCC goal of 80% GHG reductions worldwide by 2050. (IPCC 2010)
The integration of different sustainability goals for MA is displayed below:
Renewable Sources Energy Reductions GHG Reductions Goal Date (FY)
15% 20% 25% 2012
30% 35% 40% 2020
GHG inventories for numerous institutions in MA government have been compiled and
uploaded to the CR C.R.I.S. database. The MA portion of the C.R.I.S. database only
includes the organizations which the MA executive office feels it has good data and does
not include all of MA state government.9 Much of the energy usage data readily available
for MA state government is represented as a GHG inventory. An FY 2007 GHG
inventory for MA state government, totaling 1.2 MMT of carbon dioxide equivalents
(CO2e), revealed that buildings were responsible for 90% of GHG emissions in MA state
government. The remaining 10% resulted largely from transportation related activities. 10
The fact that 90% of GHG emissions came from buildings in the MA example highlights
the strong link between commercial building energy conservation and GHG reductions.
To date, MA has not completely quantified its overall 2005 baseline or its current
total energy use. The Executive Office has experimented with using cost to estimate past
power usages by calculating average cost per kWh year in order to establish the 2005
energy usage baseline at each facility. With regards to current energy consumption, MA
is attempting to account for all leased buildings as well as those that are state-owned. It
is however unlikely that every building, in particular smaller ones, will be accounted for.
Most information that the MA Executive Office has available is coming from owned
buildings rather than leased. Leased buildings in MA state government are often shared
with other public and private entities creating issues with responsibility for paying power
bills. Shared building situations make it can be difficult to separate power consumption
between the different entities if only one power meter exists for an entire building.
9 MA data is represented separately from other states and territories data in the C.R.I.S. database. See
https://www.crisreport.org for more details 10
The program director of the MA Leading by Example feels that overall
accounting will be close to 90% of the 60 million square feet of commercial building
space that houses the 161 agencies comprising MA state government. Currently, the
hope is that totals will be quantified by the end of FY 2012 coinciding with the first
energy reduction goal date. The director does not feel that the 20% energy reduction by
FY 2012 goal will be met11.
In terms of implementing a measurable reporting standards program across MA
state government, the Leading by Example website includes outreach information such as
brochures, a reporting form, and workshops for state agencies. Instructions on how
agencies can submit grant applications for energy efficiency projects and other various
outreach such as “Office Green Easy-Tips” is also included.
Roughly 2/3’s of MA’s agencies are reporting in a handful of different ways,
depending on what is practicable. Some agencies fill the form available on the MA
executive office website while others are sending utility bills directly to the Executive
Office. Although the MA Executive Office has no enforcement mechanisms to
encourage agencies to report their energy usage accurately, it has found that “peer
support” (or what may be better described as “peer pressure”) has been the main angle
they can use to get agencies to comply with reporting obligations.12 This peer support
approach mostly consists of notifying non-reporting agencies of all the ones that have
complied. Similar to what was found in the KY example, the MA Executive Office
hopes to be able to take advantage of obtaining energy usage data directly from utilities.
11 Interview with Eric Friedman, Director of the MA Leading by Example Program 3/30/12
MA has also taken advantage of their public university systems to help achieve
energy conservation goals. The MA approach includes acknowledgement of the
American College and University President’s Climate Commitment (ACUPCC) which
also recognizes the 80% GHG reduction by 2050 goal set forth by the IPCC. Signatories
to this commitment are required to establish a GHG inventory and establish and submit
an action plan for becoming climate neutral “as soon as possible”13
. Current results of
this commitment include over 1500 GHG Inventories submitted over multiple years and
450 action plans. The ACUPCC reporting system provides a useful resource that
contains more readily useable information in a more efficient manner than the CR’s
C.R.I.S. database. In all case studies represented in this paper, public universities seem to
be the most consistently reliable state government entity for tracking and reporting
energy usage. As can be seen in the WI example, public universities can also represent a
huge portion of the overall energy consumption for state government.
Kentucky
Kentucky (KY) has been chosen as one of the first featured case studies because of its
innovative approaches to energy management. KY Executive Order 2005-122
established a 10% energy cost reduction goal in state facilities. As part of KY’s effort to
attain this goal, a $3.65 million ARRA grant was used to create the Commonwealth
Energy Management and Control System (CEMCS). The pilot phase of this centralized
13
system currently tracks energy usage in 23 public campuses for a total of 43 buildings
across the state of Kentucky. The CEMCS “dashboard” website provides live
information on energy and monetary savings to the public. The dashboard website claims
to have saved approximately $1.2 million in energy expenditures compared to 2009
baseline usage and to have saved a total of 12.5% in energy usage. Like many of the
examples found later in this study, the energy reduction total includes only a select group
of buildings and is not representative of all buildings in KY state government. According
to grants written for the CEMCS, some buildings in its system are saving as much as 50%
in energy costs. (Guess, 2010)
The four components of the CEMCS system are utility monitoring and analysis,
building automation integration and diagnostics, centralized automated utility bill
payment, and work order generation and tracking. Essential metrics to accomplish
CEMCS tasks are utility account numbers, meter number, vital building stats, occupancy
numbers, schedules, equipment lists and any unique energy usage types. (Guess, 2010)
The KY CEMCS is a ground breaking technological approach that could potentially
provide other state and local governments with a model example of how energy can be
managed and tracked. As the CEMCS leaves its pilot phase, the goal will be to integrate
400 more buildings in the next 2 years and ultimately integrate all 1759 state owned
buildings across KY state government. All buildings in the system are state owned but
some have local government entities sharing space with government agencies.
Like several of the other case studies, the KY CEMCS system has found some
success in tracking energy data directly from utilities. The CEMCS then takes this
bills can be paid automatically to utility companies through a data exchange between
utility records and the CEMCS system. The synchronization of the CEMCS system
between state buildings and power companies can help agencies to avoid late fees and
unfavorable billing rates. One of the major hurdles in compiling billing invoices from
various agencies into a single source is accommodating the many different types of
operational software that various state agencies are using. The CEMCS uses a program
known as “Energy Witness” to transfer data from the different operational software types
that various agencies in KY are using. (Guess, 2009) Software known as EDI allows data
exchange between the CEMCS and utilities for billing purposes. Another software entity
known as eMARS is used to pay utility bills. The automatic usage and billing data
exchange between KY state agencies and power companies has consisted of only the
larger utility companies to date. No electric cooperatives have participated in the
automated exchange. As found in several of the following case studies issues can arise
when state government systems are dealing with a variety of utility types such as electric
cooperatives and municipal sources. Also, some of the fuel usage data that the KY
CEMCS system collects such as natural gas cannot be exchanged automatically. The
non-automated data can be gathered from energy bills if necessary but this creates some
lag in the continuous monitoring process. A property management database known as
Archibusis also housed by the CEMCS. Archibus provides building info such as
location, use and square footage. Included in total square footage calculations are
parking garages; parking lots are not counted.
One of the key elements of any energy tracking system that the CEMCS provides
benchmarks for energy usage norms normalized for weather and efficiency goals are
customized for each building. CEMCS allows the monitoring of building energy usage
compared to its benchmarks to be observed continuously in real time. If a building is
operating outside of its normal operating parameters the CEMCS will automatically
generate e-mail and text alerts to on-site and CEMCS personnel. Building maintenance
and repairs as a result of these alerts are tracked through software known as FMWorks.
Where feasible, the CEMCS system has the capability to control energy
consuming equipment such as boilers, lights and chillers remotely from its central
location. Although the CEMCS has no formal enforcement in terms of penalties for
non-compliant agencies, it does possess properties similar to enforcement in the form of
remote capabilities. The CEMCS is also capable of tracking energy usage of individual
equipment through the use of sub meters and “smart meters”. In some cases, utilities in
KY have installed a single power meter for a campus or group of buildings. As a result,
total building usage is sometimes tracked as a group rather than energy usage at each
individual building. This is the reason for the discrepancy between the number of
“campuses” monitored (23) vs. the number of buildings monitored (43) mentioned in the
first paragraph of this case study.
The essential output metric of cost savings is also displayed by the CEMCS
continuously in real time. The CEMCS dashboard website features these cost savings
prominently. Displaying cost savings through the dashboard website is a huge selling
point to the public and state agencies outside of the CEMCS system. Budget strained
agencies will naturally be attracted to this system because of the money savings results
this system inside and outside the state of Kentucky. (Guess, 2009) Each agency within
the KY state government system typically pays its own utility bills creating a natural
incentive for saving on energy costs. KY differs from many states in this aspect. Other
examples found in this study will show that state agencies often used leased space and do
not pay utility bill directly. These leasing situations can create incentive issues among
the occupant agencies to implement energy related, cost-saving measures.
Despite only having 43 buildings in its system to date (approximately 2 million
square ft and 7000 occupants), the $1.3 million in energy savings from this system are
significant and show promise for justifying the 3.65 million in ARRA grant
expenditures14. The software in the KY example shows us that cost saving can be
generated not only through energy conservation but also through monitoring of billing
rates to assure that the most favorable rates is secured for each facility. The benefits of
auditing bills can be integrated into energy tracking and reporting efforts to generate
instant revenue. For example, the KY CEMCS dedicated two staff members to audit
power bills in state buildings for one week. This effort produced over $200k in recovered
energy bill expenditures15.
Minnesota
Minnesota’s (MN) Executive Order 11-12 established a goal of energy reduction in state
facilities by 20%. The goal established for MN does not set a date for the 20% goal to be
14 Continuous statistics are available on the Commonwealth Energy Management and Control System
met nor does it establish a baseline year as found in the other case studies. MN’s energy
conservation effort with public buildings is actually a series of laws and executive orders
dating back to 2001. Through legislative acts in 2001 and 2002, MN laid the groundwork
for the creation of its Benchmarking and Beyond or “B3” database. In 2004, this
database began collecting data for MN public buildings. As of January 4, 2008, the B3
database was tracking over 4,000 state and local government buildings. (ACEEE, 2008)
The MN Department of Administration and the Department of Commerce were
required to maintain information on all public buildings, local as well as state, leading to
the creation of the B3 database. The B3 database was specifically designed to guide
resource allocation for building retrofits and other conservation measures. The B3
system includes parametric models based on the MN energy code. This means that
baseline or ideal operating parameters for each building in the system are designed with
the assumption that the buildings are built to current MN state code specifications. The
B3 models were also developed with DOE2 models to match public energy stock in MN.
(ACEEE, 2008) This allows the B3 database to base its benchmarks off of utility energy
services specific to MN. It also allows the models to be based on climate information
specific to the different regions in MN.
During the early phases of designing and implementing the B3 system, designers
set out to compile a list of public buildings and identify “stakeholders”. These
stakeholders were defined as a person for each building who can supply building
consumption data such as a building manager, an owner or possibly even someone who
works for the utilities. An important lesson learned from the implementation stages of
be acquired and the willingness of participants to invest the time to supply the data”.
(ACEEE, 2008) This is an issue for any reporting system that lacks enforcement, as can
be found in all case studies. The initial information gathered for the B3 system was very
basic and short to help encourage cooperation. The system gathered this “Tier 1”
information in the form of space usage types, building area and hours of operation.
Buildings that were identified as candidates for having the most potential for energy
savings were then investigated further for more specific information such as special uses
and history of retrofits. (ACEEE, 2008) Another related feature of the B3 system is that
it will query the user for this same Tier 2 information. The Tier 2 information gathered
can then be used in a fashion similar to the Life-Cycle Analysis concept found in the KY
example.
Pilot tests for the design of the B3 system were performed using three different
reporting options, paper, e-mail and web based. These tests revealed that a web-based
reporting approach was ideal for providing immediate feedback. Users could get this
instant feedback in graph form on energy usage trends and expenditure trends as they are
entering information into the system. This provided an instant gratification appeal that
appealed to users and attracted them to continue using the B3 system.
Because the B3 database was created and in use before the onset of ARRA funds,
the MN example provides us with the opportunity to observe the benefits of a
benchmarking and tracking system when a stimulus of funds dedicated to energy
conservation measures is received. The Public Buildings Energy Efficiency
Enhancement Program (PBEEEP) was funded primarily with ARRA funds totaling $4
Center for Energy and the Environment (CEE) which also provides the MN case study
with an opportunity to observe the relationship between non-profit organizations and
government in energy conservation efforts. This non-profit relationship is a unique
aspect of the MN example that is not found in the other case studies.
The PBEEEP program used B3 data to identify building commissioning
potential. PBEEEP funds were separated into two parts, one for local government
buildings and one for state buildings, the latter being the main focus of this thesis.
PBEEEP commissioning was able to use the B3 database to identify 2,986 state buildings
comprising 74.9 million S.F. prior to the screening phase. These buildings had a mean
EUI (kBtu/s.f.) of 67. (ACEEE, 2012) The B3 system excludes any building that is less
the 5,000 S.F. An important observation made by PBEEEP was the focus on a holistic
commissioning approach vs. the widely used auditing approach that is more snap-shot
oriented. (ACEEE, 2012) A long-standing energy metrics system with many years of
data can provide the information necessary to observe energy consumption trends rather
than snapshots of buildings over a short period of time. The benefit of being able to
identify these trends was displayed during the four phases of the PBEEEP building
commissioning process.
Steps identified for the PBEEEP commissioning approach were Screening,
Investigation, Implementation, Measurement and Verification. The B3 system includes
filters that can help decision makers identify the buildings with useable information for
screening purposes. For example, these filters can be set to only include buildings with at
Not only could B3 data be used in the screening phase to identify building size,
age, condition, ect. but the PBEEEB initiative also shows us the potential of how a
metrics system can be used during the verification phase of a commissioning project.
Energy conservation funds, such as provided by ARRA, are often earmarked to be used
within a certain period of time with specific payback period expectations. In the case of
the PBEEEP, a payback period restriction of 3 years was in place due to ARRA funding.
Because the B3 system has been tracking the buildings commissioned before and after
the implementation of energy efficiency measures, those pay back periods can be
monitored for verification.
Results of the PBEEEP retrofits to date have shown that there was no correlation
between actual savings in participating buildings and the various benchmark ratios
calculated for buildings in the program16. All participating buildings regardless of
benchmark score have shown to be good candidates for retrofits. Administrators of the
PBEEP program believe that a combination of factors which comprise the single
benchmark number could be causing this lack of correlation. Administrators also believe
that using various inputs to create a single benchmark number does not help to reveal
much about the potential savings for a building and that the necessarily low cost and
easy-to-use nature of the B3 system causes its model to be somewhat rigid. Therefore the
benchmark number driven by this model “should be considered a +/- 10% estimate, rather
than something more precise”17. The MN PBEEEP example displays the tradeoff
between an easy to use reporting system that encourages participation and the usefulness
of benchmarks created from such a system.
16 Direct communication with Chris Plum of the PBEEP staff 10/15/12
The commissioning approach found in the MN example can provide guidelines
for retrofitting efforts in other state governments. The metrics system will have to be
able to calculate payback periods for any retrofits. Payback periods should also be
adjustable to accommodate the pressures placed on any funding received for the
implementation of energy efficiency measures. An example of such an adjustment can be
found in MN where projects using ARRA funds had to be designed with a payback
period of no more than three years. The original aim of the B3 system was to design
projects with a payback period of as much as 15 years. (ACEEE, 2008)
Nevada
In 2005 Nevada (NV) Revised Statute 701.215 was issued requiring state agencies to
reduce their grid-based electricity consumption 20% by 2015 from the 2005 total
consumption amount. The 2011-12 State of Nevada Status of Energy Report states that
NV reduced energy consumption in state buildings by 6.3% from 2005 to 2011. This
number is set against the 2005 baseline and is based on per square foot consumption.
The EUI was reduced from 16.24 kWh/s.f. in 2005 to 15.22 kWh/s.f. in 2011. These
numbers come from grid-based, electricity usage only and do not include other forms of
site energy consumption such as natural gas. The NV State Energy Office and the NV
State Public Works Division believe that another 1% reduction can be accomplished from
remaining ARRA retrofit funds. (NV State Energy Office, 2012) According to NV State
Energy Office Personnel, approximately 2800 state buildings are being tracked. Since
The 6.3% energy reduction is believed to have been accomplished largely from lighting
projects in which incandescent bulbs have been changed in favor of more energy efficient
types such as CFL’s. Public schools are not currently included in this tracking program.
NV has one unique advantage not shared by most other states in that 95% of its
buildings are supplied electricity by one power company, NV Energy. This has allowed
the NV State Energy Office to easily gather its electricity consumption from this single
utility. Each month NV Energy sends the State Energy Office a spreadsheet showing the
electricity consumption from each meter that monitors state buildings. There are
situations where multiple buildings will feed into one meter so the consumption data is
not always specific to a single building. Similar to the KY example, efforts to recover
money due to energy billing errors have been made. To date $8,744 has been recovered
from this effort for NV state government.
The NV State Public Works Division (SPWD) manages building maintenance for
state properties. The NV SPWD and NV SEO have successfully shown an ability to
create a partnership for the benchmarking and implementation of retrofits in NV public
buildings. As explained in the NV State Buildings Benchmarking Report, the SPWD was
responsible for identifying retrofit projects with simple payback calculations designed
with a goal of 10 MBTUs per $1000 spent. Verifying savings from ARRA funds is a key
focus of the NV State Buildings Benchmarking Report as the buildings monitored in this
study are the same buildings which received ARRA funded retrofitting projects. Such a
system can first be used for identifying buildings which could benefit the most from
energy efficiency investments. After those investments are made and executed, the
pointed out in the KY example, a significant portion of ARRA funds have been allocated
for state building energy efficiency efforts. $7 million of ARRA grant funds were
allocated for energy efficiency efforts in NV state buildings. NV chose to allocate their
funds largely for lighting replacement and lighting controls projects. Funds were also
allocated towards window, HVAC and solar projects.
The NV State Buildings report includes Energy Star Portfolio Manager (ESPM)
for benchmarking NV buildings. ESPM is a free tool designed by the EPA for use in
commercial buildings. This tool allows a building owner to evaluate the energy
efficiency of his/her building on a scale of 1-100 as compared to average performance of
commercial buildings across the U.S. The use of ESPM is a theme that will be found
later in other case studies. If states are struggling to find the necessary resources to
establish its own reporting and benchmarking system, ESPM offers a low cost and
serviceable alternative. The NV State Buildings report also benchmarks NV state
government facilities against other buildings with similar climate characteristics using a
database compiled by the outside consulting firm. Comparing buildings in the same
region allows for consideration of how buildings perform within a particular climate.
The NV report also includes GHG calculations for the buildings studied. The
calculations used in this report acknowledge the guidelines of the Climate Registry,
showing once again the potential that the CR organization has for compiling a complete
GHG inventory for U.S. sub-federal government. GHG emissions are not presented as
prominently as the main energy consumption and monetary figures. However, using
tracking effort. The NV benchmarking report highlights the simple additional step
taken to include carbon footprint once building energy is accurately tracked.
New York
New York (NY) Executive Order No. 111 established a goal for energy reduction in state
government buildings of 35% relative to 1990 baseline levels. The 1990 baseline and
35% reduction by 2010 goal is considerably more aggressive compared to the other states
found in table 1. The 1990 baseline is also the same year that the Kyoto Protocol
emissions standards are based on although it is unknown if this was done intentionally by
policy makers in NY. EO 111 was issued to all state facilities “under which the governor
has executive authority”. This approach utilizes the strength of the governor’s position
over certain state agencies in NY.
The New York State Energy Research and Development Authority (NYSERDA)
publishes the results of its energy tracking efforts in annual reports which are available
online to the public. For fiscal year 2009-2010, NYSERDA stated that of reporting
agencies, a total of 2,624 gWh of electricity were consumed. Energy usage from
electricity and all other fuel types is converted to MMBTU’s to provide a singular unit
for all energy types. These totals are the sum of approximately 16,000 state owned
buildings consisting of 224 million square feet. Statewide energy usage reductions were
measures at approximately 12.7% for FY 09-10. The largest 10 agencies, which account
for approximately 97% of the reported energy consumption total, measured a reduction of
NYSERDA has a standardized reporting form that facilities are required to fill out
for energy tracking purposes on a yearly basis. This form is a Microsoft Excel
spreadsheet that automatically calculates conversions and energy totals as various fields
are filled out.18 The use of a spreadsheet form with built in algorithms for conversions
such as BTUs to MMBTUs is a helpful and convenient feature that makes the tracking
reporting process more efficient and user friendly. Simplifying and automating reporting
forms is critical for cooperation in a program that lacks traditional enforcement
mechanisms. Convenient features such as using a spreadsheet form will hopefully
encourage agencies to comply with reporting obligations as well as streamline the
calculating process for the entity responsible for reporting.
A look at Table 1 of the FY 2009/10 report reveals that square footage has
fluctuated significantly from one year to the next, particularly from FY 2001/02 (the first
year of EO 111) to FY 2002/03. NYSERDA explains this fluctuation by stating:
“Historically, reporting Affected State Entities have changed from year to year. Some
Affected State Entities have merged, others have changed their organizational structure,
some have moved into new facilities. In addition, employee attrition has occasionally led
to subject matter experts being replaced with newer employees, which sometimes results
in the loss of historical data.”19
. NYSERDA requires agencies to report the sum of
square footage across all buildings within an agency rather than reporting for each
building individually which could have implications for the accuracy of the reported SF
totals.
18 Pgs. 67-72 of the NYSERDA annual report sfy 2009/10
NYSERDA’s FY 2009/10 Annual “Clean and Green” Report largely focuses on
the ten agencies with the largest amount of energy consumption accounting for 96% of
total reported energy usage. Of these agencies, the State University of New York
accounts for 39% of total usage. The large share of energy consumed by public
universities in NY is a consistent theme among many states in these case studies. As
pointed out in the WI and MA examples, public universities are also among the most
consistent types of public facilities in terms of reporting and tracking among many states.
For the purpose of internal guidance, the NYSERDA published a set of guidelines
for compliance with Executive Order No. 111. These guidelines help agencies to
determine applicability to Executive Order 111 for their various building ownership and
leasing arrangements as well as building size and type. According to the guidelines,
exemptions include “… buildings of less than 5,000 square feet and those loads defined
as process loads by each State Entity. Leased space that is not billed for any utilities
based upon direct use is also exempt. The guidance specifies that “the provider Entity
(building owner) owns the meter and therefore is responsible for the Annual Energy
Report for that space20. The guidance goes on to distinguish leasing agreements for
agencies in which the tenant pays the power bill by saying “the tenant State Entity paying
the utility bill is responsible for reporting the facility space. If a State Entity is leasing
space that is not individually metered, the State Entity shall not estimate energy usage nor
shall they include the square feet of the space in its Annual Energy Report”. The
guidance also states that “If a State Entity chooses to exempt process buildings or process
loads within a building, they must identify each exemption and explain the reasoning for
its exemption in a footnote to the Annual Energy Report. Each State Entity shall
determine its own process-oriented exemptions.” These exemption options allow NY to
immediately eliminate smaller buildings which generally have the least potential for
energy savings or would be too difficult to measure energy consumption on a consistent
basis. Exempting certain leasing arrangements eliminates incentive issues inherent to
lease occupants whose rates do not change whether energy consumption is reduced or
not.
The guidelines also lay out other specifics for “exterior” energy consumption as
follows:
“street lighting, highway lighting, exterior lighting, parking garage
lighting, and other ancillary electrical loads shall be included in the determination
of a State Entity’s BTU/SF metric. The electric usage of these end-uses should be
distributed over the square footage of the buildings owned by the State Entity”. 21
The guidelines recognize and specify provisions for the consumption of renewable
energy as follows:
“Renewable electricity (kWh) that is generated on-site should not be
recorded in the Annual Energy Report as energy consumed, but should be
reported in the Renewable Energy Section. Procurement of renewable energy
from the open-market should also be noted.” 22
21 Pg. 40 of the guidelines
NYSERDA reporting requirements do not include weather adjustments for harsh winters
etc. as the guidance states that “harsh weather conditions average out over the
long-term”.23
The thorough specifics laid out by these guidelines help to promote consistency
in reporting across subject NY state agencies.
The EO 111 Guidelines also advise entities to use ESPM. NYSERDA suggests
that agencies include their ESPM score in the Annual Energy Report. In addition to
directing agencies to the ESPM benchmarking programs, NYSERDA also offers its own
free benchmarking service. Agencies who wish to take advantage of this benchmarking
service fill out a building data request which asks for the year the building was built,
number of occupants and the size of the building in square feet. The form also asks for
info related to appliances, HVAC systems, and number of hours of occupancy.
Information from this form is run through models to evaluate overall performance.
Comparisons are then made to other buildings within the same agency and to other NY
state buildings. Comparing energy consumption to other state buildings allows agencies
to see how their financial resources are allocated to energy vs. other agencies within the
same state government and within a similar climate.
A unique aspect of the NY approach is the use of source conversion factors based
on ESPM for measuring energy usage24. Source conversion factors account for aspects
such as grid loss during the transfer of power from the Electrical Generating Unit (EGU)
(ex. coal fired power plant). Using source conversion allows for accounting of total
energy savings which provides a better reflection of the effects of energy conservation
23 Pg. 40 of the guidelines