Stochastic Modeling and Optimization of Laser
Machining by Response Surface Methodology
Sivarao, Ammar, T.J.S.Anand, Shukor
Abstract— Design of experiment uses a series of structured analytic method to investigate the relation between parameters and the responses. The particular technique used in this study is response surface methodology. Using the DOE approach, a mathematical based model was developed through regression analysis to study the response prediction. It is found that for kerf width the cutting speed plays an important role. Only a high cutting speed can produce good kerf width. When considering the interaction between the parameters, duty cycle directly depends on frequency where a high duty cycle is needed for high frequency cutting and vice versa to obtain a good kerf width.
Index Term— low carbon steel (EN32), response surface methodology, cutting speed, frequency, duty cycle, kerf width, dimensional accuracy.
I. INT RODUCT ION
Statistics is a branch of mathematics used extensively in natural science and also in the engineering field as well as in social science, physics and computing. The machining process selected as for this study is laser cutting process of mild steel. Response surface methodology will be used as a technique for the statistical study where the investigated parameters are cutting speed, frequency and duty cycle and the response is kerf width. The primary focus of this study will be on predicting the responses of a process by statistical means. Statistical approach here refers to an empirical method of describing the relationship between the input factors (parameters) as to how far their influence ranges on the output (responses). It is a mathematical evaluation of signifying the relationship of the parameters to the responses.
Statistical branch revolves around deriving information about the properties of random processes from sets of observed samples [1]. A general objective for a statistical study is to investigate causality especially to correlate the effect of changes in the parametric values to the responses. It is most helpful to construct a model which provides a mathematical representation of the given situation for most of the statistical based investigation [2]. The model should provide an adequate description of the given data in order to enable prediction and other inferences to be made.
T his work was supported in part by the University T eknikal Malaysia Melaka (UT eM) towards working on UT eM funded modeling of laser
machining project. Project number: S149.
Ir. Sivarao, Ammar, T.J.S.Anand & Shukor are the academic members of Faculty of Manufacturing Engineering, Universiti T eknikal Malaysia Melaka (UT eM), Hang T uah Jaya, 76100 Durian T unggal, Melaka, Malaysia who are currently working on modeling of machining processes.
T he correspondence author can be contacted via e-mail: [email protected] or [email protected]).
In general, the statistical approach can be divided into three categories:
1) Mathematical model 2) Statistical model 3) Empirical model
A. Mathematical Model
A mathematical model can be described as a theoretical model that uses mathematical language to explain the behavior of a system. Among the forms of a mathematical model are game theory model, differential equation and dynamic system. However, mathematical model are not just limited to these alone. Mathematical model is able to overlap with other models involving an array of abstract structure. In a mathematical model, there are six basic groups of variables:
1) Decision variables 2) Input variables 3) State variables 4) Exogenous variables 5) Random variables
II. OUT PUT VARIABLES
A. Statistical Model
A statistical model normally contains one or more systematic components as well as a random (or stochastic) element [2]. The random element is sometimes referred to as noise.
This element arises for various reasons and it is sometimes helpful to differentiate between:
1) Measurement error 2) Natural random variability
The natural random variability occurs due to the difference between experimental units and from changes in experimental circumstances that cannot be controlled. As for the systematic components, it is sometimes refers to as signal. In the engineering point of view, statistical analysis can be regarded as extracting information about the signal in the presence of noise.
B. Empirical Model
An empirical model can also be referred to as a regression or ANOVA model whereby it aims to capture some sort of smooth average behavior in the long run [2]. The advantage of this model (or in some cases seen as the disadvantage) is that it is not based on highly specific subject-matter consideration.
Bottom surface End width
Top surface Start width
model. It was stated that a scientist’s empirical model is simply his current best guest as the underlying mechanism at hand [3]. In other, an empirical model is developed to understand the factors that contribute to a process and how they affect each other as well as the output.
An empirical model can be built to explain the existing situation by using the existing data related to it. The empirical model consists of a function that fits the data. A matter to note here is that empirical model cannot be used to explain the system. It can only be used to predict and estimate behavior where data does not exist.
C. Objectives
There are several matters that are subjected to investigation in this study. The objectives of this study are:
1) Develop an empirical model for kerf width and surface roughness by adjusting the design parameters.
2) Integrate more than one response into the empirical model for prediction.
3) Check the consistency between the mathematical models with actual experimentation data.
4) To be able to predict the output of the responses based on the parametric values.
D. Kerf Width
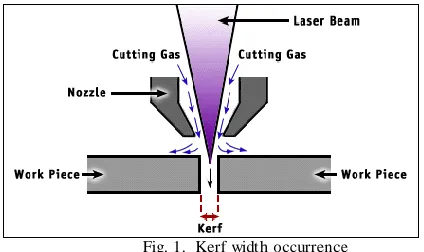
Kerf as shown in Fig. 1 is a groove, slit, or notch made by a cutting tool, such as a laser cutter or the width of a groove made by a laser cutting tool. The kerf is generally dependent upon the properties of the material being cut, the work piece thickness, the lens focal length, and finally, the type o f cutting gas used in the laser.
Fig. 1. Kerf width occurrence
Laser cutting produces a kerf, whereby the lower and upper part of the cut is usually not parallel as shown in Fig. 2. The laser cutting usually produces kerf which is usually narrower at the bottom of the cut than at the top. The kerf also referred as kerf breadth is usually measured in millimeter (mm). The kerf width varies generally between 0.15 mm for material thickness from 1mm to 6 mm and 0.5 mm for material thickness of 20 mm.
Fig. 2. T ype of Kerf Width Pattern Produced by Laser Cutting
Kerf width is measured along the whole cut line of the width as shown in Fig. 3. It is the difference of starting width of the top profile to the ending width of the top profile. This same applies to the bottom surface. However a certain evaluation length can be taken from the whole cut line to evaluate that particular length of cut line.
Fig. 3. Kerf width measurements.
III. LIT ERAT URE REVIEW
One of the most commonly used experimental design technique in mathematical modeling for laser machining process optimization is the central composite design (CCD) technique. In addition, they also stated that the most common research done in laser machining is experimental studies, modeling and optimization studies. In this case, the latter is used where statistical design experiment is used to show the relationship between input parameters and responses by using mathematical equation. It was also noted that there are more experiments with relation to laser machining uses a single response as objective for optimization in a research paper which carry out multi– objective optimization where there are two responses being investigated [1].
The parameters used in a study to optimize the laser machining to achieve the best kerf width, kerf deviation and kerf taper were assisting gas pressure, pulse width, pulse frequency and cutting speed. The RSM technique used in this statistical design experiment is Taguchi method. In their study, they discovered that pulse width and cutting speed play a significant role in affecting the kerf width and keft deviation respectively. In addition, they integrated two different method i.e. Taguchi method and principle component analysis to obtain the optimum values for the parameters. They concluded that the gas pressure of 2kg/cm2, pulse width 0.6ms, pulse frequency value 23Hz and cutting speed value of 20 mm/min for optimum value control. The optimum level for the kerf width, kerf deviation and kerf taper are 0.246mm, 0.01mm and 0.2728º [4].
frequency affects the hole tapper more while air pressure is the dominant parameter for the hole circularity. It is noted here that a lower lamp current value, lower air pressure, higher pulse frequency and a higher material thickness will give an optimum hole tapper value. A moderate value for air pressure and pulse frequency coupled with low lamp current value and a high material thickness will give an optimum hole circularity [5].
An experimental study to investigate the effects of different assist gasses i.e. oxygen, nitrogen and argon under high pressure (up to 10 bar) on the kerf width concludes that oxygen or air produces larger kerf width while inert gas gives a smallest kerf. He also noted that kerf width increases as laser power is increases and cutting speed reduces (for CO2 cutting of 3mm thick mild steel sheet) [6]. In another
experimental study on kerf width while cutting of 1.2mm thick austenitic stainless steel sheet using Nd:YAG laser cutting, it was observed that an increase in the frequ ency reduces the kerf width and the same results was observed when the effects of cutting speed, laser power and assist gas types on the kerf width were studied [6], [7]. Similar relations between the three parameters to the kerf width were also found in other experimental studies [15], [19], [22], [23], [25], [27].
In a separate study, it was found that a focus setting kept on the work piece for thin sheets (1.5 mm) and inside the workpiece for thicker sheets (3.5 mm) will reduce the kerf width during CO2 laser cutting. A study on Nd: YAG laser
cutting of 1mm thick sheet of nickel based superalloy shows that an increase in the spot overlap (function of cutting speed and pulse frequency) causes the kerf width to increase [26]. Shorter pulse duration also tend to yield smaller kerf taper than a longer pulse duration. A research was conducted on the effect of material type and its thickness on hole taper for Nd: YAG laser drilling of titanium and nickel alloys of different thickness. The results indicated that the taper angle and hole entry diameter are varying for different materials and increasing with decreasing thickness [15]. An increase in pulse frequency decreases taper angle while pulse energy have no significant effect on hole taper [10].
In a laser micro-drilling modeling and analysis to study the effects of the laser machining parameters on the HAZ thickness and tapering of the micro-holes, the chosen parameters as variables were lamp frequency, pulse frequency, assisted air pressure and pulse width. The experimental designs were done using response surface methodology using CCD technique where the model was then use to optimize the process performance. The results showed that to attain the minimum HAZ width at 0.00675 mm, the optimal setting for the parameters should be 17 A, 2 kHz, 2 kg/cm2 and 2% of the duty cycle respectively. Meanwhile, minimum taper was yielding at 0.0319 at the parameter settings 17 A, 2 kHz, 0.6 kg/cm2 and 2% duty cycle respectively [11].
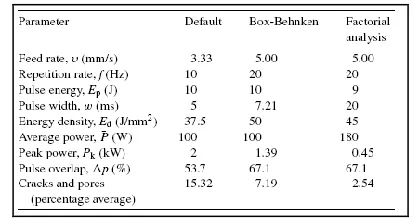
In the first stage of a design of the experiment, the parameters in question i.e. pulse energy, pulse width, repetition rate and feed rate were analyzed using RSM Box – Behnken technique. Further analysis for the process
optimization purpose was carried out using factorial analysis technique. The Box – Behnken technique analyzed the responses namely cracks and pores (cross sectional area defects) and pulse peak power with 95% confidence interval. The significant factors that were found in this study were pulse energy and pulse width. RSM modeling showed that larger pulse width even at lower peak power reduce the probability of defects occurring. The optimal results attained from the factorial analysis is more accurate with the experimental testing compared to Box – Behnken as shown in Fig. 4. With detect ranging from 2% to 3%, the parameters were feed rate at 5 mm/s, pulse frequency at 20 Hz, pulse energy of 9 J, pulse width of 20 ms and energy density at 45 J/mm2 for an optimal setting [12].
Fig. 4. Data obtained from the Box – Behnken analysis and factorial
analysis (Beal V. E. et al., 2005)
In a design of experiment study which investigate the effects of laser cutting inputs on polymeric materials. The effects of the laser power, cutting speed and compressed air pressure against the HAZ, surface roughness and dimensional accuracy for three different polymer materials (PP, PC, PMMA) was the main objective of this study. Using RSM CCD technique, predictive model have been developed to analysis how the parameters were related to the responses. The results of the experiment showed that the HAZ is directly proportional to the laser power and inversely proportional to cutting speed and compressed air pressure [13]. It was observed that the quality of cut of PMMA is much better than PC and PP. Surface roughness is found to be inversely proportional to all the parameters with cutting speed and compressed air has more influence on it than laser power. The dimensional deviations for in all measured dimensions were around 0.07 mm [13].
IV. EXPERIMENT
A. Design of Experiment
For this project, response surface methodology (RSM) is used to develop the mathematical model in order to study the effect of the parameters selected on the response i.e. kerf width. From RSM itself, central composite design (CCD) method will be used to develop the matrix for modeling. CCD is known as one the primary design techniques in RSM. This technique is used to build a second order model (quadratic model) and commonly used for process optimization. The parameters that are chosen as factors will be executed at one of the five level that later allows a quadratic model to be fit in. This technique uses a two -level design where by a center point and star configuration is added to allow the experiment to explore outside the two level designs. For this experimental study, MINITAB 14 software was used to conduct the RSM.
Before proceeding with the experiment, we must first identify the high and low value of the parameters that are selected to be used for this experimental study. The high and low value for the experiment depends on the material used. For this experiment, the material used for the cutting process is mild steel. The initial dimensions of the material were length of 6 m, width of 0.15 m and thickness of 6 mm. To get an easier to measure work piece, shearing machine was used to cut the material into 1000 mm x 150 mm size work piece.
The three parameters under investigation here are cutting speed, frequency and duty cycle. Table I shows the parameters and also the high and low values.
TABLE I
HIGH AND LOW VALUES OF THE DESIGN P ARAMETERS
Parameters Low Value High Value
Duty Cycle (%) 60 75
Frequency (Hz) 1000.0 1800.0
Cutting Speed
(mm/min) 800.0 1200.0
The other parameters as shown in Table II were kept at a constant value throughout the entire experimentation.
TABLE II
PARAMETER SETTINGS FOR CONSTANT P ARAMETERS
Parameters Low Value
S.O.D (mm) 1
F.D (mm) 0.5
Beam diameter (mm) 0.5
Gas Jet Selection O2
Gas Selection 1 (O2)
Lens 7.5
Pre-flow time 0
Nozzle Diameter (mm) 1.5mm
Nozzle T ype Cylindrical
Gas Pressure (bar) 7
Power (W) 2100
B. Preparation of Doe Matrix
Once the responses, factors and levels have been selected, the next step is to design the experimental ru ns. After the parameters and the values input into the software (MINITAB 14), a DOE model will be automatically generated with specific number of runs coupled with
specific parametric settings. In this case, 20 runs were generated as shown in Table III. Based on the runs given with the specific parametric values, the experiment is carried out and the corresponding surface roughness values taken were re-entered into the matrix.
TABLE III
EXP ERIMENTAL LAYOUT FOR RESP ONSE SURFACE
Run Cutting speed Frequency Duty cycle
1 0 0 0
2 1 1 -1
3 0 0 0
4 0 0 0
5 1 -1 1
6 0 1.68 0
7 0 0 0
8 1 1 -1
9 0 -1.68 0
10 0 0 -1.68
11 0 0 0
12 -1 -1 -1
13 -1 1 -1
14 0 0 1.68
15 -1.68 0 0
16 0 0 0
17 -1 1 1
18 1.68 0 0
19 -1 -1 1
20 1 1 1
V. RESULT S AND DISCUSSION
The complete matrix in Table III is then after used for a further analysis of the response parameter as elaborated next.
A. Kerf Width
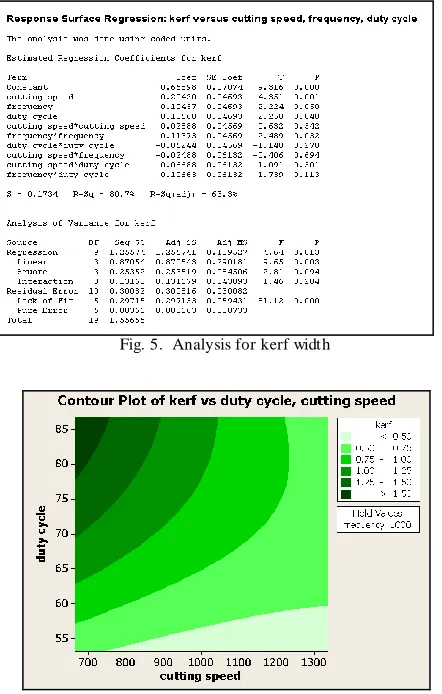
The analysis for kerf quality i.e. kerf width is using the response surface regression is shown in Fig. 5. From the values under the estimated regression coefficients, it is observed that all three; cutting speed and duty cycle has noteworthy influence on the kerf width quality. The p – value for these parameters are 0.001 and 0.048 respectively which shows that the values are below the accepted value of 0.05. As for the frequency, the p – value obtained is 0.05. Since this value on par with the acceptable level, this parameter can be considered to have influence on the kerf to some extent. This statistically proves that all three parameters have effect on the kerf width. The R – Sq value given is 80.7% and lack – of – fit value of almost 0.000 shows that the defects in the model are not significant. Another point to note here is that from the analysis of variance, a linear model has the lowest p – value which suggests that the model generated is linear also.
1200 and 1300) does not really influence the kerf quality, the value of duty cycle severely affects the kerf, where a higher value produces bigger kerf and vice versa.
Fig. 5. Analysis for kerf width
Fig. 6. Contour analysis at 1000 Hz for kerf width
In order to complete the analysis, another contour plot as shown in Fig. 7 was design with the frequency set at 1800 Hz. Here, significant difference can be observed when compared to the plot with frequency 1000 Hz. The best kerf value can be obtained by setting the cutting speed and duty cycle at a high level. For example, cutting speed in the range of 1200 to 1300 mm/min coupled with duty cycle between 85% and 75% should give out kerf width in the range of 0.2 to 0.4 mm or even less.
Fig. 7. Contour analysis at 1800 Hz for kerf width
The common denominator here is that cutting speed should be high in order to obtain good kerf quality. As the duty cycle, it can be observed that it is directly dependant to the frequency. If a lower frequency is used as in Fig. 6, a low duty cycle is needed to produce the best kerf width. The opposite can be observed in Fig. 7.
Fig. 8. Regression analysis for kerf width
The regression analysis for the kerf width as shown in Fig.8 shows that the R – Sq value for this model as 84.4%. Regression can be calculated using equation (1).
(1)
B. Response Optimization
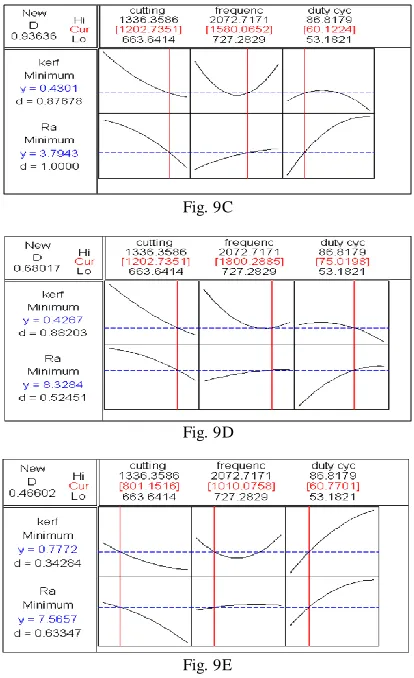
Optimization is done in order to figure out the optimal setting to get the best possible response. The figures in Figure 9 (Figure 9A to Figure 9E) below show the suggested values for the parameters to obtain an optimal surface roughness. The values in red represent the optimal parametric settings suggested by the machine to achieve good responses. The graph below shows individual factor in each column affect the response with the other factors kept constant. At the upper left corner, D represents the composite desirability while d is the individual desirability.
Fig. 9A
Fig. 9B
Fig. 9C
Fig. 9D
Fig. 9E
Fig. 9A- Fig. 9E. Suggested optimized Input Variables
Several response optimization graphs can be generated. The most important matter to be considered in selecting the optimal settings are the D and d values. The highest possible values for D and d are 1.000, hence the target is getting the optimization until the D and d values are closest to 1.000. Fig. 9A-9E above suggested optimal parametric settings are 1200 mm/min for cutting speed, 1580 Hz for frequency and 60% duty cycle. The response for this value is 0.4301 mm for kerf width.
C. Optimization Validation
Validation is the final step in the experimental investigation. Validation is also done for the response optimization to ensure that the optimal parametric setting will indeed yield the most optimal responses. Table IV shows the optimal setting and the suggested responses in a table format. These setting are then used to conduct the experiment whereby the observed response is compared with the given response. If the error deviation is less than 30%, then the optimization is counted as valid.
TABLE IV
DESIRED OUTP UT WITH THE SUGGESTED PARAMETER SETTING
No Cutting speed
(Mm/min)
Frequency (Hz)
Duty Cycle (%)
Kerf width (mm)
1 1200 1800 60 0.5180
2 1000 1800 60 0.6354
3 1200 1580 60 0.4301
4 1200 1800 75 0.4267
5 800 1010 60 0.7772
TABLE V
VALIDATION RESULTS FOR KERF WIDTH
No
Input Variables Observations
Cutting speed (mm/m
in)
Frequ ency (Hz)
Duty Cycle (%)
Response Optimizat
ion
Validat ion Experi
ment Error
%
1 1200 1800 60 0.5180 0.472 9.75
2 1000 1800 60 0.6354 0.582 9.17
3 1200 1580 60 0.4374 0.504 13.2
1
4 1200 1800 75 0.4267 0.637 33.0
1
5 1000 1010 60 0.7220 0.683 5.71
Table V above shows the comparison between the two observed responses (optimization and experimentation). From this analysis, it can be concluded that the response optimization was capable to predict the parameter setting for the desired output. This is very useful in machin ing process where, by using this tool the cost and also the machining time can be optimized to reduce unnecessary waste.
Fig. 10 below shows the comparison of error between the optimization data and the validation data. As can be observed, data number four shows some abnormality whereby the observed value is way higher than the predicted optimized value. It can be postulated that the observed value should not vary too much from the optimized value. This premise was reached based on the other data that are rather consistent with each other. The likeliness of this event happening can be related to human error while taking measurement.
From this analysis, it can be concluded that the response optimization was capable to predict the parameter setting for the desired output. This is very useful in machining process where, by using this tool the cost and also the machining time can be optimized to reduce unnecessary waste.
Fig. 10. Comparison of optimization values with validation values of Kerf Width
VI. CONCLUSION
From this experimental study, an empirical model was developed from the statistical study through the regression analysis to correlate the parameters to the response.
(2)
Equation (2) takes into accounts the influence of three different parameters to the response. As observed the model produced is a linear empirical model for the surface roughness. The results of this study show that kerf width is highly affected by the cutting speed. For the kerf width, when looking at the parameters itself, high cutting speed value is always necessary in order to obtain an optimal kerf value. The duty cycle and frequency however have some interaction effect. When a high frequency is used, is most advisable to use a high value of duty cycle also and vice versa. This shows that the duty cycle is directly proportional to the frequency. Therefore, when s etting up the machine, it is advisable to use high cutting speed and match the duty cycle with the frequency used if kerf width is an important outcome.
As for the optimization, it can be observed that the deviation error between the observed and the optimized is within acceptable range except for one which can be dismissed due to human error. This shows that the optimization exerts a high level of confident in getting the optimal responses.
VII. RECOMMENDAT ION
There are few recommendations can be given for the next experimental study to be taken under this topic. They are:
1) Repeat the same experiment (same level with same parameters and responses) with different software such as Design Expert to see the variation in the model predictability.
2) Use material with different thickness. 3) Use material of different types.
4) Further the study by including other parameters; stand – off distance, assist gas pressure, focal distance and etc.
ACKNOWLEDGMENT
The authors would like to extend their sincere thanks to the top level management of manufacturing engineering faculty, the lab coordinator and lab technicians for their continuous help and support throughout the experimental and research period of this work.
REFERENCES
[1] Arce R. G. (2005). ―Nonlinear signal processing: a stat istical
approach.‖ John Wiley & Sons.
[2] Chatfield C. (1995). ―Problem solving: a statistician’s guide, 2nd
edition.‖ Chapm an & Hall/CRC.
[3] T hompson J.R. (1989). ―Empirical model building.‖ John Wiley &
Sons.
[4] Avanish, K. D. and Vinod, Y. (2007). ―Laser Beam Machining – A
Review.‖ International Journal of Machine Tools & Manufacture.
vol. 48, no. 2008, pp 609 – 628.
[5] Biswas R. et al. (2009). ―A Parametric Study of Pulsed Nd:YAG
Laser Micro-Drilling of Gamma-T itanium Aliminide.‖ Optics &
Laser Technology. vol. 42, no. 2010, pp 23 – 31.
[6] Chen, S. L. (1999) ―The effects of high-pressure assistant-gas flow on
highpower CO2 laser cutting.‖ Journal of Material Processing
Technology vol. 88 pp. 57–66.
[7] Ghany, K.A. & Newishy, M. (2005). ―Cutting of 1.2mm thick
austenitic stainless steel sheet using pulsed and CW Nd:YAG laser.‖ Journal of Material Processing Technology vol. 168 pp. 438–447.
[8] T hawari, G. et al. (2005). ― Influence of process parameters during
pulsed Nd:YAG laser cutting of nickel-base superalloys.‖ Journal of
Materials Processing Technology. vol 170. pg 229–239.
[9] Bandyopadhyay, S. et al. (2002). ―Geometrical features and
metallurgical characteristics of Nd:YAG laser drilled holes in thick
IN718 and T i–6Al–4V sheets.‖ Journal of Materials Processing
Technology vol. 127 pg. 83–95.
[10] Karatas, C. et al. (2006). ―Laser cutting of steel sheets: influence of
workpiece thickness and beam waist position on kerf size and stria
formation.‖ Journal of Material Processing Technology vol.172 pg.
22–29.
[11] Kuar A. S. et al. (2005). ―Modeling and Analysis of Pulsed Nd:YAG
Laser Machining Characteristics During Micro-Drilling of Zirconia (ZrO2).‖ International Journal of Machine Tools & Manufacture. vol.
46, no. 2006, pp 1301– 1310.
[12] Beal V. E. et al. (2005). ―Optimisation of Processing Parameters in
Laser Fused H13/Cu Materials Using Response Surface Method
(RSM).‖ Journals of Materials Processing Technology. vol. 174, no.
2006, pp 145 – 154.
[13] Choudhury, I. A. and S. Shirley. (2009). ―Laser Cutting of Polymeric
Materials: An Experimental Investigation.‖ Optics & Laser
Technology. vol. (NA), no. (NA), pp (NA)
[14] Dhupal D. et al. (2009). ―Modeling and Optimization on Nd:YAG
Laser T urned Micro–Grooving of Cylindrical Ceramic Material.‖ Optics and Lasers in Engineering. vol. 47, no. 2009, pp 917 – 925.
[15] Al-Sulaiman, F.A. et al. (2006). ―CO2 laser cutting of a
carbon/carbon multi lamelled plain-weave structure.‖ Journal of
Material Processing Technology vol. 173 pg. 345–351.
[16] Avanish, K. D. and Vinod, Y. (2007). ― Multi-Objective Optimization
of Nd:YAG Laser Cutting of Nickel-Based Superalloy Sheet Using
Orthogonal Array With Principal Component Analysis.‖ Optics and
Lasers in Engineering. vol. 46, no. 2008, pp 124 – 132.
[17] Benyounis K. Y. et al. (2005). ―Optimizing the Laser-Welded Butt
Joints of Medium Carbon Steel Using RSM.‖ Journals of Materials
Processing Technology. vol. 164 – 165, no. 2005, pp 986 – 989.
[18] Caristan C. L., (2004). ―Laser Cutting Guide For Manufacturing.‖
Society of Manufacturing Engineers. USA. pp 17 – 23.
[19] Duley, W.W. & Gonsalves, J.N. (1974). ― CO2 laser cutting of thin
metal sheets with gas jet assist.‖ Optics and Laser Technology vol. 1
pg. 78–81.
[20] Hibbert D. B., (2007). ―Quality assurance for the analytical chemistry
laboratory.‖ Oxford University Press Inc. pp23 – 25.
[21] Ion J. C., (2005). ― Laser Processing of Engineering Materials;
Principles, procedures and industrial application.‖ Elsevier Butterworth – Heinemann. pp 355 – 363.
[22] Lamikiz, L.N.L. Lacalle, J.A. Sanchez, D. Pozo, J.M. Etayo, J.M.
Lopez, ―CO2 laser cutting of advanced high strength steels (AHSS).‖ Applied Surface Science 242 (2005) 362–368.
[23] Lum, K.C.P. et al. (2000). ―CO2 laser cutting of MDF 1.
Determination of process parameter settings.‖ Optics and Laser
Technology vol. 32 pg. 67–76.
[24] Myers R. H., Montgomery D. C., Christ ine M. Anderson-Cook
(2009). ― Response Surface Methodology: Process and Product
Optimization Using Designed Experiments 3rd Edition.‖ John Wiley
& Sons Inc. pp 74 – 76
[25] Rajaram, N. et al. (2003) J.S. Ahmad, S.H. Cheraghi, ―CO2 laser cut
quality of 4130 steel.‖ International Journal of Machine Tools and
Manufacture vol. 43 pg. 351–358.
[26] Soveja A. et al. (2008). ―Optimization of TA6V Alloy Surface Laser
T exturing Using an Experimental Design Approach.‖ Optics and Lasers in Engineering. vol. 46, no. 2008, pp 671 – 678.
[27] Zheng, H.Y. et al. (1996). ―Quality and cost comparisons between
laser and waterjet cutting.‖ Journal of Material Processing
Technology vol. 62 pg. 294–298. Kerf width = 1.39 – 0.00102 cutting speed