2584
Image Processing Analysis of Blast Fragmentation: A
Case Study of Sandstone Mining Area of Jodhpur
S. L. Borana1*, S.K.Yadav2 and S.K.Parihar3
Scientist, Remote Sensing Group, DL, Jodhpur, India1,2
Professor, Dept. of Mining, MBM Engineering College, JNV University, Jodhpur, India3 Email: [email protected], [email protected]
Abstract- The blasting operation plays an important task in the overall economics of opencast mines. The degree of fragmentation affects the loading, transport, crushing operations. Various rock fragmentation measurement methods are available and used by researchers but most of the methods are time consuming and costly. Rock Fragmentation measurement by digital image processing is a quick and low cost process. Under the present study a size distribution of blasted sandstone quarry was carried out using the Split-Desktop image processing software with acquired digital images. Image processing of the data shows that, the mean fragment size obtained is 409.09 mm, top-size is 1,442.58 mm and 5% of the fragments are below 20 mm. Outputs obtained from the software were also compared to results of the Kuz-Ram experimental model. Results showed that the performances of the digital image processing approach are approximate to Kuz-Ram model.
Index Terms- Rock Fragmentation; Sandstone Mining; Image processing; Kuz-Ram Model.
1. INTRODUCTION
The open-pit mining process is generally made up of a sequence of unit operations including drilling, blasting, loading, hauling and crushing (Jasmin Jug et al 2017). Drilling and blasting, being the first unit operations, can have a major impact on the performance and cost of subsequent operations. The objective of production blasting is to achieve optimum rock fragmentation which improves the energy efficiency of comminution processes and saves thousands of kilowatt-hours energy per year (I.C. Engin, 2010, Bhandari and Rathore,2002). Production of finer fragments in blasting operation reduces the workload of primary crushers; therefore, increasing the crusher efficiency and reducing the crushing cost (Siddique FI et. al. 2009).
Various models have been developed for the prediction of the size distribution in the blasted rock. Amongst them and the most popular is the Kuz-Ram model, an empirical fragmentation model based on the Kuznetsov (1973) and Rosin and Rammler (1933) equations modified by Cunningham (1983, 1987) which provide the uniformity index for the Rosine Rammler equation that computes the data from blasting process.
Rock properties, explosive properties, and design variables are combined in this modern version of the KuzeRam fragmentation model (P.K. Singh et al. 2015, M. Akbari et al. 2015, Jethro MA et al. 2016, B. A. Kansake et al. 2016). A dedicated software package Split Desktop was used to estimate the fragmentation distribution by analyzing scaled images from the post blast (Kulula M.I. et al. 2017).
Experiments were carried out in the sand stone mines in Jodhpur district of Rajasthan state. Rajasthan state produces high quality sandstone in the country. The important historical monuments of the country speak much about the unique quality of the sandstone of the Jodhpur area. Varied colour shades, texture and fabulous look have put the sandstone at par with marble. It is preferred over granites and marble specially, when used in flooring, fencings paneling, wall facing and in pillars.
It is especially useful for exterior cladding in sea shore buildings due to acid & thermal resistant properties. Even it is not affected with the salinity of the climate. The sandstone is being quarried and used from centuries and a number of historical buildings and monuments such as Budhist Stupas of Sarnath, Red Fort, and National Museum, Delhi; Chhitar Palace, Jodhpur etc. are made of sandstone.
2. STUDY AREA
2585 undulating and consists of small hillocks. (Borana et
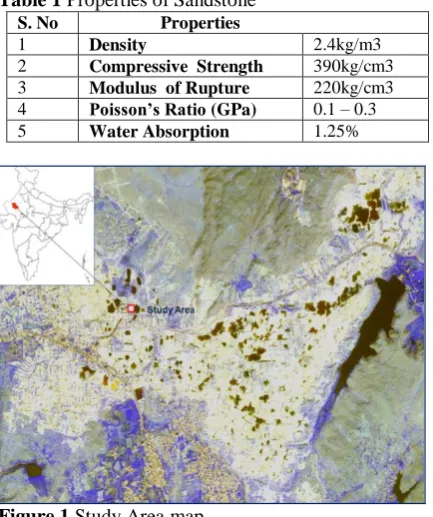
al. 2014) It is surrounded by a hilly terrain. In the North and North East of the area hills exist between 275 - 335 M altitude and in the South of the area hills of 290 - 366 M altitude exist. Geologically the area consists of Malani Igneous Suite as basement and overlain by Sonia formation (Jodhpur Group) of the Marwar Super group. (Yadav et al. 2017) The Sonia formation comprises of a sequence of Sandstone, Shale and Cherty dolomite Limestone. The prominent rock type of the study site comprises of fine grained to medium grained red and buff colored Sandstone. The common Physico-mechanical properties of the rock is given in Table-1.
Table 1 Properties of Sandstone
S. No Properties
1 Density 2.4kg/m3
2 Compressive Strength 390kg/cm3
3 Modulus of Rupture 220kg/cm3
4 Poisson’s Ratio (GPa) 0.1 – 0.3
[image:2.595.306.455.112.206.2]5 Water Absorption 1.25%
Figure 1 Study Area map.
3. BLASTING METHODS & OPERATIONS
Rock blasting is an important and essential operation in surface mining to break the rock and to reduce the size for comfortable excavation. Drilling is inevitable operation to be carried out before blasting. Other than production drilling sometimes it is also used as exploratory drilling to investigate the depth-wise distribution of minerals during prospecting. (Esen and Bilgin, 2001) In Indian mines mostly the type of the explosive used are slurries, dry mixes, emulsions and the hybrid heavy ANFO (ammonium nitrate/fuel).
Figure 2 Filed Photo of Blast holes
3.1. Drilling & Blasting Pattern
Various drilling patterns have been suggested. A drilling pattern with staggered holes is a commonly adopted in surface mines where the holes are drilled in rows and columns on the surface like grids. Inclination of hole and spacing between the rows and column are pre decided and vary depending upon the geology of the area and properties of rock. (Balasubramanian, 2017, Jimeno et al. 1995) (Fig.2&3).
[image:2.595.73.290.300.559.2]Figure 3Filed Photo of Blast holes.
3.2. Hole Diameters & Explosive Charge
Diameter of a hole is restricted by the capabilities of the drill used. Mostly in small scale quarries and in construction presplits small diameter holes, ranging from 2 to 4 inches are adopted. Presplit spacing is varied on the basis of rock type, area of operation and the bench height. Explosive charge loads will also vary depending on rock characteristics, spacing etc. The holes are charged with primer cartridge at the bottom. Main charge is filled above this as column charge. Trials should be conducted to determine the optimal blast parameters.
4. DATA AND SOFTWARE USED
[image:2.595.312.498.377.509.2]2586
Table 2Equipment and Software Used S.No Software &
Equipments
Applications
1 Split-Desktop Software
Digital Image Analysis after blasing for rock size distribution
2 Google Earth Satellite data
Satellite Images : 15/01-2018 and 10-02-2018. Visualization of the site and change detection in Pre &Post Blasting in the mine site.
3 High Speed
Camera
for recording of high-speed digital images during blasting. 4 GPS & Laser
Range Finder
Ground Control Point data.
4.1. Data Collection
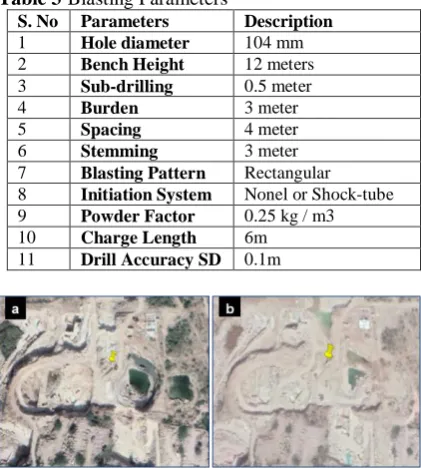
[image:3.595.309.550.251.429.2]Observations were taken on the blasting operations carried out in a sandstone quarry and a database was prepared as narrated in Table 3. In this database, burden (B), spacing(S), diameter of hole (D), bench height (H), blast pattern factor (P), stemming length (L), powder factor(K), relative effective energy of explosive(REE), mass of explosive per hole and standard deviation of drilling error were measured or calculated and have been included as in put parameters. Fig. 4 & 5 shows the Satellite Image and field photograph of study area before and after blast. Fig.6 depicts the view of the detonation sequence of sandstone quarry blast at study area.
Table 3Blasting Parameters
S. No Parameters Description
1 Hole diameter 104 mm
2 Bench Height 12 meters
3 Sub-drilling 0.5 meter
4 Burden 3 meter
5 Spacing 4 meter
6 Stemming 3 meter
7 Blasting Pattern Rectangular
8 Initiation System Nonel or Shock-tube
9 Powder Factor 0.25 kg / m3
10 Charge Length 6m
11 Drill Accuracy SD 0.1m
Figure 4Satellite Image of the Study area (a) before blast and (b) after blast.
Figure 5Field Photo of the Study area (a) before blast and (b) after blast.
Figure 6 View of the detonation sequence (a to i) of blast conducted at Sandstone Quarry.
5. DATA ANALYSIS
Split-Desktop® software is an image-processing program designed to calculate the size distribution of rock fragments through analyzing digital grayscale images. Split-Desktop software has five progressive steps for analyzing each image.The first step in the program allows the scale to be determined for each image taken in the field. In the next step, automatic delineation of the fragments is carried out for each acquired images. Systems facilitate editing of the delineated fragments for obtaining accurate output. Calculation of the size distribution is obtained for the delineated fragments. Finally, the graphing is carried out to display the size distribution outputs.
5.1. Image Acquisition
[image:3.595.73.284.477.712.2]2587 Software. Images were taken randomly in the field and
a reference of 1.5 inch in diameter was used to provide scale in the images. Single scaling object was used in this investigation. Total 5 images were taken for analysis.
5.2Fragment Delineation and Editing
[image:4.595.310.467.313.472.2]After the image acquisition, generation of binary images data is carried out from the acquired images which explicits outlines of the rock particles in the image. Split Desktop performs the automatic delineation of the particles in the image. Editing of the images is required to enhance the delineation of the individual fragment and some manual editing was carried out on the image for outlined in a continuous line (Fig.7a and b).
Figure 7 . (a) Field Image for calculation of size distribution and (b) Delineated image.
6. RESULTS AND DISCUSSION
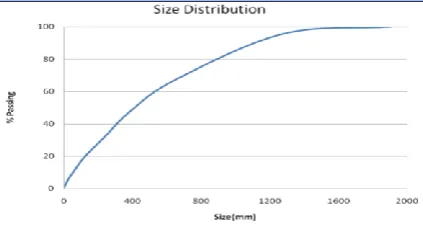
The obtained size distribution curve is depicted in Fig.8. The percentage values, Rosin-Rammler uniformity index and mean fragment size are given in Tables 4 and 5. The results obtained from the analysis of muckpile images using Split-Desktop shows that the mean fragment size is 149.76 mm and F20, F80, and Top-size are 124.53 mm, 898.82 mm and 1442.58 mm respectively. The available crusher at the quarry site accepts the fragments size as large as 1000 mm and then crush fragments to the size of 30 mm. Results shows that approximately 10% of the rock fragments size are below 30 mm. Results also shows that 5% of the rock fragments is above 1000 mm size and it requires further secondary breakage.
Figure9. Size distribution results using Split S/w.
Table 4 Cumulative Percent Passing.
Size [mm] % Passing
1905 100.00
1270 95.49
635 66.47
381 47.42
254 33.89
203.2 28.48
152.4 23.32
101.6 17.13
50.8 10.11
25.4 5.96
19.05 4.78
12.7 3.51
9.53 2.81
6.35 2.06
4.75 1.65
2 0.85
Table 5 Fragment Size Characteristics.
Size fractions Size [mm]
F10 50.10
F20 124.53
F30 217.77
F40 308.96
F50 409.09
F60 533.06
F70 702.32
F80 898.82
F90 1,099.49
Top size (99.95%) 1,442.58 Rosin-Rammler
uniformity index
1.04
Mean fragment size 409.09
6.1. Comparing Split Desktop results with results of Kuz-Ram experiential model
Digital image processing outputs are compared to the available outputs of the Kuz-Ram model. For this analysis, Mean size fragment (m) X50 can be calculated using Equation (1).
(1)
where PF is Specific charge in kg/m3, Me is the Charge mass per blast holes in kg, RWSanfo is the relative weight strength of the explosive to ANFO in %, and A is the Rock coefficient, which is assumed to be 10. Equation (2) is used for size distribution curve (Tavakol Elahi and Hosseini, 2017).
[image:4.595.73.285.642.754.2]2588 Uniformity index and characteristic size were
calculated via Eqs. (3) and (4).
(3)
(4)
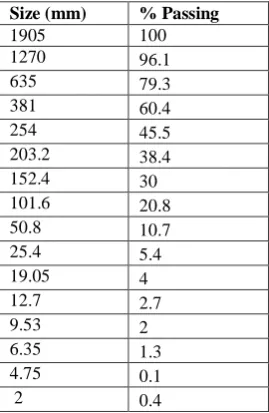
where L gives the charge length in meter, H is the bench height (m), S is the longitudinal spacing of blast holes (m), B is the burden (m), and d is the blast holes diameter (mm), and Ep: is blast holes deviation. Table-6 presents results of the Kuz-Ram experiential model. Semi-logarithmic diagram computed from the Kuz-Ram model and the diagram generated from image analyses process is shown in Figs.. 8, 9 and 10.
Figure 10. Size Distribution Results using Kuz-Ram Model.
Table 5 Cumulative Percent Passing (Kuz-Ram)
Size (mm) % Passing
1905 100
1270 96.1
635 79.3
381 60.4
254 45.5
203.2 38.4
152.4 30
101.6 20.8
50.8 10.7
25.4 5.4
19.05 4
12.7 2.7
9.53 2
6.35 1.3
4.75 0.1
2 0.4
Figure 11. Kuz-Ram model and Split-Desktop Software to Rocks Blasting.
The Rosin-Rammler uniformity index of the entire muckpile is 1.04. This index is commonly applied to approximate the size distribution of rock fragments in blasted operations. The index value ranges between scale of (0.5) very non-uniform and (2) very uniform. So from the analysis work, computed index value confirms that size distribution is non-uniform. As the results indicate that 10% fragments are below 30 mm, which is product size of the crusher, this percentage can be enhanced by optimizing the overall blasting operation.
A comparison of the results and diagrams obtained from the Kuz-Ram experiential model reveals that this model suits the conditions of sandstone quarry, because the results are similar to the results of digital image analysis in Split Desktop.
7. CONCLUSION
The easiest and economic way to mine the valuable ore bodies is through the use of explosives and well-planned blasting layouts which can produce good fragmentation profiles. Since the productivity largely depends on fragmentation, its control through effective blast design is a major challenging task in mining.
Comparison of the analysis results of the digital image processing approach with that of Kuz-Ram model, clearly shows a similarity between two and hence indicates the equal performance of the two methods.
Acknowledgments
[image:5.595.305.543.97.251.2] [image:5.595.72.292.329.480.2] [image:5.595.77.212.535.742.2]2589
REFERENCES
[1] Siddique FI, Ali shah SM, Behan MY (2009) Measurment of size distribution of blasted rock using digital image processing, JAKU. Eng Sci 20(02):81–93. [2] Esen, S. and Bilgin, H.A., “Effect of Explosive on Fragmentation”,(http://www.metsominerals.com/inetMi nerals/mm_proc.nsf/WebWID/WTB-060320
2256F60F1C/$File/esen_fragmentation_2001.pdf). [3] Borana, S.L., Yadav S.K., Parihar S.K. and Palria V.S.,
Impact Analysis Of Sandstone Mines On Environment And LU/LC Features Using Remote Sensing And GIS Technique: A Case Study Of The Jodhpur City, Rajasthan, India, J. of Environmental Research And Development, Vol. 8 No. 3A, 2014.
[4] Jimeno, C.L., Jimeno, E.L. and Carcedo, F.J.A., “Drilling and Blasting of Rocks”, A.A. Balkema, Rotterdam, Netherlands (1995).
[5] Ozkahraman, H.T., “Fragmentation Assessment and Design of Blast Pattern at Goltas Limestone Quarry, Turkey (Technical Note)”, International Journal of Rock Mechanics & Mining Sciences, Volume 43, pp: 628-633 (2006).
[6] Akbari Majid a,, Lashkaripour Gholamreza a, Yarahamdi Bafghi Alireza b, Ghafoori Mohammada, Blastability evaluation for rock mass fragmentation in Iran central iron ore mines, International Journal of Mining Science and Technology 25 (2015) 59–66. [7] Jasmin Jug , Stjepan Strelec, Mario Gazdek, Boris
Kavur, Fragment Size Distribution of Blasted Rock Mass, IOP Conf. Ser.: Earth Environ. Sci. 95 042013. [8] Jethro Michael Adebola, Ogbodo David Ajayi, Peter
Elijah.O, Rock Fragmentation Prediction using Kuz-Ram Model, Journal of Environment and Earth Science www.iiste.org ,Vol.6, No.5, 2016.
[9] Cunningham, C.V.B., 1983 “The Kuz-Ram model for prediction of fragmentation from blasting”: Proc. 1st Int. Symposium on Rock Fragmentation by Blasting, Lulea, Sweden, 2: 439-453.
[10]Cunningham, C.V.B., 1987 “Fragmentation estimations and the Kuz-Ram model – four years on”: Proc. 2nd Int. Symposium on Rock Fragmentation by Blasting, Keystone, Colorado, USA, August, 449-461.
[11]Kulula, M.I., Nashongo, M.N. and Akande, J.M. (2017) Influence of Blasting Parameters and Density of Rocks on Blast Performance at Tschudi Mine, Tsumeb, Namibia. Journal of Minerals and Materials Characterization and Engineering, 5, 339-352.
[12]Kuznetsov, V.M.(1973). The mean diameter of fragments formed by blasting rock. J Min Sci;9:pp 144–148.
[13]Yadav,S.K., Borana, S.L. and Parihar, S.K.(2017), Monitoring and Visualization of Land cover Features and Mining area of Jodhpur city using Band Ratio Techniques, Int. J. of Innovative Research in Science, Engineering and Technology, Page No 20376-20383. [14]Engin IC (2010) A practical method of bench blasting
design for desired fragmentation based on digital image processing technique and Kuz-Ram model. In: International journal of rock fragmentation by blasting-FRAG BLAST, vol 9, pp 257–263.
[15]Jethro, M.A, Shehu, S.A and Kayode, T.S, Effect of Fragmentation on Loading at Obajana Cement Company Plc, Nigeria, International Journal of
Scientific & Engineering Research, Volume 7, Issue 4, April-2016.
[16]Kansake, B. A., Temeng, V. A. and Afum, B. O. (2016), “Comparative Analysis of Rock Fragmentation Models,ACase Study”,4th UMaT Biennial International Mining and Mineral Conference, pp.1– 11.
[17]P.K. Singh, M.P. Roy, R.K. Paswan, Md. Sarim, Suraj Kumar, Rakesh Ranjan Jha, Rock fragmentation control in opencast blasting, Journal of Rock Mechanics and Geotechnical Engineering 8 (2016) 225-237.
[18]S Bhandari and S S Rathore. 'Comparative Study of Blasting Techniques in Dimensional Stone Quarrying.' Proceedings of 28 th Conf. Explosive and Blasting Techniques, Society of Explosive Engineers, Las Vegas, Nevada, USA, February 10-13, 2002, p 229. [19]Blasting and Explosives Quick Reference Guide 2010©
Dyno Nobel Asia Pacific Pty Limited 2010 www.dynonobel.com.
[20]Google Map (2018), https://www.google.com/maps/ [21] A. Balasubramanian(2017), Rock Blasting for
Mining,
Technical Report, DOI: 10.13140/RG.2.2.26967.88488