LORIA System for the WMT15 Quality Estimation Shared Task
Langlois David SMarT Group, LORIA
Inria, Villers-l`es-Nancy, F-54600, France
Universit de Lorraine, LORIA, UMR 7503, Villers-l`es-Nancy, F-54600, France CNRS, LORIA, UMR 7503, Villers-l`es-Nancy, F-54600, France
Abstract
We describe our system for WMT2015 Shared Task on Quality Estimation, task 1, sentence-level prediction of post-edition effort. We use baseline features, Latent Semantic Indexing based features and fea-tures based on pseudo-references. SVM algorithm allows to estimate the linear re-gression between the features vectors and the HTER score. We use a selection al-gorithm in order to put aside needless fea-tures. Our best system leads to a perfor-mance in terms of Mean Absolute Error equal to 13.34 on official test while the official baseline system leads to a perfor-mance equal to 14.82.
1 Introduction
This paper describes the LORIA submission to the WMT’15 Shared Task on Quality Estimation. We participated to the Task 1. This task consists in predicting the edition effort needed to correct a translated sentence. The organizers provide En-glish sentences automatically translated into Span-ish, and the corresponding post-edited sentences. The edition effort is measured by edit-distance rate (HTER (Snover et al., 2006)) between the trans-lated sentence and its post-edited version.
Classically, our system extracts numerical fea-tures from sentences and applies a machine learn-ing approach between numeric vectors and HTER scores.
As last year, no information is given about the Machine Translation (MT) system used to build data. Therefore, it is only possible to use blackbox features, or to use other MT systems whom output is compared to the evaluated target sentence.
Our submission deals with the both kinds of fea-tures. First, we use a Latent Semantic Analysis ap-proach to measure the lexical similarity between a
source and a target sentence. To our knowledge, this approach has never been used in the scope of Quality Estimation. Second, we use the output of 3 online MT systems, and we extract information about the intersection between the evaluated target sentence and the 3 translated sentences by online systems. This intersection is measured in terms of shared 1,2,3,4-grams.
The paper is structured as follows. Section 2 give details about experimental protocol and used data. We describe the features we use in Section 3. Then, we give results (Section 4) and we conclude.
2 Experimental protocol and used corpus In this section, we describe how we obtain re-sults starting from training, development and test corpus. The training and development corpus are composed of a set of triplets. Each triplet is made up of a source sentence, its automatic translation, and a score representing the translation quality.
For our experiments, we use the corpora the organizers provide. The source language is En-glish, the target language is Spanish. For each source sentence s, a machine translation system (unknown to the participants) gives a translationt
(we keep notationssandtthroughout this article for source and target sentences from the evaluation campaign data).tis manually post-edited intope. The score of (s, t) is the HTER score betweent
andpe(notedhter).
We use the official training corpustrcomposed of 11272 triplets(s, t, hter), and the official de-velopment corpusdevcomposed of 1000 triplets.
For each triplet(si, ti, hteri) in tr, we extract the features vector from(si, ti)(see Section 3 for
the list of the features we use), this leads tov(si,ti). Then, we use the SVM algorithm in order to esti-mate the regression between thev(si,ti) (ifrom 1
to 11272) and thehteri. For this estimation, we
use the LibSVM tool (Chang and Lin, 2011), with a Radial Basis Function (with default parameters:
C= 1,λ= 1
|v(si,ti)|).
Then, we use the obtained linear regression in order to predict the edit effort rate for each couple (s, t)fromdev(or test corpus for final evaluation). Filtering the features some features may not be useful because they provide more noise than in-formation, or because training data is not suffi-ciently big to estimate the link between them and the scores. Therefore, it may be useful to apply an algorithm in order to select interesting features. For that, we use a backward algorithm (Guyon and Elisseeff, 2003) we yet described in (Langlois et al., 2012). This year, we did not use the initial step consisting in evaluating the correlations be-tween features (see (Langlois et al., 2012)). The algorithm is applied on thedevcorpus in order to minimise the MAE (Mean Absolute Error) score defined byMAE(r, r0) = Pn
i=1|ri−r0i|
n whereris
the set ofnpredicted scores ondev, andr0 is the set of HTER reference scores.
3 The features
We use three sources for our features. The first source is the baseline features. The second is based on information provided by Latent Semantic approach, and the third one is based on the infor-mation provided by 3 online MT systems.
3.1 The baseline features
These 17 features are provided by the organizers of the Quality Estimation Shared Task. They are extracted by the QuEst tool (Specia et al., 2013). We can find the list of these features in the QuEst website1, (Specia et al., 2013) describe them
pre-cisely. Table 1 shows the list of these features. We can remark that no glassbox feature is used (no information about the translation process of the MT system is used). Moreover, there is not fea-ture taking into account both the source and target sentences (basing on an external translation table for example). 13 features describe the source side, while only 4 describe the target side.
3.2 Latent Semantic Indexing Based Features Latent Semantic Indexing (LSI) allows to measure the similarity between two documents. This mea-sure is based on lexical contents of the both docu-ments. To achieve this measure, the documents are
1http://www.quest.dcs.shef.ac.uk/
quest_files/features_blackbox_baseline_ 17
id S/T description
1 S number of tokens ins
2 T number of tokens int
3 S average source token length 4 S LM probability of source sentence 5 T LM probability of target sentence 6 T av. freq. of the target word int
7 S av. number of translations per word ins(as given by IBM 1 table thresh-olded such thatprob(t|s)>0.2) 8 S same as 7 but with prob(t|s) >
0.01and weighted by the inverse fre-quency of each word in the source corpus
9 S %of unigrams in quartile 1 of fre-quency extracted from an external corpus
10 S same as 9 for quartile 4
11 S same as 9 for bigrams and quartile 1 12 S same as 9 for bigrams and quartile 4 13 S same as 9 for trigrams and quartile 1 14 S same as 9 for trigrams and quartile 4 15 S %of unigrams insseen in an
exter-nal corpus
16 S number of punctuation marks ins
[image:2.595.307.531.61.420.2]17 T number of punctuation marks int
Table 1: List of baseline features. id are given to refer later to a specific feature. S, T are for ’source’ or ’target’ feature.
projected into a Vector Space Model: one docu-ment is described by a numerical vector, two doc-uments are compared by computing the distance between their corresponding vectors.
obtained low-dimension numeric space (called the LSI model).
The LSI method may be interesting for Qual-ity Estimation because LSI allows to project a s
sentence, and atsentence into the same numeric space. In this space, each document is described by a numeric vector. We can compute the similar-ity between two vectors (two documents) by co-sine distance. Two documents are similar if their lexical content is close. The interesting point for Quality Estimation is that similarity can model the ’proximity’ between ”dog” and ”bark”, ”chien”, ”aboyer”, (or ”perro”, ”ladrar” in Spanish) for ex-ample because the input documents for building the LSI model are bilingual.
We propose to use this similarity as a feature for Quality Estimation. For that, we use a training set of(source, target)sentences (actually, we use 2 different training corpus, see below). We build a corpus in which each document is made up of the concatenation of asourcesentence and its corre-spondingtargetsentence. We build the matrixM
of the tfidf scores of the words in the source
-target sentences. This matrix has n lines (the number of different source words + the number of differenttargetwords occurring more than 1 in the training corpus) andmcolumns (the number of
source-targetcouples). Then, we have to choose the dimension of the reduced numeric space (this dimension is called the number of topics). We ap-plied the LSI reduction to obtain a LSI model. In this LSI model, it is possible to project asource
sentence, or atarget sentence into the same nu-meric space. Then, the feature corresponding to a (source, target) couple in development or test corpus is the cosine distance between the LSI vec-tor corresponding to source, and the LSI vector corresponding totarget.
We use two training corpus. the first one is tr
the training corpus from the Quality Estimation Shared Task (target is here pe because pe is a correct translation of s). This corpus is close to the experimental conditions, but it contains only 11272 sentences couples. This is quite low for the LSI approach. Therefore, we use also the English-Spanish part of the Europarl (Koehn, 2005) corpus composed of 2M sentences couples2. Each
train-ing corpus leads to one LSI model.
To synthesize, we extract a feature from a(s, t)
2Release v7, http://www.statmt.org/
europarl/
couple in four steps:
1. LSI = buildLSI(training corpus,number of topics)
2. LSIs=LSI(s)
3. LSIt=LSI(t)
4. feature = cosine distance between LSIs and
LSIt
LSIis a function which projects a sentence into the numeric LSI space. The number of topics is one crucial parameter of the LSI approach. In Section 4, we explore the performance of the LSI based features according to this parameter.
3.3 The Machine Translation systems based features
We propose here to use pseudo-references. The idea is to compare twith other translations of s, provided by other MT systems. We hypothesise that the moretand other target sentences from the samesshare parts, the more correcttis.
Several online translation systems yet exist on the web, and a few of them provide API allowing to request translations. We used three online sys-tems noted A, B and C3. We used each system
A,BandCto translate the sentences fromtr and
dev. Therefore, from each sentence s, we have four target sentences: tfrom the system we want to estimate the quality,tAfrom systemA,tBfrom
systemB, andtCfrom systemC.
For each online system, we define 9 features to describe how muchtandtX(XisA,BorC) share n-grams. Moreover, we define 4 features taking into account the three online systems together.
from 1 to 3) shared bytand the pseudo-reference sentence. (Wisniewski et al., 2014) do not pre-cise the number of pseudo-references, but they use the lattice produced by their in-house system, this leads certainly to a high number of pseudo-references. (Luong et al., 2014; Wisniewski et al., 2014) works are applied to word-level Qual-ity Estimation while we deal with sentence-level Quality Estimation. (Scarton and Specia, 2014) use features from pseudo-reference sentences for sentence-level quality estimation. The features they extract are classical measures of translation quality (BLEU, TER, METEOR, ROUGE) be-tweentand pseudo-reference. (Scarton and Spe-cia, 2014) cite different works (Soricut et al., 2012; Shah et al., 2013) using also these measures for Quality Estimation. Differently, in our work, we use n-grams statistics in order to measure the consensus betweentand pseudo-references.
3.3.1 Amount of sharedn-grams betweent
andtX
We describe the intersection betweentand each of
tA,tBandtCby 9 features.
The first four ones are recalln-gramRX,n:
RX,n(t, tX) =
P
ng∈t,|ng|=nδ(ng, tX)
|tX| (1)
whereXisA,BorC,ngis an-gram of length
n,δ(ng, tX)is equal to 1 ifngis intX and equal
to 0 otherwise, and|tX|is the number ofn-gram in
tX.ntakes its values between 1 and 4. Therefore,
there are 4 features for each system.
The following four features are precision n -gramPX,n, which are equivalent toRX,n(t, tX),
but the denominator is|t|. Here also, there are 4 features for each system.
For these 8 features, an-gram intXis taken into
account only one time. For example, ift=a b a, andtX =a b, there is only one match forawhen
n= 1, even if there are twoaint.
The last feature is the maximum length words sequence fromtthat is also intX:
M(t, tX) = max[|ng|, s.t. ng|t∈| t and ng∈tX]
(2) Each system leads to 9 features.
3.3.2 Taking into account the three online system together
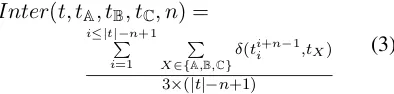
We define 4 additional features which describe how many pseudo-references include an-gram of
t(nvaries from 1 to 4). The idea is that if a n -gram from t occurs in 3 pseudo-references, it is likely a correctn-gram whereas if it occurs only in one pseudo-reference, it is more doubtful. These features are formalized by the following formula:
Inter(t, tA, tB, tC, n) =
i≤|t|−n+1
P
i=1
P
X∈{A,B,C}δ(t
i+n−1
i ,tX)
3×(|t|−n+1)
(3)
wheretb
a is the words sequence fromtstarting
at position a and ending at position b, and other notations are defined as previously.ntakes values from 1 to 4. Therefore, this leads to 4 additional features. In the following, we use the acronym
Interto refer to these 4 features.
Overall, our system deals with 50 features: 17 from baseline, 2 from LSI approach, 9 for each of the three online systems, and 4 from the combina-tion of these three systems.
4 Results
[image:4.595.327.524.211.258.2]4.1 Baseline features
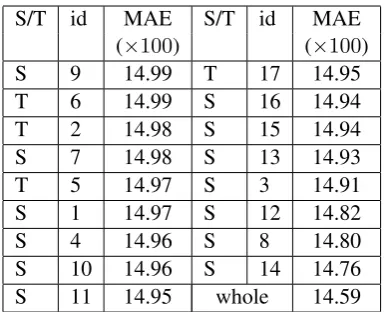
Table 2 shows the results in terms of MAE on de-velopment corpus of each baseline feature used alone (only one feature is used to predict the HTER score). The feature ids refer to the line number in Table 1. Source/Target information in-dicates if the feature is a ’source’ one (S) or a ’tar-get’ one (T). The last line of Table 2 shows the MAE performance when all the 17 baseline fea-tures are used (’whole’ line). The baseline system leads to a performance of 14.59. Interestingly, a feature alone leads to performance between 14.76 and 14.99. Thus, using only one feature allows to obtain good performance compared with using the whole set of features.
4.2 LSI based features
S/T id MAE S/T id MAE (×100) (×100) S 9 14.99 T 17 14.95 T 6 14.99 S 16 14.94 T 2 14.98 S 15 14.94 S 7 14.98 S 13 14.93
T 5 14.97 S 3 14.91
S 1 14.97 S 12 14.82
S 4 14.96 S 8 14.80
[image:5.595.85.279.60.216.2]S 10 14.96 S 14 14.76 S 11 14.95 whole 14.59
Table 2: MAE score ondev of each baseline fea-ture, and of the whole 17 baseline features
we compute the LSI score of each(s, t)intr. We add this score as a new feature to the 17 baseline. We apply the protocol of Section 2 in order to ob-tain the MAE score on thedevcorpus. We show in Table 3 the results.
Nb Topics LSI Training Corpustr Europarl
10 14.55 14.54
20 14.55 14.54
30 14.52 14.57
40 14.52 14.59
50 14.51 14.58
60 14.50 14.58
70 14.49 14.57
80 14.48 14.56
90 14.49 14.55
100 14.49 14.56 150 14.50 14.53 200 14.50 14.50 250 14.51 14.50 300 14.51 14.50 350 14.50 14.49 400 14.52 14.49 500 14.52 14.48
Table 3: Performance in terms of MAE on dev
of LSI feature according to the number of topics. The LSI feature is associated with the 17 baseline features.
The best performance are obtained for a number of topics equal to 80 for thetrcorpus, and equal to 500 for the Europarl corpus. This is not surprising because Europarl corpus is strongly bigger thantr. Compared to baseline MAE (14.59), the LSI
fea-tures leads to an improvement of 0.11 points.
[image:5.595.101.263.350.622.2]4.3 Online systems based features
Table 4 shows the performance when online sys-tems based features are used with the 17 base-line features. For each base-line, a ’X’ indicates that the used features set includes the 9 features corre-sponding to the system of the column (A,BorC). The ’X’ in column ’Inter’ indicates that the fea-tures taking into account the three systems (for-mula 3) are used. The table shows that B is the most useful system, and thatCis the less useful for prediction. Be careful that this does not give indi-cation about the relative translation performance of online systems, but this indicates how the out-put quality of each system is correlated to the qual-ity of the unknown system used by the organiz-ers. The lack of usefulness ofCfor prediction is confirmed when the features fromA,BandCare combined. We obtain a better performance (13.93) whenCis not used. Finally, adding the ’Inter’ fea-tures does not lead to improvement. This may be because these features are correlated with ’A’, ’B’ and ’C’: if a sentence is easy to translate, then, all systems should propose the same translation, this leads to high values for ’A’, ’B’ and ’C’, and also for ’Inter’.
Baseline A B C Inter MAE (×100)
X X 14.38
X X 14.28
X X 14.02
X X X X 13.95
X X X X X 13.95
X X X 13.93
Table 4: MAE Score ondevcorpus of online sys-tems based features.
4.4 Whole set of features and filtering
[image:5.595.310.525.438.539.2]fil-Features
Baseline LSI online system based features MAE (×100) set tr80 Europarl 500 A B C Inter without with
filtering filtering
1 X X X X X 13.92
2 X X X X X 13.91
3 X X X X X X 13.90
4 X X X X X X X 13.90 13.70
5 X X X X X X 13.88
[image:6.595.81.518.62.190.2]6 X X X X X 13.87 13.72
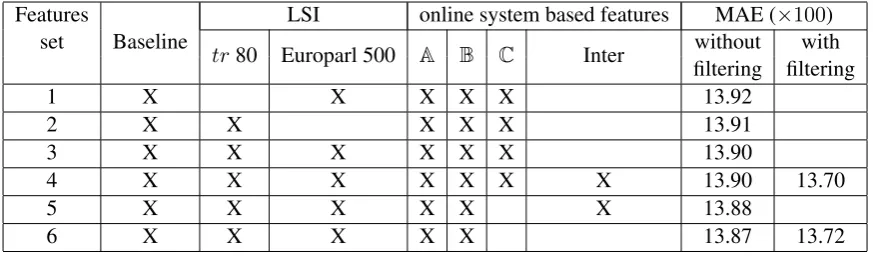
Table 5: Performance in terms of MAE ondevof the whole set of features
tering, it is is better to use the 50 features (13.90, line 4) and let the algorithm to automatically select the useful features: this leads to a performance of 13.70, better than 13.72 obtained by filtering the features set 6.
When we filter features set 4, we obtain 29 final features. 11 baseline features are kept (8 ’S’ and 3 ’T’). Therefore, ’T’ features are not numerous, but they are essential (3 are kept among 4). The LSI feature fromtr is kept, but not the one from Europarl, maybe because the Europarl corpus is external to the Quality Estimation task. The se-lection of online systems based features confirms the relative usefulness of online systemsA,B, and
C: only 2 ’C’ features are kept, 4 ’A’ features are kept, and 8 ’B’ features are kept. Last, 3 ’Inter’ features among 4 are selected.
Finally, the baseline system (17 features) ob-tained a MAE score equal to 14.82 on the offi-cial test corpus. We submitted two systems, cor-responding to line 4 in Table 5 (without and with filtering). The system without filtering led to a per-formance equal to 13.42 on the test corpus, and the same one after filtering led to a better performance equal to 13.34. Therefore, the results on the devel-opment corpus are confirmed by the test corpus.
5 Conclusion and perspectives
In this paper, we present our submission to the WMT2015 Quality Estimation Shared Task. Our system estimates quality at sentence level. In ad-dition to the 17 baseline features, we use Latent Semantic Indexing based features which allow to measure the similarity between source and target sentences. Moreover we use pseudo-references from online machine translation systems, we ex-tract n-gram statistics measuring the consensus be-tween the target sentence and pseudo-references.
The features based on pseudo-references are
more helpful for prediction than LSI based fea-tures. But there is a bias here, because we use only 2 LSI based features. We have now to extend the LSI approach. One first possibility is to use other ways to describe the latent semantic space, such as Latent Dirichlet Allocation (Blei et al., 2003). Second, the main drawback of LSI approach is that only lexical information is taken into account. One promising way is to include words sequence into the LSI model because Machine Translation is phrase based. We have yet tested this direction, but words sequences should be integrated carefully to obtain a tractable model.
References
D. M. Blei, A. Y. Ng, and M. I. Jordan. 2003. Latent dirichlet allocation. the Journal of machine Learn-ing research, 3:993–1022.
C.-C. Chang and C.-J. Lin. 2011. LIBSVM: A library for support vector machines. ACM Transactions on Intelligent Systems and Technology, 2:27:1–27:27. I. Guyon and A. Elisseeff. 2003. An introduction to
variable and feature selection. Journal of Machine Learning Research (Special Issue on Variable and Feature Selection), pages 1157–1182.
P. Koehn. 2005. Europarl: A parallel corpus for statis-tical machine translation. InMT summit, volume 5, pages 79–86.
D. Langlois, S. Raybaud, and Kamel Sma¨ıli. 2012. Lo-ria system for the WMT12 quality estimation shared task. In Proceedings of the Seventh Workshop on Statistical Machine Translation, pages 114–119. M. L. Littman, S. T. Dumais, and T. K. Landauer. 1998.
Automatic cross-language information retrieval us-ing latent semantic indexus-ing. InCross-language in-formation retrieval, pages 51–62. Springer.
Translation, pages 335–341. Association for Com-putational Linguistics.
M. Saad, D. Langlois, and K. Sma¨ıli. 2014. Cross-lingual semantic similarity measure for comparable articles. InAdvances in Natural Language Process-ing, pages 105–115. Springer.
C. Scarton and L. Specia. 2014. Exploring consen-sus in machine translation for quality estimation. In
Proceedings of the Ninth Workshop on Statistical Machine Translation, pages 342–347. Association for Computational Linguistics.
K. Shah, T. Cohn, and L. Specia. 2013. An investi-gation on the effectiveness of features for translation quality estimation. InProceedings of the Machine Translation Summit, volume 14, pages 167–174. M. Snover, B. Dorr, R. Schwartz, L. Micciulla, and
J. Makhoul. 2006. A study of translation edit rate with targeted human annotation. InProceedings of association for machine translation in the Americas, pages 223–231.
R. Soricut, N. Bach, and Z. Wang. 2012. The sdl language weaver systems in the wmt12 quality es-timation shared task. In Proceedings of the Sev-enth Workshop on Statistical Machine Translation, pages 145–151. Association for Computational Lin-guistics.
L. Specia, K. Shah, J. GC De Souza, and T. Cohn. 2013. QuEst A translation quality estimation frame-work. InACL (Conference System Demonstrations), pages 79–84.