http://dx.doi.org/10.4236/jilsa.2014.61001
Fuzzy-Weighted Similarity Measures for Memory-Based
Collaborative Recommender Systems
Mohammad Yahya H. Al-Shamri, Nagi H. Al-Ashwal
Electrical Engineering Department, Faculty of Engineering and Architecture, Ibb University, Ibb, Yemen. Email: [email protected], [email protected]
Received October 9th, 2013; revised November 9th, 2013; accepted November 16th, 2013
Copyright © 2014 Mohammad Yahya H. Al-Shamri, Nagi H. Al-Ashwal. This is an open access article distributed under the Crea-tive Commons Attribution License, which permits unrestricted use, distribution, and reproduction in any medium, provided the original work is properly cited. In accordance of the Creative Commons Attribution License all Copyrights © 2014 are reserved for SCIRP and the owner of the intellectual property Mohammad Yahya H. Al-Shamri, Nagi H. Al-Ashwal. All Copyright © 2014 are guarded by law and by SCIRP as a guardian.
ABSTRACT
Memory-based collaborative recommender system (CRS) computes the similarity between users based on their declared ratings. However, not all ratings are of the same importance to the user. The set of ratings each user weights highly differs from user to user according to his mood and taste. This is usually reflected in the user’s rating scale. Accordingly, many efforts have been done to introduce weights to the similarity measures of CRSs. This paper proposes fuzzy weightings for the most common similarity measures for memory-based CRSs. Fuzzy weighting can be considered as a learning mechanism for capturing the preferences of users for ratings. Com-paring with genetic algorithm learning, fuzzy weighting is fast, effective and does not require any more space. Moreover, fuzzy weightings based on the rating deviations from the user’s mean of ratings take into account the different rating scales of different users. The experimental results show that fuzzy weightings obviously improve the CRSs performance to a good extent.
KEYWORDS
Collaborative Recommender Systems; Pearson Correlation Coefficient; Cosine Similarity Measure; Mean Difference Weights Similarity Measure; Fuzzy Weighting
1. Introduction
Web services grow very fast letting Web users in a diffi-cult position to select from a huge number of choices. This creates an argent need for Web personalization tools that help users navigate Web easily in a personalized way. Collaborative recommender system (CRS), the most suc-cessful Web personalization tool [1-6], recommends a given active user items to people with similar tastes and preferences liked in the past. Today, recommender sys-tems become a must in many Web applications. Amazon, eBay, MovieLens and many others use some types of recommender systems [2-5]. In real life, we cannot ex-pect users to come across or have heard of each of the products (items) they might like.
Out-of-the-box recommendation is the most important feature of CRSs which allows CRS recommends a di- verse set of items to an active user based on the tastes
and past preferences of his set of neighbors. This set of neighbors play an important role in the CRS success [1,2,6]. As long as the neighborhood set is close and rep-resentative to the active user, the CRS suggestions will be more valuable. Hence, a great attention has to be paid for selecting the set of neighbors. Actually CRS con-structs the set of neighbors based on a similarity measure which has to reflect the most important factors between the two users in consideration. Consequently, the simi-larity computation phase for any CRS plays the heart role for its success. Different similarity measures often lead to different sets of neighbors for a given active user and thus a good similarity measure will be that one producing a close set of neighbors for that active user.
fer from time to time and the actual employed rating scale differs from user to user. Therefore the raw declared rat-ings need to be weighted so that a weighted rating scale is obtained for all users. Most of the previous weighting work for Pearson correlation coefficient was focusing either on genetic algorithm (GA) [7,8] or on trust and reputation as similarity modifiers [9]. However, GA ap-proach takes a long time for training and forces the sys-tem to store the evolved weights which are an extra load for the system. Other weighting techniques like signifi-cance weighting using trust and variance weighting for discerning user’s interest for items are studied by Her-locher etal. [10]. Sometimes the inverse user frequency is used for distinguishing universally liked items from less common items [11]. The contribution of the univer-sally liked items is decreased as they are not useful for capturing similar users while the contribution of the less common items is increased as they are useful for captur-ing similar users.
This paper proposes fuzzy weightings for the most popular similarity measures for memory-based CRS. Fuzzy weighting increases the effectiveness of the simi-larity measure for capturing close set of neighbors with-out loading the CRS in time or in space. Consequently, the CRS accuracy gets enhanced. The main contributions of this paper are three-folds.
A methodology for fuzzifying rating values and rating deviation values is proposed.
Fuzzy weightings for the most popular similarity meas-ures of memory-based CRS are proposed.
Fuzzy mean difference weights similarity measure is introduced.
The rest of this paper is organized as follows: an in-troduction to some similarity measures of memory-based CRS is given in Section 2. Section 3 explores the answer to two main questions for fuzzy weighting. The two ques-tions are What and How to fuzzify? Fuzzy-weighted similarity measures for memory-based CRS are intro-duced in Section 4. The experimental methodology and results for the proposed approaches with the traditional approaches are presented in Section 5. Finally, we con-clude our work in the last section.
2. Similarity Measures for Memory-Based
CRS in Literature
Formally, CRS has M users, U=
{
u1,,uM}
, having preferences for certain items such as products, news, web pages, books, movies, restaurants, destinations, or CDs. The user’s degree of preference for an item is represented by a rating that is obtained explicitly from the user di-rectly or inferred implicitly from the users’ navigation behavior. For example, if an Amazon customer views information about a product, the system can infer that they are interested in that product, even if they don’t buyit [1,2,6]. Each user ui rates a subset of items Si from the K items, S =
{
s1,,sK}
, of the system. The de- clared rating of user uc for an item sk is denoted by, c k
r and the user’s average rating is denoted by mc. The set of users cross the set of items form a user-item matrix which is called sometimes a utility matrix [1,2,6].
The set of ratings for each user forms the user profile which has to be compared to other users’ profiles based on a predefined similarity measure. The similarity between two users is a measure of how closely they resemble each other. Once similarity values are computed, the CRS sys-tem ranks users according to their similarity values with the active user to extract a set of neighbors for him. Ac-cording to the set of neighbors, the CRS assigns a pre-dicted rating to all the items seen by the neighborhood set and not by the active user [2,6]. The predicted rating,
, x k
pr , indicates the expected interestingness of the item
k
s to the user ux.
The most popular similarity measure for memory-based CRS is the Pearson correlation coefficient (PCC) [1,2,6]. PCC computes the similarity between two users, ux and
y
u , based only on the common ratings, Sxy, both users have declared. The PCC is given by:
(
)
(
)(
)
(
)
(
)
, ,
2 2
, ,
corr , k xy
k xy k xy
x k x y k y
s S x y
x k x y k y
s S s S
r m r m
r m r m
∈
∈ ∈
− −
=
− −
∑
∑
∑
u u (1)
The CRS’s literature described also the cosine similar-ity measure [2,6], which treats each user as a vector in the items’ space and then takes the cosine of the angle between the two vectors as a similarity measure between the two users.
(
)
2 , , 2, ,
cos , k xy
k xy k xy
x k y k
s S
x y
x k y k
s S s S
r r
r r
∈
∈ ∈
=
∑
∑
∑
u u (2)
(
)
(
, ,)
sim , k xy
x k y k s S
x y
xy
w r r
S ∈
− =
∑
u u (3)
Bobadilla et al. [7] divide Formula (3) by the differ-ence between the maximum and minimum values of the rating scale. However, this factor is not necessary be-cause Formula (3) already divides the weights by their number. The numerator cannot exceed Sxy in any way since w∈ −
[ ]
1,1 . The only effect this factor has is re-ducing the similarity values which in turn will reduce the contribution of each neighbor’s rating in the aggregation process. Moreover, the learning intervals of GA used by [7] are small. This will degrade the usefulness of GA learning process.3. What and How to Fuzzify?
Weighting some variables of the user profile is an effec-tive way to capture the users’ different tastes for the CRS rating scale. However, most of the previous work based this weighting on GA as a learning technique. Although GA can focus on the good items while removing bad ones or reducing their impact but it requires a long time for learning the weights and a large space for storing them later. Moreover, these weights have to be recalcu-lated periodically to capture the users’ changing tastes over time. Therefore GA is a good way if we have time and space.
We argue that a simple and effective way will be that one uses fuzzy logic to get these weights by employing some variables of the user profile. This leads to fuzzy- weighted similarity measures for memory-based CRS. Having you agreed to use fuzzy logic instead of GA for evolving weights. Two main questions arise, What and How to fuzzify? The answer to these two questions de-pends on the nature of the user profile. The user profile of memory-based CRS consists of a set of ratings for a subset of the system’s items. Accordingly, we have four main variables for the user profile, namely, the ratings themselves, the mean of these ratings, the rating devia-tion of each rating from the user’s mean rating, and the user total number of ratings.
The rating and the rating deviation variables are very close to the user’s taste for the rating scale. However, these ratings have less value if the user’s number of rat-ings is too small. Thus the user rating and the rating de-viation variables are the more appropriate candidate to be fuzzified if the ratings are somehow dense. Normally, the user ratings follow a fixed rating scale which is usually a discrete rating scale while the rating deviation takes a continuous range. This nature of both variables will de-termine the fuzzy sets suitable for each one of them.
Figures 1 proposes some fuzzy sets for a 5-point rating scale for the rating variable. Figure 1(a) represents each
rating as a triangular fuzzy set that can be named very bad, bad, good, very good and excellent. Figure 1(b)
gives three fuzzy sets for ratings that can be named bad (trapezoidal), neural (triangular) and good (trapezoidal). This representation treats rating 1 and 2 similarly as bad ratings and ratings 4 and 5 as good ratings. However, this is not always true especially for those users paying more attention for their votes. This situation getting worse with the two trapezoidal fuzzy sets of Figure 1(c) which groups ratings 1 and 2 as bad ratings and ratings 3, 4 and 5 as good ratings. Figure 1(d) seems to be more appropriate representation because it grades the membership values of ratings between two fuzzy sets bad and good sets.
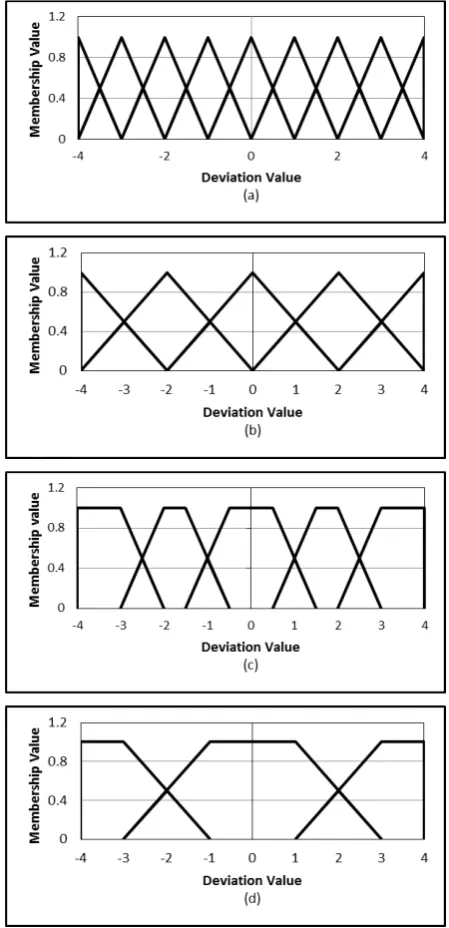
On the other hand, rating deviation values have a con-tinuous range from a negative maximum to a positive maximum based on the rating scale nature. For a 5-point rating scale, the deviation value starts from −4 (rating 1 - rating 5) to 4 (rating 5 - rating 1). Accordingly, the range of choices for fuzzy sets representing deviation values is wider and more flexible than that of ratings themselves.
Figure 2 proposes some possible fuzzy sets for the de-viation value for a CRS with a 5-point rating scale. Fig-ures 2(a) and (b) give nine and five triangular fuzzy sets for the deviation scale, respectively. The nine fuzzy sets seem to be large number while the five fuzzy sets are more acceptable. Instead of the five triangular fuzzy sets we can use five trapezoidal fuzzy sets as given in Figure 2(c). The trapezoidal fuzzy sets give flexibility for some values to be indifferent. This is more suitable for devia-tion values rather than rating values. The last opdevia-tion is
Figure 2(d) which maps the deviation scale into three trapezoidal fuzzy sets. However, due to the long con-tinuous and range of deviation values, the trapezoidal five fuzzy sets seem to be more appropriate than the other three ones.
To answer the second question we have to keep in mind that each profile variable has a crisp value. This value has to be mapped to fuzzy sets through member-ship values. That means each crisp value has to be mapped to a vector of membership values where the vector length is determined by the number of fuzzy sets representing that variable [13]. For example, each crisp value of rating,
, x k
r , will get a 2-tuple membership values (2-tuple vector) to the two bad and good fuzzy sets of Figure 1(d) as defined by the following membership functions.
( )
1,1 5
4 b
r
m r = − ≤ ≤r (4a)
( )
5,1 5
4 g
r
m r = − ≤ ≤r (4b) For example, if rx k, =2 then the corresponding 2-tu- ple membership vector will be rx k, = 0.25, 0.75 . Based on the membership vectors, we can get the fuzzy weight,
k
w , for the th
k common item as [14]:
(
, ,)
2 disk x k y k
w = − r −r (5) where rx k, is the membership vector for rx k, value and
(
, ,)
dis rx k −ry k is any vector distance metric. In this pa-per, Euclidean distance function [13-15] is used for this purpose. In general rx k, and ry k, are two membership vectors of size l (in this paper l=2).
(
)
(
)
2, , , ,
1 dis
l
j j
x k y k x k y k
j
r r
=
− =
∑
−r r (6)
where rx k,j is the membership value of rx k, to its jth fuzzy set. We subtract dis
(
rx k, −ry k,)
from 2 inFigure 2. Different choices of fuzzy sets for the rating devia-tion variable.
Formula (5) because 2 is the maximum distance value that we can get from Formula (6) [in this case the two deviation values belong to two different fuzzy sets with a unity membership value to each one of them, for example
, 1, 0 x k =
r and ry k, = 0,1 ]. For fuzzifying the rating deviation values, devy k, , we define five fuzzy sets for each deviation value (Figure 2(c)). The membership val-ues for these fuzzy sets are defined as follows [14]:
( )
1
1 4 3
0 4 and 2
2 3 2
d
m d d d
d d
− ≤ ≤ −
= < − > −
− − − < ≤ −
( )
2
0 3 and 0.5
3 3 2
1 2 1.5
0.5 1.5 0.5
d d
d d
m d
d
d d
< − > −
+ − ≤ ≤ −
= − ≤ ≤ −
− − − < < −
(7b)
( )
3
0 1.5 and 1.5
1.5 1.5 0.5
1 0.5 0.5
1.5 0.5 1.5
d d
d d
m d
d
d d
< − >
+ − ≤ ≤ −
= − ≤ ≤
− < <
(7c)
( )
4
0 0.5 and 3
0.5 0.5 1.5
1 1.5 2
3 2 3
d d d d m d d d d < > − ≤ ≤
= < ≤
− < <
(7d)
( )
5
0 2 and 4
1 3 4
2 2 3
d d
m d d
d d
< >
= < ≤
− ≤ ≤
(7e)
Accordingly, each deviation value will get a 5-tuple membership values (5-tuple vector) to the five fuzzy sets. For example, if devy k, =2.3, then the corresponding 5-tuple membership vector will be
, 0, 0, 0, 0.7, 0.3 y k
dev = . The fuzzy weight, wk, for the th
k common item is obtained by Formulae (8) and (9) as done before for the rating values.
(
, ,)
2 dis ,
k x k y k
w = − dev dev (8)
(
)
(
)
2, , , ,
1
dis ,
l
j j
x k y k x k y k
j
dev dev =
=
∑
−dev dev (9)
where devx k, is the membership vector for devx k, value. In general devx k, and devy k, are two vectors of size l
(in this paper l=5) where j, x k
dev is the membership value of the devx k, value to its jth fuzzy set. An ex-ample of two deviation values belonging to two different fuzzy sets with a unity membership value to each one of them is devx k, = 1, 0, 0, 0, 0 and devy k, = 0, 0, 0,1, 0 .
4. Fuzzy-Weighted Similarity Measures for
Memory-Based CRS
Usually, weighting the similarity measure is done by introducing a weight, wk, to its numerator. The way of calculating these weights determines the weighting name. Consequently, the fuzzy-weighted cosine similarity meas-ure and fuzzy-weighted Pearson correlation coefficient are defined as below:
(
)
2 , , 2, ,
cos , k xy
k xy k xy
k x k y k
s S
x y
x k y k
s S s S
w r r
r r ∈ ∈ ∈ =
∑
∑
∑
u u (10)
(
)
(
)(
)
(
)
(
)
, , 2 2 , ,corr , k xy
k xy k xy
k x k x y k y
s S x y
x k x y k y
s S s S
w r m r m
r m r m
∈ ∈ ∈ − − = − −
∑
∑
∑
u u (11)
For both similarity measures, the fuzzy weights can be obtained based on the raw ratings themselves or based on the rating deviations. The direct rating values ignore the user’s taste and preferences for the rating scale while the rating deviations implicitly take the users’ different rat-ing scales into consideration. Therefore we expect that the fuzzy weighting based on the rating deviations will perform better than the fuzzy weighting based on the raw ratings.
The third similarity measure we have examined is the mean difference weights similarity measure which gives an indirect way for calculating the similarity between users. The main idea for this similarity measure is how to get weights for the differences before summing up these weights. Bobadilla etal. [7] uses GA weights. However, fuzzy logic offers a very good alternative for calculating these weights without the headache of GA learning. The time complexity of GA learning depends on the number of users, number of items and the number of iteration required if a predefined threshold of the fitness function is not satisfied. For space complexity, GA learning process requires the system to store as large as the utility matrix for GA weights. On the other hand, fuzzy weighting cal-culates weights on-the-fly. The system needs to store these weights only at the implementation stage. The time complexity of calculating the fuzzy weights depends on the lengths of the vectors ry k, and devy k, . This time can be assumed constant as the lengths of the vectors
, y k
r and devy k, are constants for a given system. A more general mean difference weights similarity measure can be rewritten in terms of the difference, dif , as be-low.
(
)
( )
difsim , k xy
k s S x y xy w S ∈ =
∑
u u (12)
The difference can take many forms based on the un-derlying variable. In this paper, the difference can be obtained between the raw ratings or between the rating deviations from their corresponding rating means.
, ,
dif= rx k−ry k (13)
, ,
dif= devx k −devy k (14)
op-tion uses the two fuzzy sets for ratings depicted in Fig-ure 1(d) (Formula (4)). The corresponding fuzzy weights are calculated using Formulae (5), and (6). The second option uses the five fuzzy sets for rating deviation values depicted in Figure 2(c) (Formula (7)). The correspond-ing fuzzy weights are calculated uscorrespond-ing Formulae (8), and (9). The two options get fuzzy weights without going through a comprehensive GA learning.
5. Experimental Evaluation
5.1. Dataset Selection and Formation
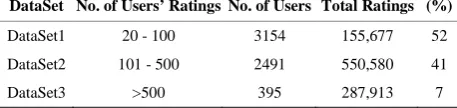
We conduct our experiments using the one million Mo- vieLens dataset [16]. This dataset consists of 1,000,209 ratings by 6040 users on 3900 movies. Table 1 illustrates the distribution of the users of this dataset according to the number of each user’s declared ratings. Consequently, the total dataset is divided into three datasets, DataSet1, DataSet2, and DataSet3 according to the user’s total rat- ings. To mimic the whole dataset, we randomly select 500 users out of 6040 total users such that 50% (250 us- ers) are selected from DataSet1, 40% (200 users) are selected from DataSet2, and 10% (50 users) are selected from DataSet3 [14].
Keeping in mind the actual users’ distribution, we subdivide the resulting dataset into 5 mutually exclusive folds, fold(1), …, fold(5), each of which having the same size, 100 users (20% of the total). Each fold mimics the whole dataset distribution where 50 users, 40 users, and 10 users are belonging to DataSet1, DataSet2, and Data- Set3, respectively. Training and testing are performed 5 times where in iteration-i, fold(i) is reserved as the test set (20%) and the remaining folds are collectively used to train the system (80%). That is in Split-1 dataset, fold (2), …, fold(5) collectively serve as the training set while fold(1) is the test users; Split-2 is trained on fold(1), fold(3), …, fold(5) and tested on fold(2); and so on [15]. Thus each fold is used the same number of times for training and once for testing. The number of total users, total training users, and total active users are M =500,
400 T
M = , and MA =100, respectively.
During the testing phase, the set of declared ratings,
a
[image:6.595.57.286.681.735.2]S , by an active user, ua, are divided randomly into two disjoint sets, namely training ratings SaTR (34%) and test ratings SaTE (66%) such that Sa =SaTRSaTE. The CRS treats SaTR as the only declared ratings while SaTE are
Table 1. The one million MovieLens dataset users’ distribu- tion.
DataSet No. of Users’ Ratings No. of Users Total Ratings (%)
DataSet1 20 - 100 3154 155,677 52
DataSet2 101 - 500 2491 550,580 41
DataSet3 >500 395 287,913 7
treated as unseen ratings that the system would attempt to predict for testing the CRS performance.
5.2. Evaluation Metrics
The performance of each CRS is evaluated using cover- age, percentage of the correct predictions (PCP), and mean absolute error (MAE) [2,17,18]. Coverage is the measure of the percentage of items for which a CRS can provide predictions. We compute the active user cover- age as the number of items for which the CRS can gener- ate predictions for that user over the total number of un- seen items. The split coverage over all active users is given by:
1
1 Coverage
A A
M p i i M
TE i i
N
S =
= =
∑
∑
(15)
Here, Nip is the total number of predicted items for user ui. The PCP of the active user [2,17,18] is the per- cent of the correctly predicted items by CRS for a given active user to the total number of items in the test ratings set of that user. The set of correctly predicted items for a given user and the split PCP over all active users are de- fined by the following formulae:
( )
{
, ,}
CorrectSet ua = s sk k∈SaTE,pra k =ra k (16)
( )
11 CorrectSet
100%
A A
M
i i
M TE i i
u PCP
S =
=
=
∑
×∑
(17)
The MAE measures the deviation of predictions gen- erated by the CRS from the true ratings specified by the active user [17,18]. The split MAE over all active users
( )
MA is given by:, ,
1 1
1 1
TE i
A S
M
i k i k
TE
i k
A i
MAE pr r
M = S =
= −
∑
∑
(18)Low coverage value indicates that the CRS will not be able to assist the user with many of the items he has not rated while lower MAE corresponds to more accurate predictions of a given CRS. Over all splits we compute PCP (coverage) by summing all correct predictions (pre- dictions) over all active users over all splits and divided it by the sum of all testing set sizes of all active users over all splits. The MAE over all splits is the average of all splits’ MAEs.
5.3. Experiments
items between the active user and any training user has to be at least five to include this training user in the neighborhood set of that active user. By this assumption we guarantee that there is an acceptable history between the two users. Otherwise the similarity between the two users may be 100% even if they have only one common item. This data is too small to draw any reliable conclu-sions about the users’ similarity. Moreover, the mislead-ing high correlations lead to neighbors that are terrible predictors for the active user.
The neighborhood set size, NSS = {10, ∙∙∙, 100} is varied from 10 to 100 by a step size of 10 each time to show the effect of NSS on the memory-based CRS per-formance. The Resnick’s prediction formula [1,2,6] is used for predictions which scales the contribution of each neighbor’s rating by his similarity to the given active user.
(
) (
)
(
)
, ,
sim ,
sim ,
y x y x
y k y x y
u N
x k x
x y
u N
r m
pr m ∈
∈
−
= +
∑
∑
u u u u
(19)
All the experiments are conducted on the 500 users’ dataset formed in Subsection 5.1. This paper implements eight experiments based on the formula used for com-paring users. The first experiment uses PCC (Formula (1)) for similarity computation and we call this CRS as Cor-relation-Based RS (CBRS). The second experiment uses
Cosine Vector similarity measure (Formula (2)) for similarity computation and we call this CRS as Cosine Vector RS (CVRS). The list of the conducted CRS ex-periments, their similarity measures, and their shortcuts are listed in Table 2.
5.4. Analysis of the Results
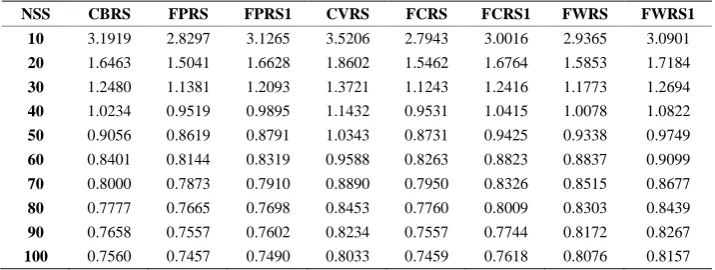
The PCP, MAE, and coverage over all active users and over all splits for all the examined memory-based CRSs are presented in Tables 3 to 5. The results of Tables 3
[image:7.595.90.257.285.329.2]and 4 show that FPRS outperforms all the examined CRSs in terms of PCP, and MAE. However, FWRS out-performs all the examined CRSs in terms of coverage as
[image:7.595.308.540.299.408.2]Table 5 shows. Both FPRS and FWRS use the rating deviation values for evolving fuzzy weights. The per-
Table 2. Different CRS experiments and their shortcuts.
Similarity Measure Fuzzy Variable Shortcut
Cosine similarity measure None CVRS Cosine similarity measure Rating deviations FCRS Cosine similarity measure Ratings FCRS1 Pearson correlation coefficient None CBRS Pearson correlation coefficient Rating deviations FPRS Pearson correlation coefficient Ratings FPRS1
Mean difference weights Rating deviations FWRS Mean difference weights Ratings FWRS1
Table 3. PCP values for the different CRSs for many neighborhood set sizes.
NSS CBRS FPRS FPRS1 CVRS FCRS FCRS1 FWRS FWRS1
10 17.077 19.240 17.169 15.364 18.949 17.809 18.554 17.477
20 24.430 26.917 25.104 22.559 26.393 24.281 26.365 24.902
30 29.612 31.476 29.928 26.967 30.852 29.338 31.349 29.473 40 32.915 35.202 34.137 30.003 34.953 33.089 34.680 32.634
50 35.967 37.764 36.874 32.316 37.132 35.227 36.366 34.892
60 37.772 38.662 38.197 33.655 38.188 36.916 37.703 36.599 70 39.203 39.993 39.137 35.161 39.128 38.247 38.578 37.977
80 40.093 40.725 40.201 36.400 39.652 39.544 39.226 38.896 90 40.692 41.133 40.626 37.681 40.393 40.626 39.615 39.440
100 41.266 41.707 41.075 38.280 41.216 41.300 40.037 39.778
Table 4. MAE values for the different CRSs for many neighborhood set sizes.
NSS CBRS FPRS FPRS1 CVRS FCRS FCRS1 FWRS FWRS1
10 3.1919 2.8297 3.1265 3.5206 2.7943 3.0016 2.9365 3.0901 20 1.6463 1.5041 1.6628 1.8602 1.5462 1.6764 1.5853 1.7184
[image:7.595.117.481.435.573.2] [image:7.595.119.477.601.736.2]Table 5. Coverage values for the different CRSs for many neighborhood set sizes.
NSS CBRS FPRS FPRS1 CVRS FCRS FCRS1 FWRS FWRS1
10 46.041 50.749 46.523 43.196 49.534 47.338 49.356 47.747 20 65.380 68.450 65.522 60.680 68.084 63.999 68.856 65.959 30 75.220 78.997 75.828 70.121 79.321 74.505 80.213 76.522 40 82.732 86.500 84.312 76.818 86.017 81.692 87.188 83.124 50 88.629 90.767 89.586 80.835 89.744 85.651 90.790 87.801 60 92.123 92.963 92.198 84.454 91.865 89.345 93.303 91.074 70 94.302 94.560 94.202 87.548 93.811 92.148 94.947 93.585 80 95.367 95.600 95.417 90.110 94.934 93.745 96.171 95.005 90 96.140 96.423 96.066 91.590 95.908 95.250 96.985 95.950 100 96.864 96.989 96.939 92.955 96.789 96.049 97.542 96.780
formance of the mean difference similarity measure [7] with fuzzy weighting is close to that of FCRS and FPRS even it does not go through a long and expensive GA learning.
Figures 3 to 8 depict PCP, MAE, and coverage results of the traditional approaches with their fuzzy weighting approaches. On the other side, Figures 6 to 8 compare different fuzzy weighting approaches for the examined memory-based CRSs. The experimental results show that CVRS performs the worst and the results indicate that all the proposed variants even poor ones outperform CVRS for all aspects and all NSSs. This is because CVRS relies directly on the raw ratings themselves. The raw ratings depend on each user’s rating scale and on his mood and taste. Thus comparing one user’s raw rating with another user’s raw ratings will not give a good indication of their similarity. This problem is alleviated somehow with CBRS which uses the rating deviation from each user’s mean of ratings instead of his direct raw ratings.
Once fuzzy weighting is introduced to CVRS, its per- formance is improved in all aspects. The improvement degree depends on the fuzzy variable used for weighting. For example, FCRS1 outperforms CVRS but not CBRS because its fuzzy variable for weighting is the user-de- pendent raw ratings. However, FCRS outperforms both CVRS and CBRS as its fuzzy variable for weighting is the rating deviations which alleviate the rating scale variations of different users.
The higher PCP and coverage values of the proposed approaches obviously illustrate that better sets of like- minded users are found and therefore the accuracy of the CRS gets enhanced. The PCP and coverage values for all CRSs increase as Nx increases for all CRSs while the MAE values decreases as Nx increases.
[image:8.595.314.535.396.532.2]MAE starts high because only a few numbers of items can get predictions. For small neighborhood set sizes, there is a big improvement for FPRS, FCRS, and FWRS in all aspects. This improvement narrows as neighbor- hood set size increases. The performances of FPRS, FCRS, and FWRS seem very close with a small advantage for FPRS. This implies that the similarity measure choice has less effect as the fuzzy weighting variable is the de- viation values.
[image:8.595.312.536.573.706.2]Figure 3. PCP of CBRS, FPRS, FPRS1, CVRS, FCRS, and FCRS1.
Figure 4. MAE of CBRS, FPRS, FPRS1, CVRS, FCRS, and FCRS1.
Figure 6. PCP of FPRS, FPRS1, FCRS, FCRS1, FWRS, and FWRS1.
Figure 7. MAE of FPRS, FPRS1, FCRS, FCRS1, FWRS, and FWRS1.
Figure 8. Coverage of FPRS, FPRS1, FCRS, FCRS1, FWRS, and FWRS1.
6. Conclusions
Different users of CRS usually give different weightings for their declared ratings. Thus many methods have been proposed for introducing weights to the similarity meas-ure. Instead of utilizing GA for small intervals which degrades the usefulness of GA such as used in [7], the proposed fuzzy weightings give easy ways to get each user fuzzy weights for different rating values and rating deviation values. This weighting is not fixed and will be changed by changing the neighbor. Moreover, the
pro-posed fuzzy weighting is efficient in terms of time and space complexities. An extra advantage of the fuzzy weighting derived from the user rating deviations is that it avoids the users’ different rating scales problem.
Experimental results show that fuzzy weighting im-proves the CRS performance irrespective of the fuzzy weighting variable where the fuzzy-weighted similarity measures outperform their traditional counterparts in terms of PCP, coverage, and mean absolute error. The fuzzy weighting performance advantage increases as we use rating deviations instead of ratings themselves. This paper maps crisp values to membership vectors to get the fuzzy weights. However, other fuzzy techniques can be used for calculating these weights. This is left for the future work.
REFERENCES
[1] J. Bobadilla, F. Ortega, A. Hernando and A. Gutiérrez, “Recommender Systems Survey,” Knowledge Based Sys-tems, Vol. 26, 2013, pp. 109-132.
http://dx.doi.org/10.1016/j.knosys.2013.03.012
[2] G. Adomavicius and A. Tuzhilin, “Toward the Next Gen-eration of Recommender Systems: A Survey of the State- of-the-art and Possible Extensions,” IEEE Transaction on
Knowledge and Data Engineering, Vol. 17, No. 6, 2005,
pp. 734-749.
http://dx.doi.org/10.1109/TKDE.2005.99
[3] D. Goldberg, D. Nichols, B. M. Oki and D. Terry, “Using Collaborative Filtering to Weave an Information Tapes-try,” Communication of the ACM, Vol. 35, No. 12, 1992, pp. 61-70.
http://dx.doi.org/10.1145/138859.138867.
[4] U. Shardanand and P. Maes, “Social Information Filtering: Algorithms for Automating ‘Word of Mouth’,” Proceed- ings of the Conference on Human Factors in Computing
Systems (CHI’95), Denver, May 1995, pp. 210-217.
http://dx.doi.org/10.1145/223904.223931
[5] B. Miller, I. Albert, S. Lam, J. Konstan and J. Riedl, “MovieLens Unplugged: Experiences with an Occasion-ally Connected Recommender System,” Proceedings of the International Conference on Intelligent User
Inter-faces, 2003.
[6] J. B. Schafer, D. Frankowski, J. Herlocker and S. Sen, “Collaborative Filtering Recommender Systems,” In: P. Brusilovsky, A. Kobsa and W. Nejdl, Eds., The Adaptive Web, LNCS 4321, Springer-Verlag, Berlin Heidelberg, 2007, pp. 291-324.
[7] J. Bobadilla, F. Ortega, A. Hernando and J. Alcala, “Im- proving Collaborative Filtering Recommender System Results and Performance Using Genetic Algorithms,”
Knowledge Based Systems, Vol. 24, No. 8, 2011, pp.
1310-1316.
http://dx.doi.org/10.1016/j.knosys.2011.06.005.
[image:9.595.65.286.433.569.2][9] K. K Bharadwaj and M. Y. H. Al-Shamri, “Fuzzy Com- putational Models for Trust and Reputation Systems,”
Electronic Commerce Research and Applications, Vol. 8,
No. 1, 2009, pp. 37-47.
http://dx.doi.org/10.1016/j.elerap.2008.08.001
[10] J. Herlocker, J. Konstan, A. Borchers and J. Riedl, “An Algorithmic Framework for Performing Collaborative Filtering,” Proceedings of the 22nd annual International ACM SIGIR Conference on Research and Development in
Information Retrieval, 1999, pp. 230-237.
http://dx.doi.org/10.1145/312624.312682.
[11] J. Breese, D. Heckerman and C. Kadie, “Empirical Anal- ysis of Predictive Algorithms for Collaborative Filtering,”
Proceedings of the 14th Conference on Uncertainty in
Artificial Intelligence, Madison, 1998, pp. 43-52.
[12] M. Y. H. Al-Shamri and K. K. Bharadwaj, “A Hybrid Preference-Based Recommender System based on Fuzzy Concordance/Discordance Principle,” Proceedings of the third Indian International Conference on Artificial
Intel-ligence (IICAI’07), Pune, 2007, pp. 301-314.
[13] M. Y. H. Al-Shamri and K. K. Bharadwaj, “Fuzzy-Gene- tic Approach to Recommender Systems Based on a Novel Hybrid User Model,” Expert Systems with Applications,
Vol. 35, No. 3, 2008, pp. 1386-1399. Http://dx.doi.org/10.1016/j.eswa.2007.08.016
[14] M. Y. H. Al-Shamri and N. H. Al-Ashwal, “Fuzzy Wei- ghted Pearson Correlation Coefficient for Collaborative Recommender System,” Proceedings of the 15th Interna- tional Conference on Enterprise Information Systems
(ICEIS13), Angers, 2013, pp. 409-414.
http://dx.doi.org/10.5220/000441240409041
[15] J. Han and M. Kamber, “Data Mining, Concepts and Techniques,” 2nd Edition, Morgan Kaufmann Publishers, 2006.
[16] http://www.movielens.umn.edu
[17] E. Vozalis and K. G. Margaritis, “Analysis of Recom- mender Systems’ Algorithms,” Proceedings of the sixth Hellenic-European Conference on Computer
Mathemat-ics and its Applications (HERCMA), Athens, 2003.
[18] J. L. Herlocker, L. A. Konstan, L. G. Terveen and J. T. Riedl, “Evaluating Collaborative Filtering Recommender Systems,” ACM Transaction on Information Systems, Vol. 22, No. 1, 2004, pp. 5-53.