machine learning methods
Muhammad Irfan Khan
School of Science
Thesis submitted for examination for the degree of Master of Science in Technology.
Espoo November 24, 2017
Supervisor
Prof. Samuel Kaski , Dr. Murugan Natarajan Arul
Advisors
Dr Pekka Martinen
Abstract of the master’s thesis
Author Muhammad Irfan Khan
Title Drug side-effect prediction using machine learning methods
Degree programme euSysBio
Major Computational Systems Biology Code of major T-61
Supervisor Prof. Samuel Kaski , Dr. Murugan Natarajan Arul
Advisors Dr Pekka Martinen, Dr Jing Tang
Date November 24, 2017 Number of pages 52+1 Language English
Abstract
Drug toxicity (or adverse side effects) is a pressing health problem which is also an impediment to the development of therapeutically effective drugs. Despite many on-going efforts to determine the toxicity beforehand, computational prediction of drug side-effects remains a challenging task.
This thesis presents an approach to predict side-effects by utilizing side-information sources for the drugs, while simultaneously comparing state-of-the-art machine learning methods to improve accuracy. Specifically, the thesis implements a data-analysis pipeline for obtaining side-information that are useful for the prediction task. This thesis then formulates the drug side-effect prediction as a machine learn-ing problem: Given disease indications and structural features (as side-information sources) of drugs, for which some measurements of effect exist, predict side-effect for a new drug.
As case studies, the prediction accuracies are compared for ten different side-effects using linear as well as non-linear machine learning methods. The thesis summarizes three key findings. First, the drug side-information sources are predictive of the side-effects. Second, non-linear methods show improved prediction accuracies as compared to their linear analogs. Third, the integration of disease indications and structural features with a principled machine learning approach further improves the drug side-effect predictions.
However, the current study limits the analysis assuming side-effects are indepen-dent. In future, modeling the joint relationships of several side-effects could yield more strong predictions and better help to understand the underlying biological mechanism.
Preface
The reported work constitutes my Master Thesis and concludes my Master Degree within the Erasmus Mundus Master program in Systems Biology (euSysBio), a joint program KTH and Aalto University.
This work has been carried out in Quantitative Systems Pharmacology group in Institute for Molecular Medicine Finland, University of Helsinki in collaboration with Probabilistic Machine Learning(PML) group in Department of Computer Science, Aalto University School of Science, Finland. This thesis has been funded by HiLIFE Research Fellow program.
I am grateful to the Erasmus Mundus program for giving me the opportunity to pursue my studies. My sincere complements to my supervisors and instructors for training me and teaching me the principles of science and for the opportunity to work in interdisciplinary field.
I am also thankful to Dr. Ammad-ud-din, Dr. Suleiman Ali Khan, Dr. Zia-ur-Rehman, Alina Malyutina, Zaid Alam, Dr. Rao Anwar, Wahaj-ud-din and Mansoor khan for there guidance, fruitful discussions and feedback.
Finally, I am indebted to my parents for their support and blessings through-out my life. I thank my parents and siblings for instilling in me the value of education.
Otaniemi, 24.11.2017
Contents
Abstract i
Preface ii
Contents iii
Symbols and abbreviations v
1 Introduction 1
1.1 Background . . . 2
1.2 Related Work . . . 3
1.3 Rationale and motivation. . . 5
1.4 Problem statement, challenge and research objectives . . . 6
1.5 Structure and organization of the thesis . . . 7
2 Research material and methods 8 2.1 Data acquisition and dataset construction . . . 8
2.1.1 Drug indications data. . . 8
2.1.2 Drug descriptors and targets . . . 8
2.1.3 Case study: Dataset statistics and Features description . . . . 8
2.2 Predictive Modelling and Experimental configuration . . . 10
2.3 Methods . . . 11
2.3.1 Naive Bayes . . . 12
2.3.2 Linear Discriminant Analysis (LDA) . . . 12
2.3.3 Linear Regression . . . 13
2.3.4 Support Vector Machines (SVM) . . . 13
2.3.5 Neural Networks . . . 14
2.3.6 Random Forest . . . 15
2.3.7 Bayesian efficient multi kernel learning (BEMKL) . . . 15
2.4 Evaluation of measures for predictive models . . . 16
3 Results and Discussion 17 3.0.1 Abdominal pain . . . 17 3.0.2 Chronic fever . . . 17 3.0.3 Dizziness . . . 17 3.0.4 Dermatitis . . . 18 3.0.5 Diarrhea . . . 18 3.0.6 Headache . . . 18 3.0.7 Rashes . . . 18 3.0.8 Nausea . . . 19 3.0.9 Vomiting . . . 19 3.0.10 Weakness . . . 19
3.1 Conclusions and Findings . . . 19
4 Supplementary Section 28
List of Figures
1 Features and target . . . 9
2 Experimental Configuration: cross validation scheme . . . 11
3 Performance measure for Side-effect : Diarrhoea . . . 23
4 Performance measure for Side-effect : Headache . . . 24
5 Performance measure for Side-effect : Dermatitis . . . 25
6 Performance measure for Side-effect : Abdominal Pain . . . 44
7 Performance measure for Side-effect : Chronic Fatigue . . . 45
8 Performance measure for Side-effect : Dizziness . . . 46
9 Performance measure for Side-effect : Headache . . . 47
10 Performance measure for Side-effect : Nausea . . . 48
11 Performance measure for Side-effect : Weakness . . . 49
12 Performance measure for Side-effect : Rashes . . . 50
13 Performance measure for Side-effect : Dermatitis . . . 51
14 Performance measure for Side-effect : Vomiting . . . 52
List of Tables
1 Summary of final dataset after preprocessing . . . 92 Sparsity of pre-processed data sources used for prediction performance 9 3 Statistic Measure for different sideeffects with different machine learn-ing models. . . 28
4 Statistical T-test for Abdominal Pain with different datasets . . . 34
5 Statistical T-test for Chronic Fatigue with different datasets . . . 35
6 Statistical T-test for Dizziness with different datasets . . . 36
7 Statistical T-test for Headache with different datasets . . . 37
8 Statistical T-test for Nausea with different datasets . . . 38
9 Statistical T-test for Weakness with different datasets . . . 39
10 Statistical T-test for Diarrhea with different datasets . . . 40
11 Statistical T-test for Rashes with different datasets . . . 41
12 Statistical T-test for Dermatitis with different datasets . . . 42
Symbols and abbreviations
Abbreviations
BEMKL Bayesian efficient multi kernel learning
SVM Support Vector Machines
LDA Linear Discriminant Analysis
LR Logistic Regression
NN Neural Networks
RF Random Forest
Drug side-effects/ adverse drug reactions (ADRs) is a crucial and complex challenge. The research community is concerned as drug toxicity is the fourth leading cause of
death in U.S alone after cancer and heart diseases (Leone et al., 2008)(Bloomquist,
n.d.). Moreover, If the drug success rate in clinical trials increases from 25 percent
to 33 percent, pharmaceutical companies can save around 200 million dollars on the drug development process and reduce one fourth of the total drug development
time (DiMasi, 2002). Effective ADRs prediction is essential for improving patients
healthcare and accelerating the drug development process.
Different computational techniques have been used in recent past in order to understand the mechanism of drug reactions. The data sources used to study side-effect in different studies include chemical data of both drugs and drug-targets. A literature review of these cutting-edge approaches is summarized in section 1.2 of this thesis. The major cause of drug side-effect is off-target reactions. The mechanism of action of drugs is influenced by the genomic heterogeneity of individuals and influencing chemical properties due to altering micro-environment in cellular compartments. Hence, side-effects "as clinical phenotypes" that arise in patients can assumed to be a manifestation of complex interaction of multitude of factors i-e genomic features, disease state in which drugs are administered called drug
indications, chemical descriptors of drugs (Schuster, Laggner, & Langer,2008).
Unlike drug chemical and structural properties, the genomic information of the patients is not available from public databases. A disease or a group of specific biological symptoms arises due to abnormal "interaction" or "cross-talk" of pathways. Drugs are usually administered to restore the normal state by triggering the cascade of reactions in perturbed pathways. Here genome plays a fundamental role in mechanizing biological reactions of these drugs; moreover, similar drugs are given for similar diseases. Therefore, this thesis considers that the drug indications (also known as drug-disease associations) are an approximation of missing genomic information from the patients.
The basic research question this thesis aims to solve is if the chemical discriptors called as fingerprints of the drugs and drug indications are an insightful information source for the drug effects. Finding out these underlying relations of drugs side-effect that arise due to this complex interaction is the motivation behind this study. In this thesis, drug indications and chemical descriptors are used as data sources to predict ten different "common" side-effects. An analysis pipeline to predict the general side-effects is developed for this research work. A straightforward comparison of seven different machine learning algorithms and their prediction performance is presented as a result. The selected side-effects are grouped together in two categories. The categories are based on which data source is more insightful for that particular side-effect prediction.
In this thesis, computational analysis is performed to find a link between biological responses of patients and chemical properties of drugs. The study is constituted on three disciplines: pharmacology, chemi-informatics and machine learning. The aim is to systematically examine the relevant publicly available data for effective
modelling of drug side-effects. Comparison of prediction performance of different machine learning models is made, while simultaneously co-behaving side-effects (similar behaviour of machine learning approaches on data type) are grouped together
in an attempt to better learn the pattern in interactions.
1.1
Background
After drug assembly, the life cycle of drug development is comprised of two major stages, pharmacokinetics and pharmacodynamics. Pharmacokinetics can be divided in many levels as absorption and assimilation (what is the intake route for drug for maximum affect), distribution (how is the drug molecule transfered in biological system i-e cell), metabolism (what is the mechanism of action adopted by the drug and how is it processed in the biological system) and elimination (how it is excreted out of the system). Drugs can be administered through different routes including ingestion, intravenous or intramuscular uptake. Drugs are chemical entities which interact with biomolecules to trigger a reaction which leads to an altered cellular state. Drugs can interact with targeted biomolecules of interest or unintended off-target biomolecules as well which can cause undesired affects on subjected patients. These undesired adverse affects are often classified as drug side-effects, toxicological properties of drugs or Adverse drug reactions (ADR) profiles of pharmaceutical agents.
Drug side effect studies are a part of pharmacodynamics i-e the impact of con-centration of drug substance on various organs of the body over a monitored course of time. Studies of side effects of drugs are significant because drugs which are
cytotoxic can be rather harmful than beneficial to the patients. (Kola & Landis,
2004). Ultimately, clinical safety is the standard and the most stringent checkpoint
for all drugs to be approved by Food and Drug Administration (FDA). Practically, successful clinical trial is the most significant step in life cycle of drugs development which contributes to translational medicine. Safety and efficacy of drugs and vaccines is the main mission statement of pharmacology industry and benefactor to improved healthcare system in general.
Doctors and clinicians recommend the drugs which have minimum reported side-effects by patients. Pharma Industry (R&D) continuously investigates and
work towards designing and bettering the therapies.(Terstappen & Reggiani, 2001).
Demand for the new and improved, effective and efficient drugs are always on the high, but the side-effects caused often due to off-target effects of the drugs is a major problem in medicinal science. Traditionally, side-effects of drugs have been observed and recorded in pre-clinical trials on different animal models (i-e lab rats, chimpanzees or volunteers). Moreover, results from animal models are not generalizable across
species (Bracken, 2009) .
Besides, there is high risk of harmful toxic effects which could be far-reaching (potentially fatal in some cases) and injurious to health of volunteers undergoing investigational therapy if testing drug is of addictive nature as well. This practice is hazardous and the overall process is time-consuming. If the drug success rate in clinical trials increases from 25 percent to 33 percent, pharmaceutical companies can
save around 200 million dollars on the drug development process and reduce one
fourth of the total drug development time (DiMasi,2002).
Higher efficacy of drugs lead to better treatment plans which can be ensured if the sideeffects of the drugs can be prevented. In order to ensure prevention of side-effects, prediction of the side-effects from available multiple different data sources is required. Recent technological advances has enabled the integration of clinical observation and molecular biology data. It is a relatively new approach and it is called Systems Pharmacology, and there are very limited studies for prediction of side-effects of
drugs using experimental drugs data (Huang, Wu, & Chen, 2011). With increasing
computational processing power and robust machine learning models, it is possible to predict the side-effects of the putative drugs and accelerate the development of
drug-design process at large (Ma et al.,2008) (T.-B. Ho, Le, Thai, & Taewijit,2016).
To understand the impact of drugs (chemical entities) on patients is an important task in medical science. Predicting adverse effects of drugs is valuable for improving drug design and targeted therapies as this is the most basic screening method for
drug design.(Chiang & Butte,2009) The economic damage caused by drug-side-effect
problem is highlighted by the fact that approximately 30 percent drugs do not proceed beyond trial phase in clinics due to adverse side-effect and drug efficacy
(J. Zhang, 2012). In United States, estimated 100,000 deaths are caused annually
because of drugs side-effects which is 5 percent of the affected number of people in U.S. Drug-side-effects is a menace and it affects 6 percent of hospitalized patients.
(Jahid & Ruan,2013)
The application spectrum of studying side-effects spans concepts like combination therapies and drug repositioning. In complex cases like cancer where combination therapies are required, the drug-drug interaction has shown to cause more damage than good due to un-wanted adverse affects. Combination therapies administration for synergistic affect is failing because of lack of understanding of why side effects arise and how to limit them. There are multitude of potential reasons like unintended cascade of cross-talk between biomarkers in signaling pathways leading to unwanted
reactions(Brechbiel, Miller-Moslin, & Adjei,2014). Moreover, with the possibility of
rapid estimation of in-silico drug side-effect through prediction modelling medium,
the promising goal of drug-repositioning/drug-repurposing is also achievable (Yang
& Agarwal, 2011). The idea of drug-repositioning is to maximize the use of already
approved profiled drugs proven to be highly effective for some strata of patients could be recommended for a different and previously untested set of indications.
1.2
Related Work
Public health forums echo tension and highlights that there is an imminent
require-ment of research in this exciting era of modern medicine (Chee, Berlin, & Schatz,
2011). The concept of precision medicine is to find most suitable highest efficacy
therapies for patients with minimal side-effects. As field of translational bioinfor-matics is rapidly advancing, it is possible to perform novel insilico drug-discoveries
(Butte, 2008) Side-effects prediction of drugs is a critical and crucial step towards
prediction have used machine learning approaches (W. Zhang, Liu, Luo, & Zhang,
2015)(T.-B. Ho et al., 2016).
In this section, computational approaches which have been used for identifying drug side-effects are reviewed. Following summaries of previous approaches spans from cluster analysis, supervised deep learning strategy, factor analysis, causality analysis, network analysis and genome wide association studies (GWAS),enrichment analysis for result validations and data-mining approach. The data sources used to study side-effect in different studies include chemogenomic data of both drugs and drug-targets.
One recent advancement is DrugClust tool (Dimitri & Lió, 2017). It is an R
package and uses machine learning to predict side-effects. There are two main steps in the analysis pipeline, cluster analysis followed by enrichment analysis. The data analysis pipeline first groups the drugs on the basis of similar features. Bayesian priors are assumed while doing this cluster analysis. As a second step enrichment analysis is performed for the clusters to extract a more biological interpretation of the clusters formed. The pathway enrichment analysis helps to investigate the interaction between drug clusters with complementary profiles, complementary profiles means that drugs which interact with similar drug-targets and interact with similar biological pathways and cause similar side-effects. Rand Index is a metric which is used to find the statistical significance of the clusters. The prediction performance has been shown on various publicly available datasets.
Bresso et al used an integrative approach to explain drugs side-effects. The data was acquired from Drugbank and SIDER database. Clustering of the similar drugs is performed by combining the drug targets descriptors and drugs fingerprints. Comparison of two machine learning methods i-e decision trees and inductive-logic programming shows that the later outperformed both in performance and to further
explicate the functional association in pathways of drug targets and drugs. (Bresso
et al.,2013)
An interesting approach to consider side-effect as penalty scores for the drugs
to rank the drugs was adopted by Niu et al. After randomly generating scores
in simulation experiments the average scores were used to rank the drugs. Three different data sources were compiled together for the study i-e drug targets, chemical descriptors of drugs and the treatment indications of the drugs. Ensemble machine learning models were used to assign different weights to drugs on the basis of different side-effects associated with the drugs, there intended targets and treatment
indications. (Niu & Zhang, 2017) Awarding scores is an idea associated with gaming
industry, used in this project to elaborate significant linkups between drug-diseases associations, drug and drug-side effects commonly caused by the medications used for treatment and it can aid researchers in pharmaceutical companies to generate hypotheses for drug discovery.
A link between pharmacogenomics and side-effects has been shown by isolating 244 pharmacogenes which are associated with side-effects of 176 drugs from PharmGKB database. 28 genes are identified by FDA which are associated with risk of
side-effects. (Zhou et al.,2015) Another novel deep learning methodology for genome wide
response in patients was conducted byLiang et al. This supervised deep learning methodology uses single nucleotide polymorphisms (SNPs), pharmacokinetic data and side-effects data. This model in particular classifies single nucleotide polymorphism (SNP) with adverse reactions. This model makes use of stochastic networks that rely on markov chains as step functions. This strategy outperformed baseline models like
lasso regression and k-Nearest neighbour method. (Liang, Huang, Zeng, & Zhang,
2016)
Causality analysis model based on structure learning (CASTLE) tool uses both chemical and biological properties of drugs to determine molecular predictors of side-effects. Prediction performance was evaluated on 12 organ-specific ADRs on 830 drugs data. The analysis pipeline has three steps involved feature extraction, classification of ADRs using Support vector machines (SVM), enrichment analysis was performed for validation and compared with OMIM database results. Although the prediction performance was promising but there was only partial validation from enrichment analysis with OMIM database stands for mandelian inheritance traits in man and contains information related to mendelian disorders and over 15,000 genes.
(Liu et al., 2014)
Another systematic prediction of ADRs was performed using factor analysis performed on 832 drugs. The data set is composed of 173 pathways and 1385 side-effects, 30 highly correlated sets of drugs, pathways and ADRs were identified as a result. The method used was canonical correlation analysis (CCA) which captures the co-variance between the predictive features and models the variation within the features as noise. This study is significant as the correlation between ADRs is significant from biological standpoint and this strategy lays the foundations for latent low dimentional representation of the chemogenomic data sources which could lead to better inferences and better understanding of the mechanisms that cause drug
side-effects to appear in patients. (Zheng et al., 2014).
A large scale network analysis performed on side-effects and biological pathways required pathway data, target data and phenotypic data. Corelations between side-effects and associations between the biological pathways was the outcome of this
study. (Scheiber et al., 2009). Data-mining approach has also been used to assist
in pharmacovogilance as well.(Hauben, Horn, & Reich, 2007). Pharmacovigilance
is the feedback drug surveillance from consumers to study and record the reported side-effects caused by medicines.
1.3
Rationale and motivation
The seriousness of this medical issue is reiterated by statistical figures pointing towards the fact that patients ailment is prolonged due to ADRs. Studies indicate
that there is an average two day increase in hospitalization due to ADRs (Eichelbaum,
Ingelman-Sundberg, & Evans, 2006). The risk of hospitalization due to ADRs in
even higher in elderly patients aged greater than 75 years. (Ruiter et al., 2012).
This increase in hospitalization time means more resources consumption by one patient overall, when the same healthcare budget could be utilized by other crucial patients in need. Another alarming fact is that drug-related mortality rate in U.S
alone is 4th, after cancer and heart problems.(Leone et al., 2008). The repercussions for investing in solving this complex medicine problem can have epic impact on "community medicine" and resource reservation in terms of both time and money.
Side-effects are a result of different off-target drug reactions. The mechanism of action of drugs is also influenced by the genomic heterogeneity of individuals and influencing chemical properties due to altering micro-environment in cellular compartments. Hence, side-effects (clinical phenotype) that arise in patients can assumed to be a manifestation of complex interaction of genomic features, chemical
descriptors of drugs, drug-targets associated indications (Schuster et al., 2008).
Finding out these underlying mechanisms of drugs side-effect that arise due to this complex interaction is the motivation behind this study.
1.4
Problem statement, challenge and research objectives
It is essential to establish an analysis pipeline to computationally predict drug side-effects from multiple diverse sources. The challenge in this study is that direct genetic information from the patients not accessible from public data repositories. Therefore, a fundamental assumption in this study is that drug indications are an approximation of missing genetic information from the patients. The basic research question this thesis aims to solve is if the chemical discriptors called as fingerprints of the drugs and drug indications are an insightful information source for the drug common side-effects reported with the drugs. The focus of the thesis is to classify ADRs associated with drug indications and chemical descriptors. ADRs caused due to other mechanisms are beyond the scope of this thesis. The research questions can be enlisted as following
• If the data sources selected are insightful for drug side-effect prediction or
not. If so then which data source is more insightful information source for the classification of a particular side-effect.
• Which machine learning method can predict the side-effects using the data
sources i-e best predictive model selection and assessment.
• How can side-effects be grouped together on the basis of there informative data
source.
The data sources used to predict the side-effects are the known drug-disease associations and fingerprints/ chemical descriptors of the drugs. Ten different but common side-effects which were used for this study are namely Headache, Dizziness, Weakness, Abdominal Pain, Nausea, Chronic Fatigue, Diarrhea, Rashes, Dermatitis, Vomiting. These side-effects with highest variance were selected for this study. Precisely, data from therapeutic indications of drugs along with their chemical properties (chemical descriptors) are used to predict clinical phenotypes (side-effect) of drugs.
1.5
Structure and organization of the thesis
After presenting relevant background on the ADRs, Chapter 1 presented the challenges, basic assumptions and the research questions that this study aims to solve. Chapter 2 presents computational methods and data sources information used to predict side-effects, the data analysis pipeline and the cross-validation scheme. we learn multiple classifiers for the same data set with different views to model single ADRs, Chapter 3 presents the results section and Chapter 4 concludes the thesis with discussion, analysis and suggests directions for further research. Finally, we interpret prediction results and summarize all works in this thesis.
2
Research material and methods
The data sources used to predict the side-effects are the known drug-disease associa-tions and fingerprints/ chemical descriptors of the drugs. Ten different but common side-effects which were used for this study are namely Headache, Dizziness, Weakness, Abdominal Pain, Nausea, Chronic Fatigue, Diarrhea, Rashes, Dermatitis, Vomiting. These side-effects with highest variance were selected for this study. Precisely, data from therapeutic indications of drugs along with their chemical properties (chemical descriptors) are used to predict clinical phenotypes (side-effect) of drugs.
2.1
Data acquisition and dataset construction
Data was collected from public data repositories CHEMBL and SIDER. These databases are freely accessible bioinformatics resource of information. ChEMBL is a bioactivity database which contains information that ranges from drug indications,
Targets,e-t-c (Gaulton et al., 2011). SIDER is a public database that contains
side-effects of drugs which include side effect frequency, drug side effect classifications
and drug–target relations (Kuhn, Letunic, Jensen, & Bork, 2015).
2.1.1 Drug indications data
Drug-Disease relationship is known as drug indications. This drug-disease connec-tivity map data is retrieved from CHEMBL 22 database with MeSH ids (Medical Subject Headings (MeSH) vocabulary).
2.1.2 Drug descriptors and targets
The 2D fingerprints represent the structural properties of drugs like number of bonds and atoms (non-H atoms and rotatable bonds), functional groups, C-chains, Ring structure and size. MACCS fingerprints are one of the conventional examples of 2D fingerprints that represent drugs with a set of 166 fragments. These descriptors are used for investigating bio-activity of drugs.
2.1.3 Case study: Dataset statistics and Features description
Following dataset statistics summarize the constructed dataset for analysis. 2634 unique Drugs (CHEMBL compound Ids) were retrieved from CHEMBL along with 412 drug-target ids (tids), ATC codes. ID Cross-references with other databases namely STITCH database, PubChem database, Drugbank database are also retrieved using AWK and bash scripting.
For the number of features, there are 725 mesh ids (drug indications) and 166 ”MACCS” fingerprints calculated from the SMARTS codes retrieved from the CHEMBL 22 database and calculated using rcdk R package.
From the 1434 marketed drugs available, 2966 side-effects were retrieved from SIDER 4 with Medra Ids. which is a quantitative measurement recorded as side-effect frequency from 30 patients with recorded medical history. Overall side effect data
has in total 97.5 percent data as 0, .1 percent of data is 1 and 2.3 percent of the data matrix contains continuous values within 0 and 1. However, the final dataset that was used after preprocessing were complete cases with available side-effects is summarized in Table 1.
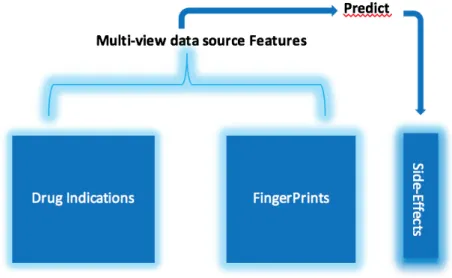
Figure 1: Features and target
Table 1: Summary of final dataset after preprocessing
No. of Drugs Drug indications fingerprints No. of sideeffects
667 725 166 10
Drug indications predictors with zero standard deviation in column were removed, this reduced the dimensionality to 652 from 725. 10 side-effects which showed maximum variance across the drugs were selected for this prediction task and analysis. The predictors are all binary data but the target variable is a continuous data which ranges between 0 and 1. I have converted the quantitative data as the observations greater than 0.5 to 1 and lesser than 0.5 as 0. The sparsity of the final dataset used in the analysis has is summarized in Table 2.
Table 2: Sparsity of pre-processed data sources used for prediction performance
Drug indications fingerprints No. of side-effects
2.2
Predictive Modelling and Experimental configuration
For the formulation of predictive models, the input to machine learning algorithms are feature vectors composed of drug indications and chemical fingerprints of drugs. Side-effect prediction task was effectively modelled as a binary classification problem where each drug was considered to either cause a particular side-effect (labelled
1) or not (labelled 0). As the side-effect data was in quantitative measure, a
data preprocessing strategy is adopted, weak signals (<0.5) converted to 0 and stronger signals (>0.5) converted to 1. For biological drug-indications data and chemical descriptors (fingerprints) data, a total of 891 combined features were used for prediction of 10 general ADRs, a total of 7 predictive classifier linear and non-linear models were used.
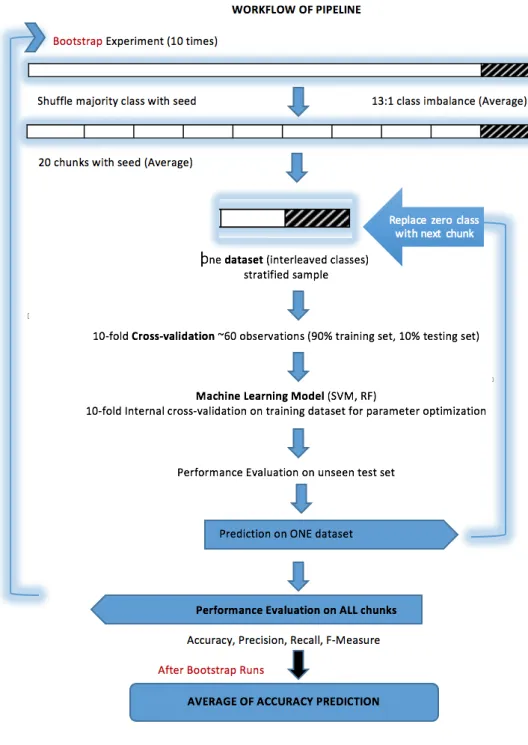
In a 10 crossfold validation setup, with a 90/10 split only 10% of drugs are used to evaluate a classifier. The experimental setup ensures bootstrapping with 10 runs ensures each drug is tested. Balanced training set was ensured by interleaving the two classes in equal ratio as illustrated in the pipeline with 10-fold cross validation setup used in the present study.
Class imbalance problem arise after converting the weak signals to 0 and strong signals to 1. The negative class cases were 13 : 1. The majority class was divided into twenty different chunks. Each majority class chunk becomes roughly equivalent of the much smaller positive class of interest. An approximate twenty different datasets were used as training samples for each of the ten bootstrap runs to evaluate the prediction performance of the classifier. One dataset was further sliced into 90:10 ratio of training set and test set to ensure unbiased prediction performance and to avoid over-fitting. Furthermore, a ten cross internal cross-validation was performed for the hyper-parameter optimization for different models. Collinearity was not explicitly removed as most models handle collinearity in features except Linear Discriminant Analysis. Finally, after all the 20 datasets for all bootstrap runs of the experiment. An average of the accuracy metric is evaluated. This is a robust analysis pipeline to evaluate the prediction performance of the classifiers. The analysis pipeline is also depicted in the fig 2.
A performance evaluation comparison for 7 different classifiers is the summarized in results section. Random assignment of classes to drugs is used as a baseline. The models include Naive Beyes, Linear Discriminatory Analysis, Support Vector machines, Logistic regression with lasso setting, Neural networks, Random Forest, Bayesian Efficient Multi-view method. For the comparison of machine learning models, three different kernels were implemented in SVM and BEMKL as jaccard, radial and linear kernels.
Figure 2: Experimental Configuration: cross validation scheme
2.3
Methods
2.3.1 Naive Bayes
It is a supervised machine learning algorithm. Based on bayes theorem, with a basic assumption that the features are independent of one another. The covariance in features is not considered, hence the dimensionality of features does not affect the performance as each feature is considered to have independent distribution.
(H. Zhang, 2004)
P(y|x1, ....xn) =P(y)
P(x1, ....xn|y) P(x1, ....xn)
(1)
y represents the side-effect classP(y= 0/1) and x represents the features including
either drug indications or drug fingerprints or both in case of combined views. The assumption is
P(xi|y, x1, ..., xi−1, xi+1, ..., xn) = P(xi|y) (2)
For all the features represented by i,
P(y|x1, ....xn) =
P(y) ∏n
i=1P(xi)|y) P(x1, ..., xn)
(3) As P(x1, ....xn) is a constant, the classification rule is used
P(y|x1, ....xn)∝P(y) n ∏ i=1 P(xi)|y) (4) ˆ y= arg maxyP(y) n ∏ i=1 P(xi)|y) (5)
Maximum A Posteriori (MAP) estimates the side-effect class y. P(y) is the prior
probability of class that side-effect belongs to in the training set.
Despite the simple assumption, Naive bayes classifiers are used in practical applications. Parameter estimation requires less amount of training data. Naive bayes is a fast learner in comparison to advanced methods.
2.3.2 Linear Discriminant Analysis (LDA)
Linear Discriminant Analysis is a machine learning approach that finds linear combina-tion of features that distinguishes two or more classes. The fundamental assumpcombina-tion of LDA is that independent variables are normally distributed. LDA models the difference between the two classes. The classification rule depends on the means of all features (drug indications data or fingerprints data), so result is affected by outliers in the data.
Mean and covariance are unknown and are estimated from training data. consider
x drug sample observations from training set and for each sample y as the side-effect
known class either 1 or 0. In a binary class prediction problem, LDA assumes the
conditional probability density functionsP(x|y= 0) and P(x|y= 1) are normally
assumption by LDA is the identical class covariance for both positive class and
negative class, called as homoscedasticity. (Σ0 = Σ1 = Σ) (Martínez & Kak, 2001).
2.3.3 Linear Regression
For linear regression, considerχϵRn∗p , the matrix of drug indications or fingerprints
data andyϵRn∗1, the vector of side-effect. n denotes the independent and identically
distributed number of observations (667 drug samples) andp represents the number
of features. (chemical descriptors/drug indications).
Linear regression assumes that side-effect y is a resultant combination of unknown
weight vector wϵR1∗p.
y=χwT+ϵ (6)
Noise ϵ exists in χ (error term in features space). Learning the weights w in
feature matrix is the main goal in machine learning. With wlearned, it is possible
to narrow down important feature selection. Significant features provide significant biological insights in our data. Moreover, classification of side-effect is also possible. In ”small n, large p” problems over-fitting on training data should be avoided to make improved inference as well. A workaround is to put penalty on weights and
reduce the size of w. the penalty system is called regularizing the cost function. we
used lasso setting which means alpha was chosen as 1.
However, in order to predict discrete classes, logistic regression is used. Binary logistic regression for side-effect prediction is a simplistic classification problem to learn a function of the form in order to model dichotomous class.
P(y= 1|x) =hθ(x) = 1 1 +exp(−θTx) ≡σ(θ Tx) (7) P(y = 0|x) = 1−P(y= 1|x) = 1−hθ(x) (8) The functionσ(z)≡ 1
1 +exp(−z) is called sigmoid/logistic function. It converts
the value θTx in the range of 0 and 1. so that we can predict the probability of
class of side-effect. The aim is to estimate the value of theta so that the probability
P(y = 1|x) = hθ(x) is high when the x (whether drug indications / fingerprints)
belong to class 1 of side-effect and vice-versa. In summary, if the probability of class
1 i-eP(y= 1|x)> P(y = 0|x) then the side-effect class is predicted as class 1 and
opposite otherwise (Cox,1958).
2.3.4 Support Vector Machines (SVM)
Support vector machines is a maximum margin classifier. SVM can be applied for both linear class boundries and non-linear class boundaries, based on the type of kernel function invoked in the classifier. In a binary class setting, SVM is widely used for the classic binary classification problems because it has several advantages. SVM is a popular technique that efficiently handles large training sets. SVM is a discriminative classifier, the algorithm finds optimal hyperplane that separates
the positive instances from negative class instances and assigns maximal distance between the two classes. This is the case of the linear classification problem, however, in addition, kernel methods are available which transform non-linear space into linear ones for non-linear classification. kernels defines a similarity measure between two data points of drug observations and relative positions of the inputs in the feature space (drug indications / fingerprints).
Following equation represent the decision function.
f(x) = wTκ+b (9)
w represents weights which are supposed to be learned for the samples, κ is the
kernel (similarity measure in samples) and b is the error term. Default parameters
were used for radial and jaccard kernel (James, Witten, Hastie, & Tibshirani,2013).
Both linear and non-linear kernel methods are used to attempt to capture the significant signals in the data. Kernel functions are widely used to sequester signals in the data. If there is non-linearity in data then non-linear methods outperform the linear methods and vice versa. An implementation of Support Vector Machines
(SVM), available from e1071 R package and libsvm were used in this study.
2.3.5 Neural Networks
Neural Networks design is an adaptation of cerebral cortex model in simpler scale. Intuitively, the architecture of neural networks can be envisioned in terms of layers of connected nodes. There is an activation function associated with the layers to trigger the successive layers activation. The input layer is the first layer which represents the features (drug indications / fingerprints) and output layer is the class of side-effect to be predicted. The actual processing to assign weights to features and learn the signals are done by the activation function associated with the hidden layers. Back propagation is a widely used standard rule to assign weights to the features. Backpropagation rule used delta function. However, there are limitations
to the model as it is slower to train (Caudill, 1989). The architectural composition
selected for a problem is an arbitrary choice for the modeller to motivate the structure based on the problem. The internal working is such that the activation of one layer determines the activation of the following layer. The analogy is assumed to be an approximation of the biological networks of the neurons. A pattern of activation from the input layer related to features causes activation of pattern of internal nodes in the hidden layers, this stepwise trigger of activation in successive hidden layers in the architecture adopted ultimately leads to the output layer and the classification
of side-effects classP(y= 0/1) is made.
As there are two internal layers. In the first internal layer there are 30 nodes which implies that there are "n" number of features number which are connections from each input node to the first hidden layer. Every neuron in 1st hidden layer is connected to the feature input neuron with weights associated with them and a bias value to complete the sigmoid activation function. The sigmoid activation function is equivalent to the number of features * 30 weights and 30 bias value. In a combined view if we have 891 features in total, then 891 *30 + 30 *10 + 10 *2 total weights
and 30 + 10 + 2 total biases. 27050 weights and 42 bias in total. Finding the right weights and bias is the main task in machine learning. The architecture adopted for Neural Networks had two-hidden layers with 30 nodes in first layer and 10 in second inner hidden layer. As neural network is a hit-and-trial method the rationale for the selection of this architecture is the range of number of features as square-root of the total number of features in case of random forest.
2.3.6 Random Forest
Random forest is a supervised ensemble learning method. Working principle of a ensemble learning method is that a combination of weak learner are combined to make strong learners. Random forest builds numerous decision trees during training. Decision tree uses tree structure as it beaks down the dataset into smaller subsets. Hence, random forest is made by using and combining many decision tree models. Random Forest can be used for both classification and regression. Random forest handles over-fitting problem and handles the missing values problems as well
(T. K. Ho, 1995). The generalization error depends on individual trees strength and
correlation between them (Breiman, 2001). Random forest are widely used
state-of-the-art non-linear methods for prediction analysis. Based on random selection of samples and features, random forest makes variety of trees. Prediction of new samples are made by averaging the predictions of different trees. A decision tree is built using the whole dataset whereas in a random forest only a pre-set fraction of features are randomly chosen with a different feature at the root node in each decision tree and particular number of features are used for training and decision trees are build. A number of decision trees are built to result an outcome. Random forest at the end compiles the results of all the decision trees to predict the final outcome i-e classification of side-effect.
2.3.7 Bayesian efficient multi kernel learning (BEMKL)
Bayesian efficient multi-kernel method was designed to integrate multiple views of information sources in a systematic way. This systematic integration leads to higher prediction performance. BEMKL is a sophisticated machine learning method developed recently to handle joint modelling biological data and it has been used to
show improved drug sensitivity prediction (Costello et al., 2014).
BEMKL is unification of four modelling strategies multiview learning, tasking learning, kernelized regression and Bayesian inference. However, multi-tasking is not invoked in this research. Input data (Drug indications/fingerprints) is represented by kernels. BEMKL has two-steps, firstly dimensionality reduction step is performed. In case of "small n large p" problems, the number of features becomes equal to number of samples. In second step the output is estimated from the kernel weights. The kernelized regression controls overfitting in "small n large p" problems. BEMKL gives as additive advantage to capture non-linearity from different sources of data. Moreover, the dimensionality reduction means that the feature space is reduced to the number of samples.
Integration of different data sources is the in a single model is also a plus point in BEMKL. Data fusion causes more insight into the data sources and better prediction performance is ensured. This systematic integration is absent in previous less sophisticated models. BEMKL learns kernel weights to find similarity measures in drugs. kernel weights highlight the significance of each data source in order
to predict the drug side-effects (Gonen, 2012). Furthermore, default settings for
hyper-parameters were utilized.
2.4
Evaluation of measures for predictive models
A total of 7 machine learning models were generated for 10 general adverse drug reactions, which were evaluated using multiple statistical measures as accuracy, precision, recall and F-measure. Accuracy is the quality ratio of correctly identified instances both positive and negative (TP+TN/(TP+TN+FP+FN)). Precision (P) is the only a fraction of correctly recognized positives cases of all the predicted positives cases (P=TP/(TP+FP)). True positive rate (TPR=TP/(TP+FN)) rep-resents correctly identified positives which is also called recall while false positive rate(FPR=FP/(FP+TN)) represents correctly identified negatives. F-measure is the mean of precision and recall. The performance for the 7 models for 10 general ADRs was calculated for the given datasets summarized in the Table 3. For statistical significance of the results, t-test is performed to find the p value. The t score is a ratio between the difference between two groups and the difference within the groups. large t-score implies that the groups are different and vice versa. p-value (probability that the results came by chance) range from 0 percent to 100 percent represented by decimals. The lower the p-values the better it is, indicating that results from data did not occur by chance. The p values are adjusted using bonferoni adjustment, which is the most stringent method to adjust the p values. Bonferoni correction os
3
Results and Discussion
Using the skeletal prototype of the data analysis pipeline and algorithms used for modelling which is outlined in aforementioned section, this study addresses the research questions of this thesis. One of the concrete deductions from the study is that both drug indications and chemical descriptors of drugs called fingerprints are indeed informative sources in the prediction of drug side-effects. This validation is the result of the comparison of predictive performance of machine learning methods, most of which are better than random classifiers in most of the drug side-effects prediction as illustrated in Table 3. Analysis of different side-effects is discussed below in this section. The prediction performance plots are in the supplementary section. For statistical significance the t-test comparison of machine learning methods is summarized in Table 4-13 of supplementary section.
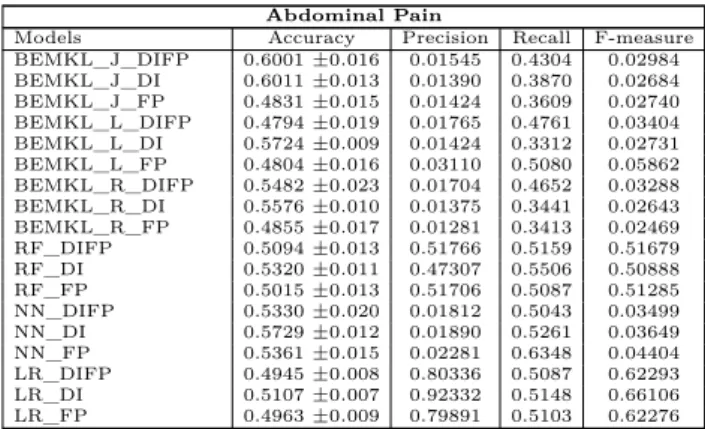
3.0.1 Abdominal pain
In case of Abdominal pain, as indicated in Table 3 in supplementary section, 60.10 accuracy for BEMKL with jaccard kernel outperforms all the models with both single view of drug indications and combined views of fingerprints and drug indications. BEMKL with linear kernel along with neural networks are the second best with 57 percent prediction performance. Table 4 indicates the statistical significance for test results for abdominal pain. T-test suggests that if the p value is less than 0.5 then the tests are significant and indicates that the method with the lesser value has higher accuracy than the other.
3.0.2 Chronic fever
In case of Chronic fever, BEMKL with jaccard kernel outperformed the other classifiers with prediction accuracy of 58.5 followed by support vector machines with jaccard kernel with 55 percent accuracy measure. All other methods performed poorly with combined views as compared to single view drug indications data. Fingerprints data was consistently poor contributor to the prediction performance of all methods. NN (with fingerprints) performed even poorly than random classification which indicates that fingerprints other than MACCS can also be explored for there insightfulness.
3.0.3 Dizziness
In case of Dizziness, BEMKL (Jaccard kernel) outperformed all methods with 60 percent accuracy using only drug indications data. All the methods consistently performed better using only drug indications data as compared to other two data sets of combnined views and single view of fingerprints. All methods performed poorly with fingerprints data due to which the combined view was also less informative. Methods BEMKL (J), BEMKL (R), BEMKL (L) and SVM (L) showed poor performance using only fingerprints data. Dizziness is a psychological condition which can occur because of multiple factors. It is difficult to directly associate it with the chemical
structure of drugs which could be one probable reason for the poor performance for less predictive signal in the fingerprint data source.
3.0.4 Dermatitis
In case of the dermatitis as shown in fig 5 in results section, prediction performance of BEMKL (Jaccard kernel) and random Forest is almost similar with approximately 62 percent with both combined views of fingerprints data and drug indications. Overall most of the methods performed better using the fingerprints data. All the other used methods have less than 60 percent prediction accuracy as indicated in the accuracy table. Table 12 also indicates that the results both in case of BEMKL(J) and Random forest are statistically significant.
3.0.5 Diarrhea
In case of diarrhea, combined views are overall more insightful and better prediction has resulted from systematic combination of the datasets. All the methods have shown better prediction using the combined views. BEMKL (J) has outperformed all other methods using combined views with more than 65 percent prediction performance Table 3 in supplementary table. Three methods BEMKL(Radial kernel), neural networks and support vector machines using radial kernel (SVM(R)) performed approximately equally well after BEMKL(J), Poor accuracy measures resulted by using fingerprints data.
3.0.6 Headache
In case of headache, the prediction performance of most of the algorithms had higher prediction accuracy with drug indications data. BEMKL (J) outperformed all other methods using combined views with 71 prediction accuracy. However, the prediction accuracy of BEMKL(J) using only drug indications was also high, approximately 70 percent, but around 56 percent using only fingerprints data. The prediction performance of BEMKL (radial kernel) was also quite high around 65 percent using combined views. Fingerprints data was consistent poor contributor in performance accuracy for all the methods and assumed to be less insightful as well. Furthermore, As a single view experiment, excluding BEMKL for all other methods drug indications were more informative and more insightful as illustrated in Fig 4.
3.0.7 Rashes
In case of Rashes, all methods have given better prediction performance using combined views except SVM (radial kernel) and Naïve bayes. All methods performed poorly using only drug indications data except BEMKL (linear kernel) and SVM (linear kernel). Overall, Neural networks with approximately 62 percent prediction performance has outperformed all other methods using combined views closely followed by BEMKL (J) using combined views.
3.0.8 Nausea
In case of Nausea, all methods have performed consistently well using single view of drug indications. All methods have performed consistently poor with fingerprints data. All methods have performed almost equally only in case of SVM (Jaccard kernel) using all the three data sources separately with approximately 52 percent prediction performance. SVM(L), SVM(R), Naïve bayes have performed worse than random classifier using only fingerprint data. The prediction performance of BEMKL (jaccard kernel, radial kernel and linear kernel) and random forest show prediction performance of 50 percent using only fingerprint data. Neural network show worst performance than random forest using fingerprint data with approximately 47 percent accuracy measure. Logistic regression show worst performance with all different datasets i-e combined views and single views separately. Fingerprints data is chemical descriptor data so it is difficult to associate it with psychological conditions.
3.0.9 Vomiting
In case of vomiting as shown in fig 14 in supplementary section, Overall, BEMKL (J) outperformed all other methods closely followed by BEMKL (R) using all datasets with prediction accuracy of around 58 percent. Although the prediction accuracy were different but BEMKL (R) and SVM (R) showed similarity in that they both had approximately same prediction accuracy for thee three datasets used for classification. Neural network showed odd behavior, performed particularly well with fingerprints data with approx 57 percent prediction prediction accuracy but performed worst in case of drug indications with approx 45 prediction accuracy.
3.0.10 Weakness
In case of weakness, BEMKL (Jaccard kernel) outperformed all other methods with combined views closely followed by BEMKL (radial kernel). In single view case, all methods performed better using drug indications data. In neural networks, SVM (L), SVM (R), LDA performed poorer than random classifier using the combined views because the models can not systematically sequester the signal and noise separately from the data sources.
3.1
Conclusions and Findings
In ”small n, large p” problems, concatenating data sources is a useful modelling technique. Joint learning of signal across multiple data sources provides more statistical strength. An essential assumption is that the combination of multiple data sources yields more relevant information and extracts the structure of signal from the data, which is critical for this drug side-effect prediction task. In this study, 8/10 side-effects cases, BEMKL (using Jaccard kernel) when jointly modelling the combined sources of drug indications and fingerprints has outperformed all the other methods whereas in other two (Nausea and Dizziness), BEMKL (Jaccard kernel) while jointly modelling the two different data sources is quite close to the best
prediction performance. This implies that additional information is useful than single information sources. It is an established fact that combined views represent more
information which suggests that they could be more insightful. (Kuang et al., 2014)
as illustrated in prediction of side-effect : diarrhea fig 3. This is a proof of concept that systematically integrating data from multiple sources yields higher prediction accuracy. Moreover, bayesian methods with jaccard kernel suits the binary data.
One of the important conclusions drawn from this study is that non-linear methods like BEMKL, neural networks and random forest has consistently outperformed the linear methods to predict the side-effects. This indicates that non-linearity is observed in data. In most of the biological problems non-linearity is normally observed in the data, hence this is also a proof of concept which hold true in this study. The accuracy measures are summarized in the Table 3 in supplementary section. For statistical significance the t-test comparison of machine learning methods is summarized in table 4-13 of supplementary section.
In order to find which data source is more insightful information source for the classification of a particular side-effect and which model can predict side-effects caused by drugs, datasets from drug indications and chemical descriptors are used for drug side-effect prediction independently as well. Another inference which can be drawn from this study is how well can side-effects be grouped together on the basis of there informative data source. This can be observed while analysing the prediction performance of machine learning models using single views of information sources, From the chosen set of side effects, side-effects can be grouped in two sets based on the source of information which is more insightful for the classification either drug indications and fingerprints. For cluster analysis, Dermatitis, Rashes and Vomiting are grouped together where fingerprints were more informative. A study conducted in 2004 used molecular modelling and QSAR (Quantitative stucture activity relationship) studies to study trypanosoma cruzi epimastigotes present in tsetse fly which causes itchiness. Principal component analysis (PCA) showed that the descriptors, N atom and attached 2 C atom from the dithiocarbamate group are significant indicator of the classification between the higher and lower trypanomicid
activity. (Sanches, Taft, et al., 2004). so, literature review supports that drug
fingerprints are an informative data source for skin diseases. Whereas Abdominal Pain, Chronic Fatigue, Headache, Dizziness, Nausea, Vomiting and Weakness are grouped where drug indications were more informative for side-effect classification. Most of these side-effects are co-occuring common biological symptoms associated with many diseases like food poisoning, Hepatitis, alimentary canal cancers, malaria,
cholera (Friedman et al., 2008), (Beare, Taylor, Harding, Lewallen, & Molyneux,
2006), (Kuna & Gajewski, 2017) e-t-c.
In summary the findings of this study can be outlined as follows
• Both drug indications and fingerprints are insightful data sources for drug
side-effects because machine learning models perform better than the random classifications.
• Bayesian efficient multi kernel learning method with jaccard kernel BEMKL
• Overall non-linear methods like BEMKL, Neural network and neural networks have shown better prediction performance.
• In individual views, Abdominal pain, Chronic fatigue, dizziness, diarrhea,
Nausea, Vomiting, Weakness can be grouped together as methods perform better using drug indications, side-effects like rashes, dermatitis are better predicted using fingerprints data
Prediction performance for three side-effects is shown in the results section Diar-rhea, Headache, Dermatitis. Fig 3 is a presentation of diarrhea results highlighting that joint modelling by BEMKL using jaccard kernel outperformed all other methods. Fig 4 represents presentation of Headache results highlighting that in single views, out of the two data sources used, drug indications is more informative and insightful data source. Fig 5 shows dermatitis results highlighting that in skin diseases related side-effects, fingerprints data is more insightful in side-effect prediction. Statistical significance machine learning methods is summarized in Table 4-13 of supplementary section.
3.2
Limitations and Potential Future Directions
A key limitation is the non-availability of genomic information of patients. Perfor-mance enhancement is expected with the additional information of actual genomic features of patients. If we are able to predict the common side effect without genomic information of the patients, then we can compare prediction performance with the addition of the actual genomic information and quantify the impact of genomic influence. The difference in the side-effect prediction accuracy measure would reflect how much genomic features contribute towards adverse effects of drugs.
A wide range of hypothesis in the theme of drug-repositioning can also be generated further with the extension of this research work. However, a potential improvement in analysis strategy is to take the covariance in all the target side-effects into account. It is pertinent to apply advanced machine learning methods to study multiple sets of data together. This thesis work lays the groundwork to adopt multi-task strategy and use Bayesian component based kernelized matrix factorization with flat and wide priors to explicate the structure in the data. Flat and wide priors means that the model learns on its own which is used in absence of any expert opinion and prior knowledge about the expectation of the results. In order to better solve this problem, the chemical information of drugs on cell-lines / detailed patient’s molecular responses along with the phenotypic properties needs to be combined through a systematic method in order to learn the complex inter-dependencies, to predict the side-effects set.
To highlight the promising future directions, latent feature approach to use multi-task learning models should be investigated for side-effect prediction. Hyper-parameter tweaking and optimisation under bayesian setting to can improve the
predic-tion results. Moreover, regression approaches like MVLR will also be explored.(
Ammad-ud din, Khan, Wennerberg, & Aittokallio, 2017). This strategy can then assist in
This work aims to aid investigative exploratory analysis for safe drug’s admin-istration using multiple machine learning classifiers. Intuitively in retrospect this research approach is synonymous with the concept of reverse engineering i-e to indi-rectly quantify the impact of genomic features. The drug indications (drug-disease connection) and chemical descriptors (fingerprints) data is used as input to predict the general side-effects. A comparison with the prediction performance of different models after the addition of genomic features for the same patients would illustrate the entire picture uncovering meaningful biological insights leading to comprehensive understanding of drug-responses in patients. Ultimately, this study would have down-stream implications on personalized medicine, which could be significantly boosted with the proper identification of suitable drugs for the individual patients which requires continuous work in this research domain. Thus, this study contributes to many ongoing projects for machine learning based side effect classification. This anal-ysis pipeline may serve as a baseline platform to detect the side effects of preclinical drugs to facilitate and extend further research.
BEMKL (J) BEMKL (R) BEMKL (L) RF NN LR SVM (J) SVM (R) SVM (L) LD A NB Baseline 1 Baseline 2 Diarrhoea 0.4 0.5 0.6 Accuracy DI DI+FP FP Figure 3: P erformance measure for Side-effect : Diarrho ea
BEMKL (J) BEMKL (R) BEMKL (L) RF NN LR SVM (J) SVM (R) SVM (L) LD A NB Baseline 1 Baseline 2 Headache 0.4 0.5 0.6 0.7 Accuracy DI DI+FP FP Figure 4: P erformance measure for Side-effect : Headac he
BEMKL (J) BEMKL (R) BEMKL (L) RF NN LR SVM (J) SVM (R) SVM (L) LD A NB Baseline 1 Baseline 2 Dermatitis 0.40 0.45 0.50 0.55 0.60 Accuracy DI DI+FP FP Figure 5: P erformance measure for Side-effect : Dermatitis
References
Ammad-ud din, M., Khan, S. A., Wennerberg, K., & Aittokallio, T. (2017).
Systematic identification of feature combinations for predicting drug response
with bayesian multi-view multi-task linear regression. Bioinformatics, 33(14),
i359–i368.
Beare, N. A., Taylor, T. E., Harding, S. P., Lewallen, S., & Molyneux, M. E. (2006). Malarial retinopathy: a newly established diagnostic sign in severe malaria. The American journal of tropical medicine and hygiene, 75(5), 790–797. Bloomquist, L. (n.d.). How pharmaceuticals came to be the 4th leading cause of
death in america.
Bracken, M. B. (2009). Why animal studies are often poor predictors of human
reactions to exposure. Journal of the royal society of medicine, 102(3), 120–
122.
Brechbiel, J., Miller-Moslin, K., & Adjei, A. A. (2014). Crosstalk between hedgehog and other signaling pathways as a basis for combination therapies in cancer. Cancer treatment reviews, 40(6), 750–759.
Breiman, L. (2001). Random forests. Machine learning, 45(1), 5–32.
Bresso, E., Grisoni, R., Marchetti, G., Karaboga, A. S., Souchet, M., Devignes, M.-D., & Smaïl-Tabbone, M. (2013). Integrative relational machine-learning
for understanding drug side-effect profiles. BMC bioinformatics, 14(1), 207.
Butte, A. J. (2008). Translational bioinformatics: coming of age. Journal of the
American Medical Informatics Association, 15(6), 709–714.
Caudill, M. (1989). Neural nets primer, part vi. AI Expert, 4(2), 61–67.
Chee, B. W., Berlin, R., & Schatz, B. (2011). Predicting adverse drug events from
personal health messages. In Amia annual symposium proceedings (Vol. 2011,
p. 217).
Chiang, A. P., & Butte, A. J. (2009). Data-driven methods to discover
molec-ular determinants of serious adverse drug events. Clinical Pharmacology &
Therapeutics, 85(3), 259–268.
Costello, J. C., Heiser, L. M., Georgii, E., Gönen, M., Menden, M. P., Wang, N. J., . . . others (2014). A community effort to assess and improve drug sensitivity
prediction algorithms. Nature biotechnology,32(12), 1202–1212.
Cox, D. R. (1958). The regression analysis of binary sequences. Journal of the
Royal Statistical Society. Series B (Methodological), 215–242.
DiMasi, J. A. (2002). The value of improving the productivity of the drug
development process. Pharmacoeconomics, 20(3), 1–10.
Dimitri, G. M., & Lió, P. (2017). Drugclust: A machine learning approach for drugs
side effects prediction. Computational Biology and Chemistry, 68, 204–210.
Eichelbaum, M., Ingelman-Sundberg, M., & Evans, W. E. (2006). Pharmacogenomics
and individualized drug therapy. Annu. Rev. Med., 57, 119–137.
Friedman, S., Blumberg, R. S., Kasper, D., Braunwald, E., Fauci, A., Hauser, S., . . . Jameson, J. (2008). Harrison’s principles of internal medicine.
Gaulton, A., Bellis, L. J., Bento, A. P., Chambers, J., Davies, M., Hersey, A., . . . others (2011). Chembl: a large-scale bioactivity database for drug discovery.
Nucleic acids research, 40(D1), D1100–D1107.
Gonen, M. (2012). Bayesian efficient multiple kernel learning. arXiv preprint
arXiv:1206.6465.
Hauben, M., Horn, S., & Reich, L. (2007). Potential use of data-mining algorithms
for the detection of ‘surprise’adverse drug reactions. Drug safety, 30(2),
143–155.
Ho, T.-B., Le, L., Thai, D. T., & Taewijit, S. (2016). Data-driven approach to
detect and predict adverse drug reactions. Current pharmaceutical design,
22(23), 3498–3526.
Ho, T. K. (1995). Random decision forests. InDocument analysis and recognition,
1995., proceedings of the third international conference on (Vol. 1, pp. 278–282). Huang, L.-C., Wu, X., & Chen, J. Y. (2011). Predicting adverse side effects of drugs.
BMC genomics, 12(5), S11.
Jahid, M. J., & Ruan, J. (2013). An ensemble approach for drug side effect
prediction. In Bioinformatics and biomedicine (bibm), 2013 ieee international
conference on (pp. 440–445).
James, G., Witten, D., Hastie, T., & Tibshirani, R. (2013). An introduction to
statistical learning (Vol. 112). Springer.
Kola, I., & Landis, J. (2004). Can the pharmaceutical industry reduce attrition
rates? Nature reviews Drug discovery, 3(8), 711–716.
Kuang, Q., Wang, M., Li, R., Dong, Y., Li, Y., & Li, M. (2014). A systematic investigation of computation models for predicting adverse drug reactions (adrs). PloS one, 9(9), e105889.
Kuhn, M., Letunic, I., Jensen, L. J., & Bork, P. (2015). The sider database of drugs
and side effects. Nucleic acids research, 44(D1), D1075–D1079.
Kuna, A., & Gajewski, M. (2017). Cholera—the new strike of an old foe.
Interna-tional Maritime Health,68(3), 163–167.
Leone, R., Sottosanti, L., Iorio, M. L., Santuccio, C., Conforti, A., Sabatini, V., . . .
Venegoni, M. (2008). Drug-related deaths. Drug Safety,31(8), 703–713.
Liang, Z., Huang, J. X., Zeng, X., & Zhang, G. (2016). Dl-adr: a novel deep
learning model for classifying genomic variants into adverse drug reactions. BMC medical genomics,9(2), 48.
Liu, M., Cai, R., Hu, Y., Matheny, M. E., Sun, J., Hu, J., & Xu, H. (2014). Deter-mining molecular predictors of adverse drug reactions with causality analysis
based on structure learning. Journal of the American Medical Informatics
Association, 21(2), 245–251.
Ma, X. H., Wang, R., Xue, Y., Li, Z. R., Yang, S. Y., Wei, Y. Q., & Chen, Y. Z. (2008). Advances in machine learning prediction of toxicological properties and
adverse drug reactions of pharmaceutical agents. Current drug safety, 3(2),
100–114.
Martínez, A. M., & Kak, A. C. (2001). Pca versus lda. IEEE transactions on
pattern analysis and machine intelligence, 23(2), 228–233.
Niu, Y., & Zhang, W. (2017). Quantitative prediction of drug side effects based on
drug-related features. Interdisciplinary Sciences: Computational Life Sciences,