University of South Carolina
Scholar Commons
Theses and Dissertations
1-1-2013
Microencapsulation of a Connexin-43 Mimetic
Peptide as a Novel Wound Healing Agent in an
Ocular Injury Model
Keith Brian Moore
University of South Carolina
Follow this and additional works at:https://scholarcommons.sc.edu/etd Part of theBiomedical Commons
This Open Access Dissertation is brought to you by Scholar Commons. It has been accepted for inclusion in Theses and Dissertations by an authorized administrator of Scholar Commons. For more information, please [email protected].
Recommended Citation
Moore, K. B.(2013).Microencapsulation of a Connexin-43 Mimetic Peptide as a Novel Wound Healing Agent in an Ocular Injury Model.
Microencapsulation of a Connexin-43 Mimetic Peptide as a Novel Wound Healing Agent in an Ocular Injury Model
By
Keith Brian Moore
Bachelor of Science Augusta State University, 2007
________________________________________________________________________
Submitted in Partial Fulfillment of the Requirements
For the Degree of Doctor of Philosophy in
Biomedical Engineering
College of Engineering and Computing
University of South Carolina
2013
Accepted by:
Jay Potts, Major Professor
Richard Goodwin, Committee Member
Robert Gourdie, Committee Member
James Blanchette, Committee Member
ii
© Copyright by Keith Moore, 2013
iii
DEDICATION
I would like to dedicate this work to three people without whom I don’t think this
would be possible; Kelly Moore, Carroll Moore, and David Campbell. Each gave me
iv
ACKNOWLEDGEMENTS
I would like to acknowledge and thank Dr. Jay Potts for allowing me to work in
his laboratory while obtaining my PhD. Without his mentorship and guidance this is not
possible. I would also like to thank the University of South Carolina and the associated
faculty and staff of the Biomedical Engineering program, especially my committee
members Dr. James Blanchette, Dr. Richard Goodwin, and Dr. Robert Gourdie. The
Biomedical Engineering program gave me a chance and allowed me to pursue this degree
while switching disciplines from my undergraduate work in Biochemistry. For this
opportunity I am most grateful.
Finally I would like to thank my lab mates Na Li and Adam Vandergriff as well
as all of my fellow graduate researchers and friends at the school of medicine and the
v
ABSTRACT
Corneal transplantation and related surgical procedures are areas of tissue
replacement which have seen promising advances. Currently, cornea transplants are one
of the most common surgical procedures, with approximately 40,000 occurring each year
in the United States. Still, problems exist with a 20% rejection rate, post surgical
infections, and the need for a constant supply of donors. The ability to safely and quickly
heal and regenerate corneal epithelia fills an area of advancement in regenerative
medicine, with implications reaching beyond the scope of vision therapies toward healing
of a wide range of tissues and wounds. In vivo corneal wounds were created in rats
through a surgical procedure chemically loosening and mechanically removing the
epithelium from the corneal surface. Our study applies a synthetically developed peptide
capable of promotion of wound healing and epithelial regeneration. The alpha-carboxy
terminus 1 (αCT1) peptide is a 25 amino acid peptide from the C-terminus of connexin
43, modified to promote cellular uptake. Previous studies applying αCT1 to excisional
wounds in rats produced resulting tissue having an overall reduced level of scar tissue
and decreased healing time, compared to controls. Upon entering the wound site, the
peptide acts as a competitive inhibitor to the ZO-1-Cx43 interaction. In doing so, the
formation of gap junctions during healing is altered. Here we first characterized the
development and synthesis of alginate based microcapsules, designed to deliver αCT1 in
a controlled and sustained release. We hypothesized sustained release of αCT1 would
alginate-vi
poly-l-ornithine pH 4.3 microcapsule capable of delivery of 150µM of peptide over 48hrs
was ultimately produced. Both directly applied αCT1 in a pluronic gel system and
microencapsulated αCT1 were tested in two studies of in vivo corneal wound injuries
using normal and STZ type I diabetic Sprague Dawley rats. Data derived from RT-PCR,
confocal immunohistochemistry, inflammatory H&E scoring, western blotting, Elisa
protein analysis, and fluorescent wound measurements indicated a significant increase in
wound healing speed when αCT1 was applied at a 150µM concentration. The
application of 150µM αCT1 alginate-poly-l-ornithine pH 4.3 microcapsules further
vii
TABLE OF CONTENTS
DEDICATION ... iii
ACKNOWLEDGEMENTS ... iv
ABSTRACT ... v
LIST OF TABLES ... x
LIST OF FIGURES ... xi
LIST OF ABBREVIATIONS ... xiii
CHAPTER 1: INTRODUCTION ... 1
CHAPTER 2: SYNTHESIS AND CHARACTERIZATION OF A DRUG DELIVERY SYSTEM FOR THE αCT1 PEPTIDE ... 14
2.1 ABSTRACT ... 14
2.2 INTRODUCTION ... 15
2.3 MATERIALS AND METHODS... 17
2.4 RESULTS ... 25
2.5 DISCUSSION ... 44
2.6 CONCLUSIONS ... 47
CHAPTER 3: APPLICATION OF THE αCT1 PEPTIDE BOTH DIRECTLY AND THROUGH CONTROLLED RELEASE IN A RAT CORNEAL INJURY MODEL ... 48
3.1 ABSTRACT ... 48
3.2 INTRODUCTION ... 49
viii
3.4 RESULTS ... 58
3.5 DISCUSSION ... 73
3.6 CONCLUSIONS ... 76
CHAPTER 4: APPLICATION OF THE αCT1 PEPTIDE BOTH DIRECTLY AND THROUGH CONTROLLED RELEASE IN A TYPE I DIABETIC CORNEAL INJURY MODEL ... 78
4.1 ABSTRACT ... 78
4.2 INTRODUCTION ... 79
4.3 MATERIALS AND METHODS... 81
4.4 RESULTS ... 88
4.5 DISCUSSION ... 102
4.6 CONCLUSIONS ... 105
CHAPTER 5: SUMMARY AND FUTURE WORK ... 106
REFERENCES... 109
APPENDIX A.1: RELEASE STUDY EXAMINING DIFFERENCES IN THE RATIO OF αCT1 TO ALGINATE ... 124
x
LIST OF TABLES
Table 1.1 SUMMARY OF GENES ASSOCIATED WITH THE EMT PATHWAY AND THEIR FUNCTIONAL ROLES ... 9
Table 3.1 SUMMARY OF RT-PCR SEQUENCES ... 57
Table 3.2 PRIMARY ANTIBODIES USED IN CONFOCAL
IMMUNOHISTOCHEMISTRY ... 58
Table 3.3 SUMMARY OF CORNEA WOUND CLOSURE ANALYSIS... 64
Table 4.1 SUMMARY OF ANTIBODIES USED FOR CONFOCAL
INFLAMMATORY QUANTIFICATION ... 84
Table 4.2 SUMMARY OF PRIMERS USED IN DIABETIC RT-PCR ANALYSIS ... 87
Table 4.3 SUMMARY OF ANTIBODIES USED FOR WESTERN BLOTTING
OF DIABETIC PROTEINS... 88
Table 4.4 SUMMARY OF DIABETIC WOUND CLOSURE ANALYSIS ... 91
xi
LIST OF FIGURES
Figure 1.1 Illustration of gap junction formation and structure ... 2
Figure 1.2 Pathway map of EMT genes ... 10
Figure 1.3 Sodium alginate chemical structure... 13
Figure 2.1 Parametric analysis of differences in microcapsule diameter with the addition or subtraction of an initial voltage ... 28
Figure 2.2 Release analysis of sodium alginate microcapsules at 200µM and 400µM αCT1 concentrations ... 33
Figure 2.3 Release analysis of sodium alginate microcapsules at pH 4.3, 7.3, and 9.3 ... 34
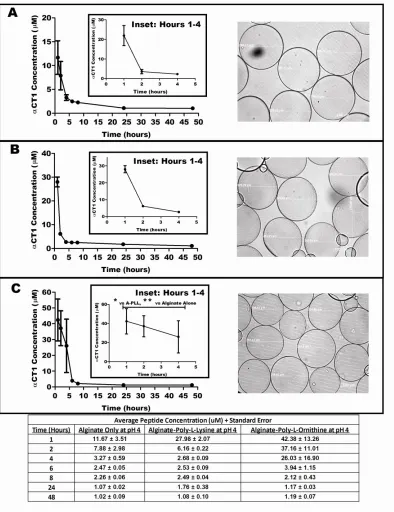
Figure 2.4 Release analysis of sodium alginate, alginate-poly-l-lysine, and alginate-poly-l-ornithine microcapsules at a pH of 4.3 ... 35
Figure 2.5 UV crosslinking of sodium alginate microcapsules to biomaterials ... 38
Figure 2.6 Scanning electron microscopy of UV and non-UV crosslinked microcapsules ... 40
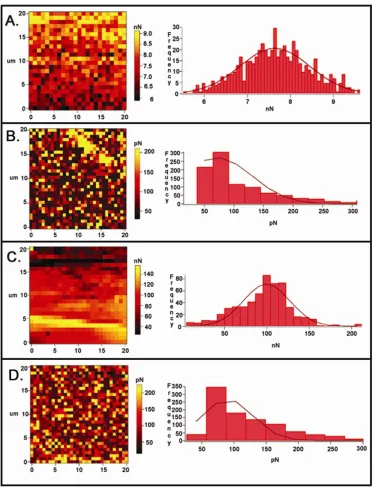
Figure 2.7 Atomic force microscopy of 4.5kV and 6.0kV sodium alginate microcapsules with and without UV crosslinking ... 43
Figure 3.1 XTT cytotoxicity analysis of A-PLO microcapsules ... 60
Figure 3.2 Summary of cornea wound closure using LUMAR imaging ... 64
Figure 3.3 H&E and inflammatory scoring of cryosectioned day 3 corneas... 65
Figure 3.4 RT-PCR analysis of Cx43, ZO-1, and Krt19 ... 68
Figure 3.5 Confocal microscopic analysis of Krt19 and Cx43 at days 1 and 3 ... 69
Figure 3.6 Inflammatory response of corneas to residual calcium chloride ... 72
xii
Figure 4.2 Diabetic corneal wound closure analysis examining percent closure
differences and the Kaplan-Meier method ... 92
Figure 4.3 Confocal inflammation quantification of ITAC and TNFα ... 95
Figure 4.4 Elisa analysis of TNFα concentration in 1, 3, and 5 day corneas ... 96
Figure 4.5 RT-PCR of EMT and insulin sensitive genes in diabetic corneas ... 99
Figure 4.6 Western blotting of EMT and insulin sensitive genes in diabetic corneas .... 100
xiii
LIST OF ABBREVIATIONS
αCT1 ... Alpha Carboxyl Terminus 1
ARBP ... Attachment Region Binding Protein
CaCl2... Calcium Chloride
Cx43 ... Connexin 43
Esr1 ... Estrogen Receptor 1
GLUT4... Glucose Transporter 4
Krt19 ...Keratin 19
Krt8 ... Keratin 8
PWAS ... Pezioelectric Wafer Active Sensors
STZ ... Streptozotocin
TGFβ2... Transforming Growth Factor β2
UV ... Ultra Violet
1
CHAPTER 1: INTRODUCTION
Cell-to-Cell Adhesion and Connexins
Connexins, also known as gap junction proteins, are a group of transmembrane
proteins functioning in the creation of gap junctions. Gap junctions play multifunctional
roles, acting as connecting channels between adjacent cells to transmit electrical impulses
and mediate the passage of small molecules, ions, metabolites, and second messengers.
Gap junctions form through the assembly of six connexin proteins across a cell
membrane. The six connexins may be of the same type (homomeric) or of different types
(heteromeric), with nomenclature based on molecular weight (Herve et al 2004). Initially
connexins are synthesized by ribosomes bound to the endoplasmic reticulum. Once
translated, the connexins are oligomerized and assembled into six unit connexons
(Bennett et al 2004). Post assembly, the connexons are inserted into the plasma
membrane of the cell, forming a hemichannel. Hemichannels then bond with
corresponding hemichannels from adjacent cells. Once two hemichannels are bound a
functional gap junction is formed. The hemichannel-hemichannel interactions may be
2
Figure 1.1 Illustration of formation of gap junction between adjacent cells. Image obtained from http://cellbiology.med.unsw.edu.au/units/science.
Each connexin consists of nine domains (two extracellular, four transmembrane,
three cytoplasmic) of which all but the C-terminus and cytoplasmic loop are highly
conserved between each type (Dbouk et al 2009). The variability in these two regions of
the connexins allow for differences in functionality. Of interest in this research is the
C-terminus region of Connexin 43. Initially gap junctions were thought to only function in
simple cell to cell transport. Now, many different interactions involving varying protein
to protein binding with the gap junction nexus is thought to create changes in function
and regulation. Connexins have been found to interact with other cellular junction
associated molecules such as cadherins (adherens junctions) and zonula occludens (tight
junctions) as well (Dbouk et al 2009; Weiss 2001; Kowalczyk et al 1999). Through these
interactions it is thought a complex system exists to regulate tight junctions and
cell-to-cell connections.
The cytoplasmic tight junction protein ZO-1 binds at the PDZ-2 domain with the
3
connexins such as connexin 45 have also been shown to also bind to ZO-1, possibly
stabilizing the Cx43-ZO-1 interaction (Laing et al 2001). The exact role of this
interaction is unknown, but it is theorized that the relationship may play a key role in
trafficking of molecules (Toyofuku et al 1998) for gap junction formation or as a base
scaffold in gap junction formation (Duffy et al 2002). Connexins have been found to
remain in an open state in response to pathology induced stress, including ischemia and
hypoxia (Evans et al 2012). Furthermore, open hemichannels were shown to be
associated with specific disease states such as cardiac arrhythmia and myocardial
infarction. Recent work by Rhett et al 2011 indicated that the Cx43-ZO-1 interaction
occurs not only at the gap junctions of the plasma membrane, but also the free connexons
of the perinexus. Additional binding of connexins with tight junction associated proteins
was found to occur between occludin-Cx26 and occludin-Cx32 in hepactocytes as well as
claudin-Cx32 (Kojima et al 2001). Adherens junction proteins Wnt-1 and β-catenin
associate with Cx43 to regulate communication, as shown in cardiac myocytes. (Ai et al
2000). A summary list of other known capable connexin 43 interacting or co-localizing
proteins includes Lin-7, α-catenin, p120, N-cadherin, src, PKCα, DMPK, MAPK,
P38MAPK, tubulin, F-actin, drebrin, caveolin-1, clathrin, ubiquitin, CIP 62, and NOV
(Herve et al 2004).
Wound Healing and the Cornea
In this work the αCT1 peptide was evaluated for its therapeutic potential in
corneal injury models using both normal and type I diabetic rats. The cornea is the
nonvascular outer layer of the eye. Five layers comprise the cornea, with the outermost
being the epithelium, accounting for approximately 10% of the thickness. Roughly five
4
absorbs oxygen, and senses pain to protect the eye from damage. The cornea epithelial
layer is attached to a basement membrane. The second layer of the cornea is the
Bowman’s layer, which is a transparent sheet of collagen. This layer may be scarred,
affecting vision. The third and thickest (90%) layer is the stroma. Made up of roughly
78% water and 16% collagen the stroma gives the cornea its flexibility and shape. Fourth
is the Descemet’s membrane which is a collagen membrane acting to protect against
infection. The fifth layer is the single cell thick, endothelial layer. The endothelium
regulates and removes leaked fluid from the stroma to prevent impaired vision, swelling,
and blurring.
Typical wound healing of the skin consists of three main overlapping phases:
inflammation, tissue formation, and tissue remodeling (Martin 1997). Inflammation
begins immediately following wound formation, where fibroblasts and macrophages are
attracted to the injured site (Gurtner et al 2008). Damaged extracellular matrix (ECM)
and contaminating microorganisms are phagocytosed. During inflammation TGF-β and
other ECM proteins begin to infiltrate the wound as well. Several hours after injury
epithelialization begins. Clotted blood is removed as well as intercellular desmosomes,
allowing cellular movement into the wound. Within 1-2 days epidermal cells proliferate
and migrate into the wounded area. As reepithelization occurs, basement membrane
proteins reorder and epidermal cells begin attachment. Approximately 4 days after injury
new granulation tissue enters the wound. TGF-β stimulates fibroblasts to form new
ECM. At this stage neovascularization also occurs, with VEGF and fibroblast growth
factor inducing addition of new blood vessels to wound space. Once the ECM is
5
with an acellular scar (Schultz et al 1991). After 2 weeks wound contraction and ECM
reorganization occur. Fibroblasts convert to myofibroblasts and microfilaments enter the
healing tissue. The wound is then pulled from the edges to contract. Remodeling
continues for up to 12 months after injury. At this point, wounded tissue has
approximately 70% of the strength of the previously uninjured skin (Martin 1997).
The cornea, with its avascular structure, follows a different healing process than
that of the skin. A series of overlapping processes occur in a rapid fashion, beginning
immediately after injury. Following the epithelial injury, a cascade of cytokines
(including IL-1 and PDGF) initiate keratocyte apoptosis (Wilson et al 2001). Growth
factor cytokines are then released by the lacrimal glands, which trigger keratocyte
proliferation and migration from the stroma (Zeiske et al 2001). This is followed by
myofibroblast proliferation and migration to the wound site. Additional cytokines, such
as TGFβ are released, triggering collagen production and remodeling (Netto et al 2005).
Inflammatory cells migrate to the wounded area and stromal remodeling occurs, if
necessary (Ye et al 2000). As the epithelial layer completes closure the inflammatory
cells undergo apoptosis and the keratocytes return to their original state (Dupps and
Wilson 2006). In addition, the limbus of the corneal epithelium is a source of stem cells
capable of transmigrational proliferation, but is not known to be necessary for
reepithelialization after wounding (Dua et al 2010). While the outline of the healing
process is known, many of the details of the process and associated factors are still under
investigation.
6
Epithelial-mesenchymal transition, or EMT, is a series of events where an
epithelial cell is changed into a mesenchymal cell. In this work we examine the role of
this pathway in response to the αCT1 peptide in corneal wound healing. EMT occurs in
many biological processes, beginning in early embryonic development, where it is
responsible for the formation of the mesoderm and induction of the neural crest (O’Quinn
et al 2011). EMT has also been found to occur in other seminal events such as organ
development, tumor cell metastasis, and fibrosis of the lungs, kidneys, heart, and liver
(Chapman 2010; Guarino et al 2009; Kalluri et al 2003; Lee et al 2006). During fibrosis
of major organs epithelial cells undergo EMT to become mesenchymal cells,
translocating to areas of inflammation. Upon arriving, the mesenchymal cells are thought
to act as fibrotic cells, depositing collagen matrix. Excess matrix deposition leads to
scarring at sites of chronic inflammation and further tissue injury (Chapman 2010;
Guarino et al 2009).
To understand the pervasiveness of this cellular event, the characteristics of each
cell type must be understood. Epithelial cells are cuboidal, rigid cells which form sheets
with strong cell-cell interactions. Typically epithelial cells form barriers for organs and
tissues. Epithelial cells are immobile and tightly bound by tight junctions, adherens
junctions, gap junctions, and desmosomal junctions. Mesenchymal cells on the other
hand are very different. They have a non-rigid shape, loose and short lived cell-cell
interactions, and are mobile.
The EMT process is a biological method of cellular rearrangement and repair of
damaged tissue where immobile cells used for structural integrity and boundary
7
is complete the mesenchymal cells convert back to epithelial cells in a reverse process
called MET, or mesenchymal-epithelial transition. Typically the EMT process is tightly
regulated by the body, as in embryogenesis. Unregulated, EMT can lead to disease
states, such as in tumorigenesis and cancer.
There are several markers to identify EMT. On the molecular level β–catenin
localizes in the nucleus, while the presence of vimentin, N-cadherin, snail, slug, and twist
all increase (Guarino et al 2009). Phenotypically there is a noticeable increase in cellular
motility, three-dimensional invasion, and apoptosis resistance. The signaling pathway to
initiate EMT has not been fully mapped, and the activation/regulation process is still
being investigated. However, multiple signaling factors have been discovered. It is
thought that TGFβ and Snail1 are central to EMT events (Mirza et al 2012; Vogelmann et
al 2005). Metalloproteinase-3 (MMP-3) is a Snail1 activator. The presence of MMP-3 in
epithelial cells activates Rac1 production, which in turn activates the production of
reactive oxygen species (ROS) (Radisky 2005). The ROS then activates Snail1
production. Snail1 genes induce EMT by the regulation of cell adhesion and cellular
migration. ILK (integrin-linked kinase) has been found to activate Snail1 as well. TGFβ
is an important cytokine, which when bound to cell surface receptors can trigger a
cascade of cellular responses to activate EMT. One central factor activated is β-catenin.
When β-catenin is bound it enhances cell-cell adhesion by E-cadherin (Brembeck et al
2004; Chu et al 2004). TGFβ stimulation causes β-catenin to detach and move to the
nucleus where it activates transcription of EMT genes (Chapman 2010). Cadherins are
transmembrane proteins responsible for creating adherins junctions. E-cadherin typically
8
regulated while N-cadherin is up regulated post β-catenin stimulation (Chapman 2010).
Activation of these transcriptional factors in the nucleus leads to a loss of strong cell-cell
interactions, releasing the epithelial cell from the basement membrane and surrounding
cells. The epithelial cell then rearranges the F-actin stress fibers and expresses filopodia
and lamellapodia in the mesenchymal state (Lee et al 2006). Finally, transcription is
activated to produce mesenchymal markers. The epithelial cell is now a phenotypic and
molecular match to a mesenchymal cell.
Previous work in our lab with BMSCs has indicated that EMT may be induced ex
vivo. In particular work has shown that different cell lines may be induced to undergo an
EMT event in collagen gels. Rabbit lens epithelial cells seeded on dialyzed collagen gels
can be primed to undergo EMT (Data not shown). Below is a summary of known EMT
regulated genes and their specific roles (Table 1.1) and a pathway map showing the
regulation connections of some of the genes selected in the studies outlined in chapters 3
9
Table 1.1 Summary of genes associated with the EMT pathway and their functional roles. Data from pathway analysis using a Quiagen RT2 EMT assay and related manufacturer information.
Function Associated Genes
Genes Up-Regulated During EMT
Ahnak, Cald1, Camk2n1, Cdh2, Col1a2, Col3a1, Col5a2, Fn1, Foxc2, Gng11, Gsc, Igfbp4, Itga5, Itgav, Mmp2 (Gelatinase A), Mmp3, Mmp9 (Gelatinase B), Msn, Serpine1 (PAI-1), Snai1, Snai2, Snai3, Sox10, Sparc, Steap1, Tcf4, Timp1, Tmeff1, Tmem132a, Twist1, Vcan, Vim, Vps13a, Wnt5a, Wnt5b. Genes
Down-Regulated During EMT
Cav2, Cdh1, Dsp, Fgfbp1, Il1rn, Krt19, Mitf, Ocln, Rgs2, Spp1 (Osteopontin), Tfpi2, Tspan13.
Differentiation & Development
Akt1, Bmp7, Col3a1, Col5a2, Ctnnb1, Dsp, Erbb3, F11r, Fgfr2, Foxc2, Fzd7, Gsc, Jag1, Krt14, Map1b, Mitf, Nodal, Notch1, Ppp3r1, Ptp4a1, Smad2, Snai1, Snai2, Sox10, Tgfβ2, Tgfb3, Tmeff1, Twist1, Vcan, Wnt11, Wnt5a, Wnt5b.
Morphogenesis Ctnnb1, Foxc2, Jag1, Rac1, Smad2, Snai1, Sox10, Tgfβ1, Tgfβ2,
Tgfb3, Twist1, Wnt11, Wnt5a. Cell Growth &
Proliferation
Akt1, Bmp7, Cav2, Ctnnb1, Egfr, Erbb3, Fgfbp1, Foxc2, Igfbp4, Ilk, Jag1, Nodal, Pdgfrb, Tgfβ1, Tgfβ2, Tgfb3, Timp1, Vcan, Zeb1.
Migration & Motility
Cald1, Cav2, Egfr, Fn1, Itgb1, Jag1, Msn, Nodal, Pdgfrb, Rac1, Stat3, Tgfβ1, Vim.
Cytoskeleton Cav2, Krt7, Plek2, Rac1, Vim
Extracellular Matrix & Cell Adhesion
Bmp7, Cdh1, Cdh2, Col1a2, Col3a1, Col5a2, Ctgf, Ctnnb1, Dsc2, Egfr, Erbb3, F11r, Fgfr2, Fn1, Foxc2, Ilk, Itga5, Itgav, Itgb1, Mmp2 (Gelatinase A), Mmp3, Mmp9 (Gelatinase B), Ptk2, Rac1, Serpine1 (PAI-1), Spp1 (Osteopontin), Tgfb1, Tgfβ2, Timp1, Vcan.
Transcription Factors
10
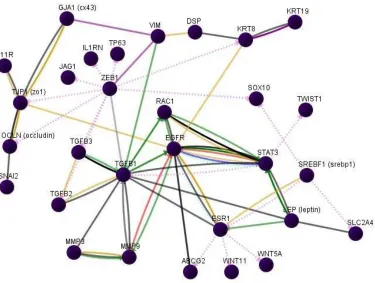
Figure 1.2 Pathway map showing the regulatory connections of sample genes from the EMT pathway. Genes shown here were selected to represent those used in chapters 3 and 4. GLUT4 is represented here by SLC2A4.
Microencapsulation and Drug Delivery Systems
For controlled release of αCT1, microcapsule delivery was investigated.
Microencapsulation is a technique in which small particles are coated with a material to
provide a secondary property of use. Typically the secondary property is controlled
release or protection of the encapsulated material. Microencapsulation systems rely on
diffusion of the encapsulated materials from the inner core to deliver the drug and have
been shown to successfully deliver many different bioactive substances such as peptides,
proteins, enzymes, and antibiotics. Many methods exist for encapsulation including
emulsification, solvent evaporation, pan coating, electrospray encapsulation, and
11
according to synthesis procedures, with spheres, rods, cubes, and corrugated patterns
reported (Enayati et al 2009). The encapsulation technique in this work is the electrospray
method using sodium alginate polymer cores.
Electrohydrodynamics refers to methods of fabrication of polymeric materials
using electrically charged fluids. Examples of polymer materials that may be used
include sodium alginate (SA), chitosan, poly-caprolactone (PCL), poly-lactic-co-glycolic
acid (PLGA), poly-ethylene oxide (PEO), poly-ethylene glycol (PEG), poly-l-lysine
(PLL), poly-l-ornithine (PLO), and poly-lactic acid (PLA) (Casper et al 2005; Chew et al
2005; Xu et al 2006; Chakraborty et al. 2009; Zhang et al 2009; Takka et al 2010). Each
polymer possesses its own unique properties such as biocompatibility, charge, reactivity
with the drug, and viscosity in solution which affect the appropriateness of application.
Within the field of electrohydrodynamics, two main categories exist: electrospinning and
electrospraying. Similar in methodology, each uses one of a variety of polymers placed
in a positively charged syringe attached to a high voltage generator. Using a device to
control flow rate, such as a syringe pump or driver, the polymer is extruded to a grounded
material. The flowing polymer, which is an electrically conductive solution, passes
through the electrical potential difference. With the application of flow, gravity, and an
electric polarization stress, a cone jet is formed at the needle tip (Jaworek and Krupa
1999a). Typically, without these forces, liquids will form a droplet that is geometrically
controlled by the surface tension of the solution and the pull of gravity (Paine et al 2007).
The cone jet is a conically shaped formation at the needle tip, to which charged particles
of liquid exist at the apex of the cone. Once a minimally stable level of both flow and
12
separate from the apex and break apart into reproducible droplets (Jaworek and Krupa
1999b). These droplets are then collected using a grounded device or solution, as nano or
microcapsules. With electrospinning, the grounded device is typically a solid collector of
various shape or size. Electrospraying can involve extrusion into a grounded solution or
onto a grounded surface. Both electrospinning and electrospraying are gaining interest as
methods of delivery of drugs and other activators of biological processes because they
can be easily altered, thus changing release rates and pharmacokinetics. Other methods of
drug delivery may require additional processing steps involving heat, pressure, shear
stress, or reactive secondary chemicals which can degrade or decrease the functionality of
the drug (Enayati et al 2011). Thus, the electrospray method is ideal in its lack of these
negative procedures.
Alginate is a polymer commonly used in microencapsulation for its
biocompatibility and is used here as a base microencapsulating material. Extracted from
the cell walls of brown seaweeds, alginate is popular due to ease of obtainability and
production at a low cost (Orive et al 2006; Zhang et al 2009, 2010). Sodium alginate is a
straight-chain, hydrophilic, polyuronic acid composed of 1→4 linked β-D-mannuronic
acid and α-L-guluronic acid residues (Lee and Mooney 2012). The alginate, in addition
to mannuronic acid, is also composed of guluronic acid. When crosslinked to cations,
such as calcium, a hydrogel is formed (Arghya et al 2010; Zhang et al 2008). Figure 1.3
below shows the chemical structure of sodium alginate, used in our microcapsule
13
14
CHAPTER 2: SYNTHESIS AND CHARACTERIZATION OF A DRUG DELIVERY SYSTEM FOR THE αCT1 PEPTIDE
2.1 Abstract
A need exists to prolong the release of rapidly metabolized peptides of a low
molecular weight, while delivering this peptide without environmental interference.
Previous studies have used Bovine Serum Albumin as a model peptide to study release
characteristics from alginate microcapsules. BSA is 66kDa in size, while the peptide of
interest here, connexin-43 carboxyl-terminus mimetic peptide (αCT1), is 3.4kDa; a large
difference in terms of release. Such a change in size results in a much different set of
release parameters. The overall goal is a sustained release over a 24+ hr period, which
would allow prolonged application of the peptide to a wound site in order to investigate
therapeutic effects. As a result, diffusion methods using sodium alginate microcapsules,
with additional poly-l-lysine (PLL) and poly-l-ornithine (PLO) coating, have been
explored. We first aimed to establish and characterize our size distribution parameters
through a set of parametric tests. Variations in polymer coating, change in pH, and
loading ratio have previously been shown to effect release using model compounds. Here
we test specific changes in these parameters to show effects on the release of αCT1.
Additionally, the microcapsules were attached to several biomaterials and surgical
implants by ultraviolet crosslinking to study effectiveness of attachment and delivery.
Analysis and measurements using phase contrast microscopy, atomic force microscopy
(AFM), and scanning electron microscopy (SEM) were used to characterize changes in
15 2.2 Introduction
Drug delivery systems (DDS) may be created in the nano and micro scale.
Depending on the disease state and desired target to which the drug is to be delivered, a
number of factors must be evaluated. Each DDS has inherent properties that make it
ideal for certain applications. For example, in vivo interactions with the DDS may be
altered based on the size, geometry, material properties (hydrophobicity, hydrophilicity,
charge, etc.), biocompatibility, degradation rate, density, transport characteristics, and
clearance rate of the delivery material (Chew et al 2006; Pham et al 2006; Rutledge et al
2007; Chakraborty et al 2009).
Within the electrospraying method, multiple techniques exist for encapsulating
drugs. One method comprises synthesis of microcapsules and placement in drug
containing solutions, allowing adsorption of the drug onto the microcapsule surface
(Chakraborty et al 2009). A second method involves simultaneous spraying of an
encapsulating polymer of one charge with a drug containing polymer of the opposite
charge, thus creating a multilayered sphere (Langer et al 1969; Enayati et al 2011).
Drugs may also be dissolved and mixed with polymers prior to capsule formation,
creating capsules in one of two ways. First the mixed drug/polymer has a volatile solvent
added to the solution, which is removed by evaporation between extrusion and collection.
Once removed the nano/microcapsule is solidified and stabilized (Wu et al 2009).
Second, the mixed drug/polymer may be extruded into an ionic solution, which acts to
chemically bind and stabilize the created capsules (Xu et al 2006, 2007; Zhang et al
2010a). This method of electrospray microencapsulation is employed in this research,
16
syringe within a syringe to extrude a drug containing core within a polymer shell layer
(Hwang et al 2008).
Alginate is a polymer commonly used in microencapsulation for its
biocompatibility. Extracted from the cell walls of brown seaweeds, alginate is popular
due to its lack of toxicity, ease of obtainability, and low cost production (Orive et al
2006; Zhang et al 2009, 2010). Structurally alginate is, “A straight-chain, hydrophilic,
colloidal, polyuronic acid composed primarily of anhydro-β-D-mannuronic acid residues
with 1→4 linkage.” (Mbanaso & Roscoe 1982; Draget et al 1989). The alginate, in
addition to mannuronic acid, is composed of guluronic acid. When sodium alginate is
crosslinked to cations, such as calcium, a hydrogel is formed (Arghya et al 2010; Zhang
et al 2010b). Low w/v mixtures (1.5-3%) of sodium alginate have been shown to have
sufficient strength and compatibility in vitro when used with living cells (Lin et al 2008;
Zhang et al 2010b). Many polymers, previously listed in chapter 1, have been explored
for use in microencapsulation, with the hope of finding an ideal solution that provides
biocompatibility, the ability to form stable capsule membranes, and ease in control of the
release properties. Promising results have been shown in both synthesis and biological
experiments using PLL and PLO (Rosinski et al 2005; Calafiore et al 1999). Here we
explore the use of these polymers in low concentrations as coatings for the sodium
alginate based microcapsules.
In this work the connexin-43 carboxyl-terminus peptide (αCT1) has been
microencapsulated in sodium alginate to create a controlled drug delivery system. The
αCT1 peptide is a biotinylated 25 amino acid sequence from the C-terminus of connexin
17
Connexins play a key role as mediators in both cell growth and cell death, function in the
immune response, hematopoiesis, and development of progenitor cells (Oviedo-Orta et al
2004; Vinkin et al 2011). An antennapedia section exists to aid in cellular uptake of the
peptide without inducing genetic activity. For analysis, a biotin tail has also been
incorporated into the peptide. A control peptide has also been created with the inactive
16 amino acid antennapedia portion conserved and the active sequence reversed.
Previous research conducted using αCT1 has shown significant effects on reduction in
the formation of skin scars, wound healing, and gap junction remodeling upon ventricular
injury (O’Quinn et al 2011). An exact model of the peptide action has yet to be fully
elucidated, but research has shown possible interaction with gap junction remodeling and
connexin 43 interaction with zonnula occludin-1 (ZO-1) as points of interest (Rhett et al
2008, 2011). Subsequent research has shown an effect of αCT1 on the interaction
between connexin 43 gap junctions and ZO-1 (Hunter et al 2005; Ghatnekar et al 2009,).
Rapid metabolism of the peptide (~2 hours) has prevented previous studies of the long
term effects in these injury models.
2.3 Materials and Methods
Electrospray Method of Microencapsulation
Sodium alginate (Sigma-Aldrich catalog#A0682) was mixed under sterile
conditions at a concentration of 2% w/v, and purified by filtration at 0.2µm. Small
aliquots (280µl) of filtered alginate were loaded into a 3cc syringe and attached to a
syringe driver. A volume of 30ml of 0.15M calcium chloride (CaCl2) (Sigma-Aldrich)
was placed in a 50ml beaker below the syringe pump as an ionic gelling bath, leaving a
18
needle tip (30cc blunt tip, Amazon Supply) with a ground placed in the CaCl2 solution. A
constant voltage was next set on the high voltage generator to pass a field of current
through the needle tip attached to the syringe. The syringe pump was started to push the
filtered alginate solution through the needle tip and into the CaCl2 gelling bath. As the
extruded alginate was pushed by the syringe pump it passed through the positively
charged needle into the negatively charged CaCl2 gelling bath, creating spherical
microcapsules. To test changes in microcapsule diameter, the voltage generator was set at
voltages of 2.5, 3.0, 3.5, 4.0, 4.5, 5.0, and 6.0kV in individual tests, while flow rate
(60mm/hr) and pH (7.4) were held constant during synthesis. These experiments were
repeated with (1.5kV) and without (0kV) the presence of an initial voltage being applied
to the needle by the voltage generator prior to the start of the syringe pump. This was
done to see if any changes in microcapsule size resulted from the change. Microcapsules
were synthesized with and without the voltage set prior to starting the syringe pump, but
voltage remained constant throughout the extrusion process once started. Subsequent
experiments to determine changes in microcapsule diameter were done using changes in
flow rate (15mm/hr, 30mm/hr, 45mm/hr, and 60mm/hr) while voltage (4.0kV) and the
presence of a starting voltage (1.5kV) were held constant.
Alginate-poly-l-lysine (A-PLL) and alginate-poly-l-ornithine (A-PLO)
microcapsules were produced by a 1 step method as a means to circumvent rapid
diffusion and loss of peptide in initial time points that occur by multi-step methods of
synthesis. The initial method of 2% alginate preparation and instrument setup was
repeated as described above. Polymer solutions of either poly-l-lysine (Alfa Aesar
19
99%) were mixed at a 0.5% w/v in 0.15M CaCl2. A 0.5% w/v concentration for both
polymers was selected based on preliminary results allowing dissolution of the material
and ease in buffering to desired pH values. The pH was buffered accordingly using 0.1M
HEPES, 0.1M hydrochloric acid (HCL), or 0.1M sodium hydroxide (NaOH). Polymer
solutions were made at pH values either acidic (4.3) or biologically stable (7.4) for use
during release studies. Synthesized 2% alginate microcapsules were extruded into a
polymer/0.15M CaCl2 bath and allowed to gel 12 minutes. Microcapsules were removed
from the gelling bath post-synthesis and rinsed in sterile deionized water, followed by
examination of morphology by SEM and AFM.
Microencapsulation and Release Profile of αCT1 Peptide
Release profiles of αCT1 were studied over 48 hrs from alginate microcapsules
extruded into CaCl2 solutions with pH values of 4.3, 7.4, or 9.3. In addition release
profiles from poly-l-lysine and poly-l-ornithine coated capsules were studied using the
same set of solution pH values. Lowering the pH to a value opposite in scale to the
isoelectric point (pI) value (theoretical 11.47) of αCT1 is thought to help slow the release
rate by charge repulsion between the peptide and the external gelling solution. The
literature suggests potential methods of controlling release through changes in many
parameters such as pH, polymeric coatings, changes in peptide concentration, addition of
secondary ions or chemicals, and drying of capsules post synthesis (Gray et al 1988,
Dashevsky 1998, Gombotz et al 1998, Vandenberg et al 2001, Tama et al 2011). This
data is not representative of the αCT1 peptide size and high isoelectric point (11.47 vs.
BSA 4.7). The most similar cited release data to αCT1 is insulin (5.8 kDa). In our studies
20
combination of both with variation in pH of the gelling solutions to characterize changes
in αCT1 release.
For these experiments, extrusion parameters were kept constant at 6.0kV, 0kV
initial voltage, and a flow rate of 60mm/hr in all tests. Previous published studies found a
total αCT1 peptide concentration between 100-200µM created a therapeutic range
(Ghatnekar et al 2009). Therefore initial peptide concentration was kept constant at
200µM. Alginate concentration was also kept constant at 2%, while the polymer/CaCl2
bath was synthesized at 0.5%polymer/0.15M CaCl2 as previously listed. Initially,
microcapsules were created using these parameters to show the effect of change from
neutral pH solutions (7.2) to acidic (4.3) using 2% alginate without polymer coating.
Tests were performed to show the effect of addition of both 0.5% A-PLL and A-PLO
microcapsules to acidic pH solutions (pH 4.3). An additional set of release profiles,
conducted on microcapsules synthesized at 6.0kV, 60mm/hr, pH 7.4, were performed to
examine the effects of loading concentration, comparing the 200µM concentration (used
here in the pH and polymer coating tests) with a doubled 400µM amount. Post synthesis,
microcapsules were rinsed in deionized water to remove excess gelling solution. The
capsules were then re-covered in 0.5mL deionized water, with time points taken over 48
hours. Early time points of 1, 2, 4, 6, and 8hrs were taken to account for early burst
release of peptide from the microcapsules, with successive measurements taken at 24 and
48hrs respectively. Analysis of peptide concentration was performed using a Micro BCA
protein assay kit (Thermo Scientific) with αCT1 replacing BSA for our standard curve.
Additional standard curves using BSA were run against the αCT1 to establish any
21
weight protein and peptide used in the standards. All tests were run on a BioTek Synergy
2 spectrophotometer and performed in triplicate. Statistics were compiled using the
GraphPad Prism program with analysis using the student’s t-test program.
Ultraviolet Crosslinking Attachment to Biomaterials
An efficient and fast method of attachment of microcapsules to implanted
materials was sought by ultraviolet (UV) crosslinking. Microcapsules were attached to
silicone, collagen, and PWAS sensor biomaterials exhibiting different material properties
to determine the rate of attachment and overall area of coverage on the material surface.
Flat 2.5% collagen cut into 1cm2 strips was coated by pipetting 30µl of empty 200µm
alginate microcapsules onto the surface. This volume of capsules was chosen to achieve
complete initial coverage of the collagen surface. The microcapsules were allowed to
settle on the collagen surface and then UV crosslinked at one of four UV powers (6300,
8000, 9000, 9999 µJ x100) using a Stratagene UV Stratalinker 1800. Previous work
using collagen tube samples indicated a UV power of 6300 µJ x100 was the minimum
value necessary for crosslinking. Therefore this value was used as a baseline starting
point with three other representative values up to 9999 (maximum instrument value) as
test points. Increasing UV power was expected to create a hardening of the materials and
therefore stronger bonding of the microcapsules to the biomaterials. After UV
crosslinking, the samples were then rinsed in deionized water to remove unattached
capsules after one of two determined stop points: 0.5 or 24hrs. These time points were
selected to give an almost immediate short term point and long term point to compare the
effects of drying on total attachment. Similar attachment tests were performed on
22
coverage ability of UV crosslinking with the microcapsules on multiple implantable
biomaterials for future in vivo experiments. Electromechanical impedance is measured
by the PWAS sensor as a means of evaluating in vivo reactions to implants (Giurgiutiu et
al, 2004, Bender et al, 2006). On both the PWAS sensors and silicone discs, a coat of
100µl of 0.7% methylcellulose was applied to the surface for attachment prior to
microcapsule placement. Both of the later materials received 80µl of ~200µm empty
microcapsules using the identical UV powers and time parameters tested on the collagen
strips. The difference in volumes of microcapsules applied to the silicone and PWAS
sensors (80µl vs. 30µl) compared to the collagen is based on differences in the sample
biomaterial sizes and the maintenance of complete surface coverage with microcapsules
before UV crosslinking. These volumes were found to provide saturation of the materials
surface with microcapsules prior to UV crosslinking. Analysis and images were obtained
using a Zeiss Lumar V12 fluorescent microscope with Axiovision Release 4.9.2 software
and a Zeiss Axiovert 135 phase contrast microscope with Axiovision Release 4.5
software. Statistical analysis was performed using the GraphPad Prism program
analyzing an unpaired student’s t-test to determine significance.
SEM Of UV Crosslinked Microcapsules
Microcapsules were created at a diameter of 200µm with an encapsulated αCT1
peptide concentration of 100µM using 2% sodium alginate as described above. SEM was
performed to characterize surface morphology and UV crosslinking effects on these
capsules. Microcapsules were prepared for SEM in two ways. The first method involved
preparation of microcapsules by UV crosslinking at 9000µJ x 100 twice to 0.7%
23
attachment to biomaterials previously listed in the UV crosslinking section. A 24hr
incubation period at 4°C was allowed, followed by air drying under laminar flow for
2hrs. The microcapsules were then critical point dried (Tousimis Samdri-PVT-3B) and
gold sputter coated (Cressington 108 Auto/SE) for 3 minutes.
The second method of preparation, performed to better view surface morphology
without UV crosslinking, was carried out based on a modified protocol using the
osmium-tannic acid-osmium method (OTO) (Murphy 1980). Loose microcapsules were
initially placed in a 0.1M Na Cacodylate, 3mM CaCl2, pH 7.2 buffer followed by a
buffered fix of 2% paraformaldehyde, 2% glutaraldehyde, and 0.1% ruthenium red. The
microcapsules were next rinsed in 0.9% saline and placed in a secondary buffered fix
consisting of 1% osmium tetroxide and 0.1% ruthenium red. Next the samples were
rinsed in 0.9% saline and placed in a series of alternating buffered fixatives containing
either 1% tannic acid in 1% glutaraldehyde or 1% osmium tetroxide. Rinses in these
buffered fixatives were repeated 8 times at 20 minutes each with rinsing in 0.9% saline in
between steps. The microcapsules were finally rinsed with 0.9% saline to remove any
buffer, dehydrated in a series of ethanol baths, critical point dried, and gold sputter
coated. SEM images were taken using a JEOL JSM-6300 SEM at 10kV.
AFM of UV Crosslinked Microcapsules
Analysis of microcapsule attachment to the implant materials and material
structure was performed using AFM. Glass coverslips were coated with 0.7%
methylcellulose followed by representative samples (4.5kV or 6.0kV total voltage, 0kV
initial voltage, and 60mm/hr flow rate) of 2% alginate microcapsules. The microcapsules
24
analysis. The samples were run on an Asylum MFP-3D Series AFM instrument (Asylum
Research), measuring relative adhesive forces and microcapsule stiffness according to
previously a published protocol (Norris et al 2008). Prior to analysis, the coverslips were
attached to a glass microscope slide and equilibrated in the isolation chamber on the
AFM stage for 5 minutes. The laser was adjusted on the silicon nitride coated cantilever
with a diving-board tip at 0.01N/m constant force (Asylum Research) to achieve
maximum signal through alignment of the laser. Once aligned, the tip was brought into
contact with the microcapsules using the AFM software, (Asylum IGORPro). Once in
contact, an image of the scan area was taken which allowed a view of the sample and its
features. The initial scan taken was a 20µm x 20µm area and subsequent smaller scans
were performed down to a 2µm x 2µm area. From the chosen 2µm square area, we
randomly selected 3-4 regions of interest to sample, selecting both peaks and valleys.
These tips have a radius of curvature of less than 20nm. To obtain stiffness, the AFM was
used in the “indentation mode”. This data is converted through the program into either
force-distance curves or indentation-distance curves. The force distance curve was taken
at this point by allowing the tip to approach the surface and retract, in quick pulses; this
then relayed the static deflection of the tip on the surface. An average of 6 independent
spots had a force distance curve performed on them. These were then averaged and
normalized against the glass slide surface from which the force distance curve was
generated. The result was a plot with two averaged curves, one for the approach and one
for the retraction demonstrating pico-Newton forces along the nanometer scale of
approach and retraction. In order to corroborate that the data was reliable, the curves
25 2.4 Results
2.4.1 Parametric Microcapsule Analysis
Electrospray microencapsulation was performed as a comparative set of tests to
establish the parameters necessary to produce a specific diameter of microcapsule. In this
proof of concept design, microcapsules were synthesized in a specific working range of
voltages while examining the changes in microcapsule diameter with and without the
addition of a starting voltage. Further comparisons were made using the same working
range of voltages, while examining the effect on diameter with changing flow rate. A
range of voltages between 2.5kV-6.0kV, a starting voltage of either 0kV or 1.5kV, and a
series of flow rates (15mm/hr, 30mm/hr, 45mm/hr, and 60mm/hr) are used here as
parameters.
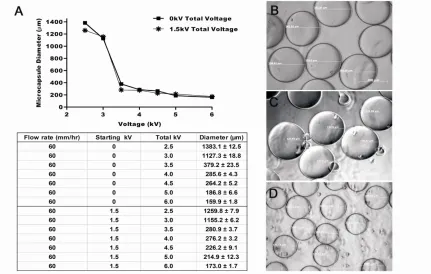
Figure 2.1.1 shows the results of the parametric design. Figure 2.1A provides a
graphical representation of the average microcapsule diameters in the 2.5-6.0kV working
range under the two initial voltage conditions of 0kV or 1.5kV with the attached table
below showing exact measurements with standard error. Flow rate was kept constant at
60mm/hr for all samples in figure 2.1. Each point corresponds to the average
microcapsule diameter of 25 representative capsules. A direct relationship between the
total voltage and microcapsule diameter size was observed with a constant flow rate.
Using a starting voltage of 0Kv and total voltage of 2.5Kv produced microcapsules with a
diameter of 1383.1±12.5µm. When we changed our initial voltage to 1.5Kv we again saw
a direct dependency between the total voltage and the microcapsule diameter. Similar to
the results shown using a 0Kv starting voltage, a 2.5Kv total voltage produced
26
total voltage was increased to 6.0Kv. When individual total voltages were compared
between the 0kV or 1.5kV starting voltages, no significant differences were seen
(p<0.05). Both starting voltages had microcapsules that were larger and smaller at
identical total voltage (figure 2.1A table). Summarizing results, an overall decrease in
diameter was seen when the initial voltage was changed from 0kV to 1.5kV at total
working voltage points of 2.5kV (8.91% decrease), 3.5kV (25.92%), 4.0kV (3.29%), and
4.5kV (14.38%). (Figure 2.1) Similarly, an increase in microcapsule diameter between
0kV and 1.5kV initial voltage was seen at 3.0kV (2.7% increase), 5.0kV (15.04%), and
6.0kV (8.19%). The lack of a consistent pattern of increase or decrease in microcapsule
size and the results of the statistical analysis (p>0.05) indicated changes in starting
voltage between 0kV and 1.5kV are not a significant parameter in changing microcapsule
diameter. Overall our results confirm the presence of size variability in using the
electrospray method.
Examples of images of our synthesized microcapsules are seen in Figures 2.1 B,
C, and D. Figure 2.1B shows microcapsules extruded at 4.0kV, with a starting voltage of
0kV and a continuous flow rate of 60mm/hr. Similarly, Figures 2.1C and 2.1D show
microcapsules synthesized at 4.5kV and 6.0kV with a 0kV starting voltage and 60mm/hr
flow rate, respectively.
Previous reports suggest that changes in flow rate are a determining factor in
microcapsule diameter during synthesis (Chakraborty et al 2009, Zhang et al 2009). We
set out to determine whether changing the flow rate would have an effect on the
variability of microcapsule size. Holding total voltage (4.0kV) and starting voltage
27
Microcapsules made at each of these flow rates showed an average change in diameter of
<20µm when the overall voltage, initial voltage, and alginate concentration were held
constant. (results not shown) Using a one way ANOVA test with Gaussian
approximation a p>0.05 was seen, indicating no significant changes in microcapsule
diameters when flow rate was changed. Taken together these data suggest that total
voltage, rather than flow rate drove microcapsule diameter. As a result, the remaining
experiments in this paper used a constant flow rate of 60mm/hr in the microcapsule
synthesis experiments. Finally, these data indicate that a voltage of at least 3.0kV is
necessary to overcome the surface tension of the alginate as it is extruded at this needle’s
working distance, with values above 3.5kV and less than 6.5kV required to produce
28
29
2.4.2 Loading and Release of αCT1 From Alginate and Polymer Coated
Microcapsules
To characterize our microcapsules as a potential drug delivery vehicle, a series of
release profile experiments were conducted. Of interest was the controlled release of
αCT1 for extended use in future regenerative medicine studies. Our desired outcome was
to obtain a continuous release over a 24+ hr period. In conducting these release
experiments, we examined the effect of pH of the gelling bath solution first with sodium
alginate microcapsules, followed by the effects of both pH of the gelling bath with
addition of either PLL or PLO polymer coating to the alginate capsules. Additional tests
were performed varying the ratio of αCT1 to sodium alginate prior to application. These
results are presented in Appendix A.1.
Initially, loading efficiency experiments were conducted on four samples using
6.0kV total voltage, 0kV starting voltage, 60mm/hr flow rate, an αCT1 concentration of
200µM, and a 2% alginate solution. Measurements using a micro BCA protein assay
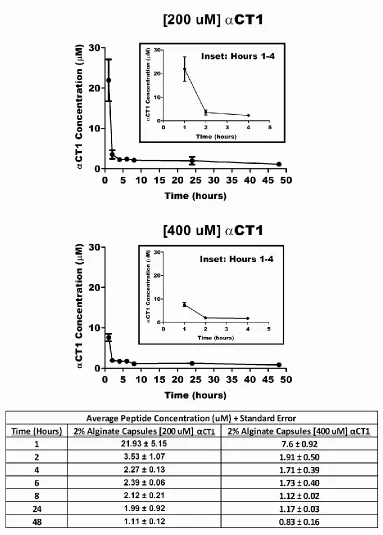
indicated a loading efficiency of 72.53 ± 1.59%. Two identically synthesized sets of
microcapsules, one at a concentration of 200µM and one at 400µM, were analyzed for
release. The results, shown in figure 2.2, indicated a rapid initial burst of αCT1 prior to
the initial 1hr time point when loading with 400µM. As such, only 11.22µM was
measured over the initial 4hrs vs 27.73µM when loading with 200µM. Using the same
controlled parameters, we next synthesized 2% alginate capsules at a 200µM peptide
concentration and measured the release over 48hrs with the pH of the calcium chloride
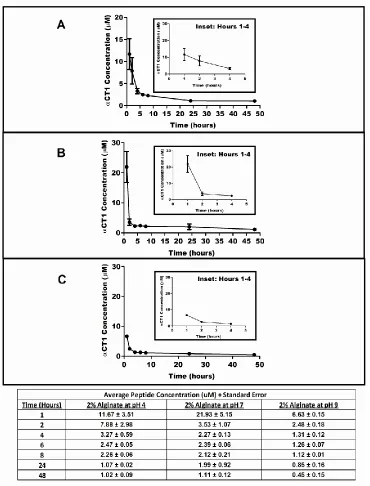
gelling bath at either 4.3 or 7.2. Figure 2.3A shows the 48hr release profile of 2%
30
shows capsules extruded into a neutral 7.2 pH bath, and 2.3C extruded into a basic 9.3 pH
bath. The insets on each graph show the first five hours of release for better appreciation
of the rapid release of the peptide. Average results for each time point are presented in
the table in Figure 2.3. Previous reports have suggested that an acidic pH acts to reduce
the pore size of the microcapsules and therefore slows peptide release (Dashevsky 1998,
Vandenberg et al 2001). When microcapsules were extruded into an acidic environment,
an overall lower initial release of peptide in the first hour (21.93µM vs 11.67µM) was
observed (Figure 2.3 table). However, the acidic environment allowed for an extended
release over the first four hours. In comparison, a larger total amount of peptide is
released over the 48hr period at a neutral pH vs. acidic pH, but by only 5.7µM. The
lowest total release over the first four hours was seen in the basic 9.3 pH environment.
The biological impact of this difference in peptide is unknown at this time and must be
examined in order to determine significance. Based on these results, addition of an acidic
environment at synthesis slows release of the αCT1 peptide and thus extends the profile
timeline.
We next tested whether a change in pH of the alginate solution (pH 4.3 vs pH 7.2)
prior to synthesis with a neutral buffered gelling bath (pH 7.2) would produce changes to
initial burst or extended release kinetics over a 48hr period. No significant changes
(p>0.05 comparing identical time points between pH 4.3 and 7.2) to either the initial
release of the peptide or extended release were observed (Data not shown).
We then set out to determine if coating the alginate microcapsules could enhance
peptide release. The results in figure 2.4 show a comparison of release over 48hrs in three
31
described above. In each case the alginate solution was mixed at a 2% concentration
while the additional polymer coating solution was made at 0.5% w/v. Figure 2.4A
presents release data over 48hrs from 2% alginate capsules without additional polymer
coating at a pH of 4.3. Figure 2.4B shows the A-PLL (poly-l-lysine) polymer coated
microcapsules release data over 48hrs at a pH of 4.3. Figure 2.4C similarly shows the
release data of A-PLO (poly-l-ornithine) polymer coated capsules at a pH of 4.3. The
Figure 2.4 table shows the concentration values of peptide release at each time point for
each of the three capsule types. Total peptide released from the A-PLL capsules was
44.68 ± 2.99µM vs. 113.99 ± 42.85µM for the A-PLO capsules at a pH of 4.3. This
represents a 155.13% increase in released peptide through the change in polymer type at
equal polymeric concentrations. In addition, the total peptide concentration released was
284.58% (84.35µM difference) greater from the A-PLO coated capsules compared to the
uncoated 2% alginate capsules at the same pH. The peptide release seen in the A-PLO
capsules had higher standard error values in hours 1-4 in these tests, which was greater
than values found in the other two capsule types in figure 2.4. Calculating the maximum
high range of the A-PLL capsules in comparison to the low range of the A-PLO capsules
resulted in a 49.23% (23.47µM) change in total peptide release between the two capsule
types. However, statistical analysis of hours 1-4 on the A-PLO vs A-PLL and A-PLO vs
2% alginate without polymer at an acidic pH resulted in significance in both cases (p<
0.05).
When taken together, these data lead us to conclude the addition of polymer
coating in this one step method significantly increases the total amount of peptide we are
32
another significant increase in peptide release in using a PLO coating at a 0.5% w/v
concentration. By combining the changes in both pH and polymer coating, a more
33
34
35
36
2.4.3 UV Attachment of Alginate Microcapsules to Biomaterials
We sought to use UV crosslinking of our microcapsules as a means of attachment
to specific implantable biomaterials of interest. Here we show attachment to three
different biomaterials; 2.5% collagen, silicone discs, and PWAS sensors. UV
crosslinking provides a means of stabilization of the alginate/polymer materials while
also acting as a non-interfering and biocompatible method.
Four differing UV powers (6300, 8000, 9000, and 9999µJ x100) were chosen for
use. In addition, we also varied the time after UV crosslinking the capsules were on the
substrates prior to testing to determine if any significance existed. Two time points were
chosen; one of a short duration (0.5hrs) and a second longer duration (24hrs) to examine
the effect of drying time on attachment. Microcapsules were synthesized at a 2% alginate
concentration and diameter of 200µm, followed by coating on the biomaterial surface.
Samples were then crosslinked at the set powers following placement of the
microcapsules to the biomaterial. Incubation post crosslinking at both the short and long
time points was carried out at 4°C before rinsing with deionized water three times to
remove unattached capsules. Attached capsules were imaged and the total area covered
by microcapsules was marked and measured. Figure 2.5A shows a representative sample
of 2.5% collagen coated with 2% alginate microcapsules post UV crosslinking at 9999µJ
x 100. Similarly, figure 2.5B shows an image of a PWAS sensor coated and UV
crosslinked at 9000µJ x 100. Figure 2.5C shows an image of a silicone disc coated in
microcapsules post UV crosslinking at 8000µJ x 100.
The results shown in the corresponding graphs indicate the percent area covered
37
sensor), and 2.5F (silicone disc)). Results in each graph indicate average area of
coverage based on four separate trials. Analysis of the data show the longer (24hr)
incubation time drastically increased the area of microcapsule attachment on all three
materials. The results also showed that the greatest total surface coverage for both the
collagen (40.17% ± 19.10) and PWAS sensors (39.03% ± 6.72) was achieved when UV
crosslinking was done at a power of 9000µJ x 100. In contrast, the silicone attachment
indicated the highest area of microcapsule attachment occurred with a UV power of
9999µJ x100 (22% ± 9.72), with the results of 8000 (17% ± 7.03) and 9000µJ x100 (21%
± 2.23) producing similar results at 24hrs. In all instances using the UV crosslinking
method, we observed that a total surface area of coverage was never greater than 45%
following rinsing. To maintain microcapsule morphology and prevention of any possible
changes in peptide release from the microcapsules, a small amount of supernatant was
left on the capsules to insure integrity. This volume was minimal but necessary for
integrity to be preserved. The amount of supernatant used was estimated to be enough to
slightly cover the capsules. In total, for future applications, UV crosslinking was shown
to provide a viable method of attachment and delivery of microcapsules with maintained
morphology, but limitations in total coverage of surface area of the materials was
38
39
2.4.4 The Affect of UV Crosslinking on Microcapsule Integrity and Morphology
To investigate the possible effects of UV crosslinking on microcapsule
morphology, samples of microcapsules were analyzed by SEM imaging. Maintenance of
spherical morphology and pore structure is critical to achieve proper release of peptide
from the microcapsules in the same manner shown in our release studies. Samples of
200µm 2% alginate microcapsules were placed on glass coverslips coated with 0.7%
methylcellulose, UV crosslinked at 9000µJ x100 twice, then incubated for 24hrs at 4°C.
A UV power of 9000µJ was selected based on the perceived effectiveness shown at this
power in the UV crosslinking attachment data previously shown. Post incubation the
microcapsules were dried and processed for SEM. Figures 2.6A (200X), 2.6B (2,500X),
2.6C (700X) and 2.6D (700X) show representative examples of these microcapsules at
the indicated magnifications. Upon examination of these capsules, we observed little
negative effect on morphology due to UV crosslinking damage. Figure 2.6A shows
possible clumping and lateral bonding of the microcapsules to one another, which may
have an effect on the overall surface area available. This could lead to variations in the
release rate of the microcapsules. Overall the microcapsules maintained a spherical
morphology upon processing and UV crosslinking. In addition, no surface damage was
observed when examined at higher power (Fig 2.6B). These data further support the idea
40