www.wjpr.net Vol 3, Issue 4, 2014. 1129
DEVELOPMENT AND VALIDATION OF STABILITY-INDICATING
RP-UPLC METHOD FOR SIMULTANEOUS ESTIMATION OF
THIOCOLCHICOSIDE AND KETOPROFEN IN COMBINED DOSAGE
FORM
Balan Paramasivam1*, Kannappan Nagappan2
1
Research Scholar, Faculty of Pharmacy, PRIST University, Thanjavur, Tamil Nadu, India
2
Associate Professor, Department of Pharmacy, Annamalai University, Annamalai Nagar,
Tamil Nadu, India
ABSTRACT
A stability indicating RP-UPLC method was developed and validated
for the simultaneous determination of Thiocolchicoside (TCC) 8mg
and Ketoprofen (KTP) 100mg in tablet dosage form. The
chromatographic separation was Carried out by Thermo Scientific
UPLC Instrument, Accela 1250 Pump, auto sampler with PDA
detector, using Thermo Scientific hypersil gold C18 column, (50 x
2.1mm) particle size 1.9µm using 0.005M KH2PO4 buffer, methanol
and acetonitrile in the ratio of 40:52:08, pH was adjusted to 3 with
ortho phosphoric acid as mobile phase at a flow rate of 250 µl/min
with the detection at 258nm. The run time of TCC and KTP was about
0.59 and 1.01 minutes respectively. The detector response is linear from 4.8-7.2 µg/ml and
64-96 µg/ml concentrations for TCC and KTP respectively. The linear regression equation
was found to be y = 14654x-100.29 (r2 = 0.9999) for TCC and y= 4098.3x +325.38 (r2 =
0.9999) for KTP. The detection limit and quantification limit was 0.19 µg and 0.58 µg for
TCC and 0.4 µg and 1.3 µg for KTP. The percentage of assay for TCC and KTP was about
99.90% and 99.71% respectively. The stability indicating capability was established by
forced degradation experiments. The method was satisfactorily validated as per the ICH
guidelines.
Keywords: Thiocolchicoside; Ketoprofen; Stability indicating; Method development; RP-UPLC; Validation.
Volume 3, Issue 4, 1129-1141. Research Article ISSN 2277 – 7105
Article Received on 15 April 2014,
Revised on 08 May 2014, Accepted on 01 June 2014
*Author for Correspondence Balan Paramasivam
www.wjpr.net Vol 3, Issue 4, 2014. 1130 INTRODUCTION
Thiocolchicoside (TCC) is chemically named as N-[(7S)-3-(β-D-Glucopyranosyloxy)-
1,2-dimethoxy -10- (methylsulfanyl) -9- oxo-5,6,7,9-tetrahydrobenzo[α]heptalen-7-yl] acetamide
(Fig.1). It is a semi synthetic sulfur derivative of colchicoside compound from Gloriosa
superba plant. It is used as muscle relaxant, anti-inflammatory, and analgesic drug and also
used topically for the treatment of muscular spasms and rheumatological disorders (The
Merck Index 14th edition, 2006; Indian Pharmacopoeia, 2010; M. Carta, L. Murru, P. Botta
[image:2.595.122.426.255.376.2]et al., 2006)
Fig. 1 Chemical Structure of Thiocolchicoside
Ketoprofen (KTP) is chemically named as (RS)-2-(3-benzoylphenyl)-propionic acid (Fig.2).
It is a non steroidal anti-inflammatory drug, used to treat painful conditions such as arthritis,
sprains and strains, gout, menstrual pain, severe toothaches, inflammation, particularly in
rheumatic diseases (The Merck Index.,2006; www.patient.co.uk).
Fig.2 Chemical Structure of Ketoprofen
In Literature review the simple UV spectrophotometer (Wankhede, Sagar B et al., 2010;
Sasmita Kumari Acharjya et al., 2010; M. T. Harde et al., 2012; Chaudhari Bharat G. and
Trivedi Jalpesh B., 2012;) HPLC methods (Rosso A and Zuccaro S., 1998; Sagar
[image:2.595.208.388.521.641.2]www.wjpr.net Vol 3, Issue 4, 2014. 1131
T.Vetrichelvan., 2014) and HPTLC method (Dnyansing K. Rajput et al., 2013) were reported
for thiocolchicoside and ketoprofen individually and in combination. Extensive literature
survey revealed that no stability indicating RP-UPLC method has been reported for
simultaneous estimation of thiocolchicoside and ketoprofen in combined dosage form.
EXPERIMENTAL Materials
TCC and KTP were obtained from Firstmed Therapeutics Pvt. Ltd, Pondicherry and their
percentage of purity was 97.0 and 99.99 % respectively. Water (HPLC grade) was obtained
from a Milli –Q water purification system, Acetonitrile (HPLC grade), Methanol (HPLC
grade) and KH2PO4 were of analytical grade purchased from Merck. The commercial
combination [LUPIFLEX, TCC (8mg) and KTP (100mg)] was purchased from local drug
store.
Instrumentation
A Thermo Scientific Ultra Performance Liquid Chromatography (UPLC) Instrument, Accela
1250 Pump and auto sampler with PDA detector and Thermo hypersil gold C18 column (50 x
2.1mm) particle size 1.9µm. The UPLC system was operational with CHROMQUEST
software for data processing. Sartorius analytical micro balance, ultra sonicator (DC1500H
MRC), pH meter (MKVI Systronics), micropipettes and micro-pore filtration set etc were
also used.
Chromatographic Conditions
The analysis was carried out on Thermo Scientific hypersil gold C18 Column (50 x 2.1mm,
particle size 1.9µm), using the mobile phase containing 0.005M KH2PO4 buffer, methanol
and acetonitrile in the ratio of 40:52:08, pH adjusted to 3 with ortho phosphoric acid. Then it
was filtered on 0.22 micron membrane filter and sonicated for 15 min. The injection volume
was 10 µl. The flow rate was 250µl/min. The wavelength was selected at 258 nm with PDA
detector for analysis. All determinations were performed at constant column temperature (25
± 20C). The total run time of the analysis was 3 min. The retention time of the TCC and ACF
www.wjpr.net Vol 3, Issue 4, 2014. 1132 Fig.3 UPLC Chromatorgram of Thiocolchicoside with Ketoprofen
Preparation of standard solution
The standard stock solutions were prepared by transferring 16 mg of TCC and 200 mg of
KTP working standards in 25ml volumetric flask and dissolved with methanol upto the mark.
From the standard stock solution 1ml was taken into 100ml flask, further diluted with mobile
phase to get the final concentrations of 6.4 µg/ml of TCC and 80 µg/ml of KTP.
Preparation of sample Solution
Accurately weighed 10 tablets were triturated with a mortar and pestle. An amount equivalent
to 16 mg of TCC and 200 mg of KTP sample was transferred to a 25 ml clean volumetric
flask, diluted with 10 ml methanol, sonicated to dissolve it completely and made the volume
with the same solvent. Further 1ml of the TCC and KTP of above stock solution was taken
into a 100ml volumetric flask, diluted with mobile phase and analyzed under optimized
chromatographic conditions.
Assay
The proposed procedures were successfully applied for the analysis of thiocolchicoside and
ketoprofen in tablet dosage form. The chromatogram was eluted and drug content in each
sample was calculated by comparison with appropriate standard solution of the drug. The
assay results were shown in Table 1.
Table 1 Assay of Thiocolchicoside with Ketoprofen
Formulation Drug Label Claim(mg) Purity (%)
Tablet Thiocolchicoside 8 99.90
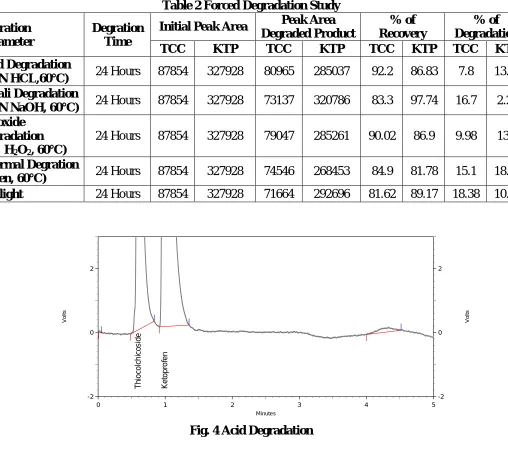
www.wjpr.net Vol 3, Issue 4, 2014. 1133 Forced Degradation Studies
It is a process in which the natural degradation rate of a pharmaceutical formulation is
increased by applying the additional stress. UPLC method is used to separate, detect, and
quantify the various drug related degradation substances. The prepared sample (6.4 µg of
TCC and 80 µg of KTP) was treated with various degradation conditions (Blessy M.et.al,
2013; George Ngwa, 2010)such asacidic (0.1N HCL, 60ºC, 24 hours), alkaline (1N NaOH,
60ºC, 24 hours), oxidization (3% H2O2, 60ºC, 24 hours), thermal (60ºC, 24 hours) and
sunlight (24 hours). Both TCC and KTP were found to be highly sensitive to acidic, alkali
and oxidative degradation. The peak area and assay value were dropped in all the above
mentioned conditions. The results of forced degradation studies were given in Table.2 and
[image:5.595.47.555.311.760.2]shown in Fig.4, Fig.5, Fig.6, Fig.7 and Fig.8.
Table 2 Forced Degradation Study Degration
Parameter
Degration Time
Initial Peak Area Peak Area Degraded Product
% of Recovery
% of Degradation
TCC KTP TCC KTP TCC KTP TCC KTP
Acid Degradation
(0.1N HCL,60°C) 24 Hours 87854 327928 80965 285037 92.2 86.83 7.8 13.17 Alkali Degradation
(0.1N NaOH, 60°C) 24 Hours 87854 327928 73137 320786 83.3 97.74 16.7 2.26 Peroxide
Degradation (3% H2O2, 60°C)
24 Hours 87854 327928 79047 285261 90.02 86.9 9.98 13.1
Thermal Degration
(Oven, 60°C) 24 Hours 87854 327928 74546 268453 84.9 81.78 15.1 18.22 Sunlight 24 Hours 87854 327928 71664 292696 81.62 89.17 18.38 10.83
Fig. 4 Acid Degradation
Minutes
0 1 2 3 4 5
www.wjpr.net Vol 3, Issue 4, 2014. 1134 Fig.5 Alkali Degradation
Fig.6 Peroxide Degradation
Fig.7 Thermal degradation
Minutes
0 1 2 3 4 5
V o lt s -2 0 2 V o lt s -2 0 2 T h io c o lc h ic o s id e K e to p ro fe n Minutes
0 1 2 3 4 5
V o lt s -1 0 1 2 V o lt s -1 0 1 2 T h io c o lc h ic o s id e K e to p ro fe n Minutes
0 1 2 3 4 5
www.wjpr.net Vol 3, Issue 4, 2014. 1135 Fig 8 Sunlight degradation
Method Validation
The developed method was validation as per ICH guidelines (ICH-Guidelines, 1995). The
validation parameters are linearity, accuracy, precision, limit of detection (LOD), limit of
quantitation (LOQ) and robustness.
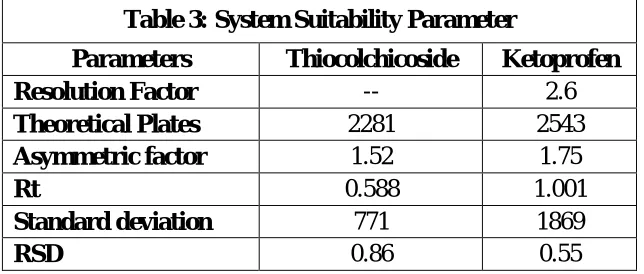
System Suitability
The six replicated injections were made in the standards solution of both TCC and KTP and
system suitability parameters such as theoretical plates (USP), resolution (USP) and
asymmetry factor were evaluated. The results of the system suitability parameters were given
in Table 3. The 3D chromatogram was shown in Fig.9
Table 3: System Suitability Parameter
Parameters Thiocolchicoside Ketoprofen
Resolution Factor -- 2.6
Theoretical Plates 2281 2543
Asymmetric factor 1.52 1.75
Rt 0.588 1.001
Standard deviation 771 1869
RSD 0.86 0.55
Minutes
0 1 2 3 4 5
V
ol
ts
-5.0 -2.5 0.0 2.5 5.0
V
ol
ts
-5.0 -2.5 0.0 2.5 5.0
T
h
io
c
o
lc
h
ic
o
s
id
e
K
e
to
p
ro
fe
[image:7.595.138.460.523.660.2]www.wjpr.net Vol 3, Issue 4, 2014. 1136 Fig.9 System Suitability 3D Picture of TCC and KTP
Linearity
Linearity was demonstrated from five different concentration levels for both TCC and ACF,
which were found to be linear in the range of 4.8 µg/ml to7.2 µg/ml and 64 µg/ml to 96
µg/ml respectively. The values were given in Table 4. Correlation coefficient for TCC and
KTP was found to be 0.9999 and 0.9999 respectively. The calibration curves were shown in
the Fig.10 and Fig.11.
Linearity Plot of Thiocolchicoside
y = 14654x - 100.29 R2 = 0.9999
-20000 0 20000 40000 60000 80000 100000 120000
0 1 2 3 4 5 6 7 8
Concentration (µg/ml)
A
rea
www.wjpr.net Vol 3, Issue 4, 2014. 1137
Linearity Plot of Ketoprofen
y = 4098.3x + 325.38 R2 = 0.9999
0 50000 100000 150000 200000 250000 300000 350000 400000 450000
0 10 20 30 40 50 60 70 80 90 100
Concentration (µg/ml)
A
re
[image:9.595.137.494.75.263.2]a
[image:9.595.156.444.304.454.2]Fig.11 Linearity Plot for ketoprofen
Table. 4. Linearity of Thiocolchicoside and Ketoprofen
Thiocolchicoside Ketoprofen
Concentration
(µg/ml) Area
Concentration
(µg/ml) Area
4.8 70067 64 263924
5.4 79157 72 295485
6 87089 80 326236
6.6 97185 88 363291
7.2 105516 96 392325
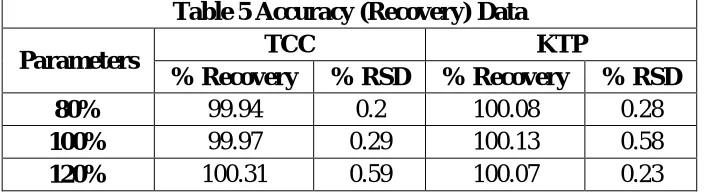
Accuracy (Recovery Studies)
To check the degree of accuracy of the method, the recovery studies were performed by
standard addition method at 80 %, 100 % and 120 %. Known amounts of standard mixture of
TCC and ACF were added to pre-analyzed samples and were subjected to the proposed
UPLC method. Results of recovery studies were given in Table 5.
Table 5 Accuracy (Recovery) Data
Parameters TCC KTP
% Recovery % RSD % Recovery % RSD
80% 99.94 0.2 100.08 0.28
100% 99.97 0.29 100.13 0.58
120% 100.31 0.59 100.07 0.23
Precision
Intra day precision (Repeatability) and Inter day precision (Reproducibility) was evaluated by
[image:9.595.123.476.587.684.2]www.wjpr.net Vol 3, Issue 4, 2014. 1138
from a single lot formulation. Percentage relative standard deviation (%RSD) was calculated.
[image:10.595.130.469.127.212.2]The results for precision were given in Table 6.
Table 6 Precision
Drug Intra day assay Inter day assay % Obtained % RSD % Obtained % RSD
TCC 100.73 0.18 100.62 0.15
KTP 99.87 0.29 99.85 0.33
Robustness
To evaluate the robustness of the developed RP-UPLC, small deliberate variations in the
parameters of optimized method were done. The effect of ±2 % change in flow rate, ±2 nm
wavelength and 2 different analysts on the retention time and area were studied. The results
[image:10.595.120.476.340.471.2]of robustness were tabulated in Table 7.
Table 7: Results of Robustness
Factor Level Retention time Area (µv 2
sec)
TCC KTP TCC KTP
Standard 250µl / min 0.588 1.001 88047 319306
Flow rate 225µl / min 0.663 1.123 84452 314819
275µl / min 0.533 0.893 65668 249941
Wavelength 256nm 0.59 0.998 50504 253243
260nm 0.999 0.999 125943 308988
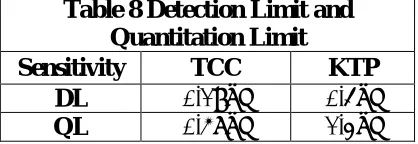
Detection Limit (DL) and Quantitation Limit (QL)
The detection limit (DL) is the lowest concentration of analyte in a sample that can be
detected. The quantification limit (QL) is defined as the lowest concentration of the substance
that can be quantified with acceptable precision and accuracy. The detection limit and
quantitation limit were calculated as DL = 3.3 x σ /slope and QL = 10.0 x σ / Slope, here σ is
residual variance due to regression. The DL and QL values were given in Table 8.
Table 8 Detection Limit and Quantitation Limit
Sensitivity TCC KTP
DL 0.19µg 0.4µg
[image:10.595.194.403.625.697.2]www.wjpr.net Vol 3, Issue 4, 2014. 1139 RESULTS AND DISCUSSION
To develop a suitable UPLC method for analysis of the drugs in pharmaceutical formulation,
in the beginning various tests were carried out to select the optimum conditions. After many
number of trials various proportions of solvents including buffers and acetonitrile were used
for this study. The goal of this study was to develop a rapid UPLC method for the analysis of
TCC and KTP in a finished combined tablet dosage form using a 0.005M KH2PO4 buffer,
methanol and acetonitrile in the ratio of 40:52:08, pH was adjusted to 3 with ortho phosphoric
acid at a flow rate of 250 µl/min, hypersil C18 (50 x 2.1 mm), particle size 1.9µm column
with the PDA detection at 258 nm. The retention time was found to be 0.59 min and 1.01 min
for TCC and KTP respectively. The linear regression equations were y = 14654x-100.29 (r2 =
0.9999) for TCC and y= 4098.3x +325.38 (r2 = 0.9999) for KTP. The developed method was
found to be accurate and precise; the RSD values were less than 1. The stability indicating
capability was established by forced degradation experiments. The percentage of assay for
TCC and KTP was about 99.90 % and 99.71 % respectively.
CONCLUSION
The developed method was simple, rapid, and accurate for simultaneous determination of
thiocolchicoside and ketoprofen in combined tablet dosage form. This method shows accurate
precise and sensitive and less time consuming and also economical. Thus, the proposed
method can be easily adopted for routine analysis of thiocolchicoside and ketoprofen in
combined dosage forms.
ACKNOWLEDGEMENTS
The authors are very much grateful to PRIST University, Thanjavur, India and Ideal
Analytical & Research Institution, Puducherry, India for providing all the facilities to perform
the research work.
REFERENCES
1. Blessy M.et.al, Development of forced degradation and stability indicating studies of
drugs – A review, J. Pharm. Anal.(2013) http://dx.doi.org/10.1016/j.jpha.2013.09.003
2. Chaudhari Bharat G.* and Trivedi Jalpesh B; Simultaneous Spectrophotometric
Estimation of .
3. Thiocolchicoside and dexketoprofen trometamol in Pharmaceutical dosage form;
www.wjpr.net Vol 3, Issue 4, 2014. 1140
4. Dnyansing K. Rajput, Atul A. Shirkhedkar, Jyoti K. Rajput, Harun M. Patel,and Sanjay
5. J.Surana. Stability Studies of Thiocolchicoside in Bulk and Capsules Using RP-HPTLC /
Densitometry. Journal of Analytical Methods in Chemistry. Volume 2013 (2013), Article
ID 142628, 7 pages http://dx.doi.org/10.1155/2013/142628
6. G. Abirami,* and T. Vetrichelvan; A New RP-HPLC Method for Simultaneous
Estimation of
7. Thiocolchicoside and Ketoprofen in tablet dosage form; World Journal of Pharmacy and
Pharmaceutical Sciences, 2014, Volume 3, Issue 2, 2564-2575
8. George Ngwa, Forced Degradation as an Integral part of HPLC Stability – Indicating
Method
9. Development, Drug Delivery Technology, June 2010, Vol 10, No.5
10.Gupta KR et al., Development and Validation of Stability- Indicating RP-HPLC and
Assay Method for Determination of Thiocolchicoside in Capsule. American Journal of
PharmTech Research 2012. Vol.2, Issue. 1; page No. 589-602
11.Hilmi I, Bayram BO. Validation of analytical procedure for the determination of
Tiocolchicoside drug by HPLC.Salon1A & B (Intercontinental at the Plaza), 2007;281.
12.http://www.rxlist.com/orudis-drug.htm
13.http://www.patient.co.uk/medicine/ketoprofen-for-pain-and-inflammation
14.ICH-Guidelines Q2A, Validation of Analytical Procedures: Definition and terminology
Geneva, Switzerland 1995. 68-76.
15.ICH of Technical requirements for the registration of Pharmaceutical for Human Use
(ICH) Q2b.Validation Analyticla Procedures Methodology (1996)
16.M. T. Harde*, S. B. Jadhav, D. L. Dharam, P. D. Chaudhari: Development and Validation
of UV-Visible Spectrophotometric Methods for Simultaneous Estimation of
Thiocolchicoside and Dexketoprofen in Bulk and Tablet Dosage Form; International
Journal of Pharmaceutical Sciences and Drug Research 2012; 4(2): 160-163
17.M. Carta, L. Murru, P. Botta et al., “The muscle relaxant thiocolchicoside is an antagonist
of GABAA receptor function in the central nervous system,” Neuropharmacology, 2006,
vol. 51, no. 4,pp. 805–815
18.Ministry of Health & Family Welfare, “Indian Pharmacopoeia,”in Indian
Pharmacopoeial Convention, vol. 3, pp. 2213–2215,Ministry of Health & Family
Welfare, Ghaziabad, India, 6th edition, 2010.
19.Rosso A, Zuccaro S. Determination of alkaloids from the colchicines family by
www.wjpr.net Vol 3, Issue 4, 2014. 1141
20.Sasmita Kumari Acharjya, Priyambada Mallick, Pnakini Panda and M. Mathrusri
annapurna,Spectrophotometric methods for the determination of thiocolchicoside in bulk
and pharmaceutical dosage forms; J Pharm Educ Res. June 2010,Vol. 1, Issue.1
21.Sagar B.Wankhede*, Somnath S. Zambare, Nitin R.Dixit and Sohan S. Chitlange
RP-HPLC Method for Simultaneous Estimation of Thiocolchicoside and Ketoprofen in
Combined Dosage Form; Der Pharmacia Lettre, 2010, Vol.2, Issue.3; Page 315-320
22.The Merck Index: An Encyclopedia of chemicals, Drugs and Biological. Whitehouse
station, NJ, USA, 14th Edn, 2006; 1603.
23.The Merck Index: An Encyclopedia of chemicals, Drugs and Biological. Whitehouse
station, NJ, USA, 14th Edn, 2006; 918.
24.Venkatachalam T and Lalitha K.G; Reverse – Phase HPLC Method for Simultaneous
Analysis of Thiocolchicoside and Ketoprofen in tablet formulations; International Journal
of Pharmacy and Pharmaceutical Sciences 2013 Vol 5, Issue 4, 679-682
25.Wankhede, Sagar B, Zambare, Somnath S, Chitlange, Sohan S. Estimation of
Thiocolchicoside And Ketoprofen in pharmaceutical dosage form by Spectrophotometric