R E S E A R C H
Open Access
Binary integration nonparametric
detection for range-spread targets in
distributed terahertz radar network under
unknown clutter
Tong Liu
1, Rui Min
1*, Yiming Pi
1, Keyu Long
2and Zhongtao Huang
2Abstract
In this study, to detect person-borne concealed threats in range profiles under the circumstance of unknown clutter, we propose a binary integration nonparametric detection method based on the generalized sign (GS) detector for range-spread targets in a distributed terahertz radar network (DTRN). In the detection, the length of range-spread targets and the number of dominant scatterers on range-spread targets are considered and adaptively estimated. Furthermore, the GS detection method is applied to maintain a constant false alarm rate (CFAR) under the
circumstance of unknown clutter. The detection performance of the proposed method for single terahertz radar and DTRN are both examined with the data synthesized by real range-spread targets data and real clutter data.
Experimental results show that the proposed method is effective, and for a given false alarm probability, the DTRN exhibits better detection performance than the single terahertz radar.
Keywords: Binary integration detection, Nonparametric, Range-spread targets, Distributed terahertz radar network, Unknown clutter
1 Introduction
Given its short detection range and penetrativity, tera-hertz radar is mainly applied in the fields of security checks and anti-terrorism with high-resolution screening imaging at a stand-off distance [1–3]. Meanwhile, tera-hertz radar can also detect concealed threats in range profiles (the real range profile of a metallic pistol model beneath clothing is obtained by 0.34 THz radar, as shown in Fig. 1). Compared with high-resolution screening imag-ing, the concealed threat detection in range profiles can observe a large area and requires a short time. However, as the viewing angle of a single radar is limited, a radar net-work is needed in a large-scale sence. As shown in Fig. 2, a circular terahertz radar network is adopted to observe a 360◦view of the scene further. A certain number of sen-sors that observe the same scope in the sence constitute a
*Correspondence: [email protected]
1School of Electronic Engineering, University of Electronic Science and Technology of China, No. 2006 Xi Yuan Avenue, Chengdu, China Full list of author information is available at the end of the article
DTRN for distributed detection. The radar network con-sists of several DTRNs, which monitor concealed threats in all aspects.
Concealed threats are range-spread targets for high-resolution radar. In order to solve the so-called col-lapsing loss which will lead to a performance loss for range-spread targets detection [4], many detectors are presented. Assuming the a priori scatterer density of range-spread targets, a detector dependent of spatial density is investigated [5]. Given that the scattering char-acteristics of range-spread targets are significantly differ-ent, completing the aforementioned method is difficult. When the scattering geometry of range-spread targets is unknown, the adaptive detectors that are based on the improved one-step or two-step generalized likelihood ratio test are proposed under the circumstance of homo-geneous or inhomohomo-geneous clutter [6–12]. However, it is difficult to derive a definite distribution model to repre-sent the practical clutter in concealed threat detection, which may consist of radar echoes of the human body,
Fig. 1Real high-resolution range profile of a metallic pistol model beneath clothing
clothing, the ground, and thermal noise. Since those afore-mentioned detectors are incapable of maintaining the constant false alarm rate (CFAR) to detect concealed threats, nonparametric detectors for range-spread targets are needed. While the traditional nonparametric detec-tors and their improved counterparts are presented for point target or multiple targets [13, 14]. Research on nonparametric detection for range-spread targets under the circumstance of unknown clutter has rarely been reported. Therefore, a nonparametric detector that con-siders the knowledge about dominant scatterers on range-spread targets is investigated in this study.
The binary integration nonparametric detector based on the GS detector (BINGS) for range-spread targets in
Fig. 2Diagram of monitoring of concealed threats
DTRN is presented to satisfy the aforementioned practical application requirements. Given that the length of range cell samples is larger than that of range-spread targets, the sliding window detection method is applied to the local detectors. First of all, the length of the sliding win-dow which is the possible length of range-spread targets is estimated via the maximal signal to clutter ratio (SCR) rule [15]. What is more, the number of dominant scatter-ers within the sliding window is selected as the threshold for binary integration detection, which is estimated via Otsu’s method [16]. Then, after the GS detection of each scatterer within the sliding window, binary integration detection is performed. Finally, the overall decision of DTRN is gained following the m-out-of-n fusion rule. The detection performance of single terahertz radar and DTRN is analyzed under the circumstance of unknown clutter by using the data synthesized by real range-spread targets data and real clutter data. Experimental results show that the proposed method is effective, and for a given false alarm probability, the DTRN exhibits better detection performance than the single terahertz radar.
This paper is organized as follows. In Section 2, the structure of the BINGS detector in DTRN is described. In Section 3, the mathematical processes related to detection are derived. In Section 4, the experiments are described and the results are analyzed. In Section 5, the comments and conclusions are presented.
2 Detector structure
The BINGS structure is shown in Fig. 3. Terahertz radar transmits the linear frequency modulation signal with large bandwidth. After dechirping of radar echoes, range cell samples are obtained. Because the length of range cell samples is larger than that of range-spread targets, the sliding window detection method is used for range cell samples.
First of all, the length of the sliding window which is the possible length of range-spread targets is estimated
via the maximal SCR rule. Then, utilizing N reference
cells surround the sliding window, the test statistic of the GS detection TGS is constructed for each scatterer
within the sliding window. At the same time, the first thresholdTGSP forTGScorresponding to the false alarm
probabilityPfGS is calculated by Eq. (11). As a result, the sequence of “0” and “1” decisions are output by com-paring TGS with TGSP for each scatterer. So far, the GS
detection for each scatterer within the sliding window is completed. In addition, the second thresholdQOPTis
adaptively estimated by Otsu’s method after the sliding
window is determined, where QOPT is the number of
Fig. 3Flow chart of the BINGS
The block diagram of the DTRN data fusion is shown
in Fig. 4. DTRN is formed from n local BINGS
detec-tors which are considered independent and a data fusion center. The local binary decisions are transmitted from the local detectors to the data fusion center. The overall decision is obtained following them-out-of-nfusion rule.
3 Theory and methodology
3.1 Length of range-spread targets estimation
Regardless of whether the range-spread targets or the attitude angles of the same range-spread target are
different, the length of range-spread targets varies signif-icantly, which has an important effect on the detection performance. Here, the length of range-spread targets will be adaptively estimated via the maximal SCR rule [15].
The sliding window detection method is used for the range-spread targets detection. The length of range cell samples denoted by x(i),i = 1, 2,· · ·,Z isZ. The slid-ing window isw =[k,k+L−1], wherekandLare the starting range cell and the length of the sliding window, respectively. Assuming that the entire range-spread target is inside the sliding window and all the range cells outside
Fusion center
Sensor 1
Sensor i
Sensor n
i
u
1
u
u
n0
u
ir
1
r
r
nof the sliding window are clutter, the average SCR can be
The starting range cell k and the length L of range-spread targets are unknown. While the possible minimal
length Lmin and maximal length Lmax of range-spread
targets are known.
The window slides over the range profiles. For each starting range cellk, the width of the sliding windowwis adjusted betweenLminandLmax. The length of the sliding
window can be estimated by the maximal SCR rule
¯
whereL¯is the estimation value of the possible number of range cell samples that range-spread targets occupy.
3.2 Number of dominant scatterer estimation
The radar echo energy of range-spread targets is mainly distributed in dominant scatterers. Hence, the distribu-tion of dominant scatterers on range-spread targets has an important effect on the detection performance. The num-ber of dominant scatterers within the sliding window is used as the threshold for binary integration detection.
Similar to Otsu’s method initially utilized in picture pro-cessing [16], the number of dominant scatterers within the sliding window is adaptively estimated. When the vari-ance between various classifications is maximal, the range cells within the sliding window are divided into domi-nant scatterers and the others (small scatterers that can be regarded as clutter and/or clutter) according to amplitude. And in this situation, the probability of false segmentation is minimal.
The amplitude ofLrange cells inside the sliding window are normalized and sorted in descending order. The new sequencex(i)is obtained as follows:
x(1)≥x(2)≥ · · · ≥x(L) >0 , (3)
wherex(i)is divided into two classes, namely,C1
(domi-nant scatterers) andC2(small scatterers that can be regard
as clutter and/or clutter) by a thresholdTtb. The average
amplitude ofC1andC2are given by
respectively. The average amplitude ofx(i)is denoted by
u, and the variance betweenC1andC2is denoted byσb2.
u=ω1∗u1+ω2∗u2 (5)
σ2
b =ω1∗(u1−u)2+ω2∗(u2−u)2, (6)
whereω1=L1/Landω2=L2/L. Plugging Eqs. (4) and (5)
into Eq. (6) yields
σ2
The optimal threshold Tb that maximizes σb2 can be
selected as follows:
Tbis obtained by searching the one-dimensional
param-eter space. Then, the number of scatterers whose ampli-tute is greater than or equal to Tb within the sliding
window is estimated as the optimal thresholdQOPT.
3.3 Test statistic of single detector
yj,p(j=1, 2,· · ·,M,p=1, 2,· · ·,L) denotes the range cell
samples under the test, whereMis the number of integra-tion pulses.xi,q(i = 1, 2,· · ·M,q = 1, 2,· · ·,N) denotes
the reference cell samples, whereNis the number of ref-erence cells. The test statistic of the GS detection for each range cell within the sliding window is given by
TGS=
is the rank of the single
scatterer under test,uyjp−xji
The corresponding detection strategy is
TGS≥TGSP, scatterer
TGS<TGSP, no scatterer , (10)
where TGSP is the threshold for the single scatterer GS
detection that corresponds to the false alarm probability
PfGS, which is derived as follows [17]:
PfGS =Pr(TGS≥TGSP|H0)
= MN k=TGSP
Pr(TGS=k|H0), (11)
where the scatterer is absent under hypothesisH0and the
scatterer is present under hypothesisH1.
identically distributed (i.i.d.), the probability density dis-tribution ofrj=rcan be expressed as
Pr(rj=r)=CNr
cr(t)[1−c(t)]N−rd sc(t), (12)
wherer=0, 1, · · ·, N.
When the range cell under test is the pure clutter, Eq. (12) can be simplified as
Pr(rj=r)=
1
N+1, 0≤r≤N. (13)
The generating function ofrjis
GSj(t)=
ating function ofTGSis given by
GS(t)=GSj(t)
Equation (16) can be rewritten as
Pr[TGS=k|H0]=
The second term in Eq. (17) is equivalent to the coeffi-cient oftk.
Equation (17) can be interpreted by combination and mathematical statistics. Assuming thatMsets are present and every set is{0, 1, · · ·,N}, one integer is taken from each set andMintegers are obtained.(N+1)Mis equiv-alent to the number of all the possible combinations. The second term is equivalent to the number of combinations in which the sum of these M integers is k. Therefore,
Pr[TGS=k|H0] is the probability of TGS = k under
hypothesisH0.
If the values of M and N are set, then the relation-ship betweenPfGS andTGSP can be determined. Table 1 shows the relationship betweenPfGS andTGSPunder the condition ofM=4 andN=12.
For a given false alarm probability PfGS, TGSP can be calculated. Then, the detection probability of the single scatterer GS detection can be given by
PdGS =Pr(TGS≥TGSP|H1)
= MN k=TGSP
Pr(TGS=k|H1). (18)
Table 1Relationship betweenPfGSandTGSPunder the condition
ofM=4 andN=12
PfGS 0.000035 0.000175 0.000525 0.0012
TGSP 48 47 46 45
PfGS 0.0025 0.0044 0.0074 0.0116
TGSP 44 43 42 41
PfGS 0.0173 0.0250 0.0350 0.0478
TGSP 40 39 38 37
PfGS 0.0637 0.0832 0.1064 0.1437
TGSP 36 35 34 33
The test statistic of the BINGS detetion is expressed as follows:
where sgn(·)denotes the sign function.
The false alarm probabilityPfBGSof the BINGS detection is derived as follows:
PfBGS=
PfBGS is irrelevant to the distribution of clutter. Mean-while, the threshold for the test statistic of the BINGS detection is independent of the distribution of clutter. Therefore, this detector is a nonparametric detector.
The detection probabilityPdBGSof the BINGS detection is derived as follows:
PdBGS=
3.4 Distributed terahertz radar network
The parallel structure is adopted in DTRN, which is formed fromnlocal detectors (the BINGS detector) and a data fusion center. The local binary decisions are trans-mitted from the local detectors to the data fusion center. The overall decision is obtained on the basis of them -out-of-n fusion rule [17]. Assuming that the local detectors have the same performance characteristic, the false alarm probability of each detector is PfBGS and the detection probability of each detector isPdBGS. When them -out-of-nfusion rule is used, the overall false alarm probability of DTRN is given by
and the overall detection probability of DTRN is given by of-nfusion rule is the AND fusion rule.
4 Experiments and results
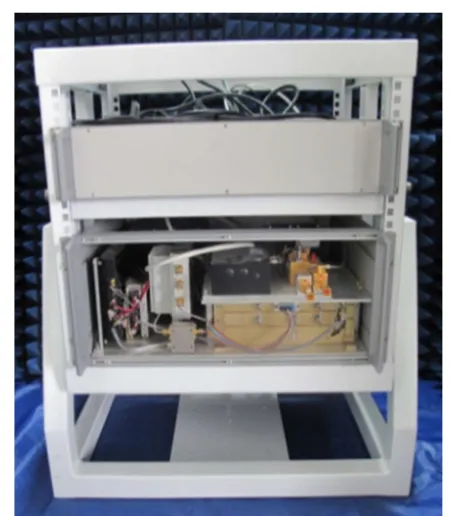
The terahertz radar system based on a solid-state source is shown in Fig. 5. The system operates at 0.34 THz with a bandwidth of 20 GHz which is adjustable [18].
The range-spread target is a metallic pistol model whose length is 14 cm, as shown in Fig. 1. The metallic pistol model is placed on the foam platform at a distance of 5 m off the radar. The high-resolution range profiles of the metallic pistol model in different radar views are markedly different, as shown in Fig. 6. The range profiles of the tar-get are extracted and occupy 33, 28, and 36 range cells in radar views 1, 2, and 3 respectively.
The range profiles of a person in 360◦ are considered the clutter data (the ground clutter and thermal noise are included). The range profiles of the 10,000th, 20,000th, 30,000th, and 40,000th pulse in the clutter data are shown in Fig. 7. Every range profile includes 200 range cells. The clutter is related to the distribution of scatterers on a person.
Fig. 5Image of the 0.34-THz radar system
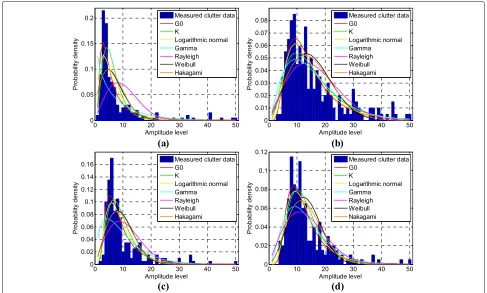
Rayleigh distribution, gamma distribution, G0
distri-bution,K distribution, Weibull distribution, logarithmic normal distribution, and Nakagami distribution curves are fitted against real clutter data, as shown in Fig. 8. The distribution of real clutter cannot be effectively rep-resented by any of these distribution models. By com-parison, the distribution of real clutter data fits the G0
distribution model better.
The radar echoes are synthesized by real range-spread targets data and real clutter data.Mrange profiles are ran-domly selected from the same group of real range-spread targets data. The range profiles of the range-spread tar-get are extracted from theseMrange profiles, and each of them is normalized. Meanwhile,Msequential range pro-files of clutter are randomly selected from real clutter data and each of them is normalized. Mrange profiles of the range-spread target and Mrange profiles of clutter are
synthesized intoMradar echo pulses. The SCR of each
synthesized radar echo pulse is calculated by the following formula:
where K0 is the starting position in which the
range-spread target is embedded in the clutter pulse, j =
1, 2,· · ·,Mdenotes thejth pulse. The synthesized data in different single-pulse SCRs are obtained by adjusting the value ofC0, whereC0is the overall scaling factor for the
amplitude of range-spread targets.C0does not influence
the distribution of scatterers on range-spread targets. As shown in Fig. 6, the lengths of the range-spread target in different radar views are estimated by the maximal SCR rule and the estimation values are 31, 16, and 33, respec-tively. The number of corresponding dominant scatterers is 7, 5, and 9 respectively. It means that scatterers whose normalized amplitude is more than 0.5 are distinguished as dominant scatterers. Otsu’s method is proved to be a valid approach to estimate the number of dominant scatterers on range-spread targets.
When the number of integration pulses and reference cells are different, the detection probability versus the single-pulse SCR for the BINGS detection and the binary integration parametric detector based on cell-averaging (CA)-CFAR (BIPCA-CFAR) detection for the false alarm probability PfBGS = 10−8 are shown in Fig. 9. Mis the
number of integration pulses. N is the number of
(a)
(b)
(c)
Fig. 6Range profiles of the metallic pistol model in different radar views.aRange profile in radar view 1.bRange profile in radar view 2.cRange profile in radar view 3
four-pulse repetition interval. Two or four pulses are con-sidered for integration, which would not lead to range cell migration of range-spread targets. Therefore, setting M
as 2 or 4 is reasonable. The BIPCA-CFAR detection is similar to the BINGS detection. The differences are that the CA-CFAR detection is used for each range cell within the sliding window and the distribution of real clutter data is assumed to be the G0 distribution model in the
BIPCA-CFAR detection.
The BIPCA-CFAR detection is incapable of maintaining CFAR when the assumed distribution model of clutter is inconsistent with the distribution of real clutter, as shown in Fig. 9a. The detection performance of the BINGS
detector is better, as shown in Fig. 9b. Comparing the detection performance curves in the case ofM=4,N =
12 with the case ofM=2,N= 12 for the BINGS detec-tor, more integration pulses result in the improvement in the detection performance. However, a high number of pulse integrations is not recommended, which will lead to range cell migration. Comparing the detection
perfor-mance curves in the case ofM = 2,N = 24 with the
case of M = 2, N = 12 for the BINGS detection, a
high number of reference cells leads to degradation of the detection performance. Thus, the number of integra-tion pulses and reference cells should be carefully chosen on the basis of the practical application environment. As
)
Fig. 8Clutter data fit to different distribution models. Amplitude distribution of clutter after the noncoherent integration ofathe 10,000th, 10,001th, 10,002th, and 10,003th pulse;bthe 20,000th, 20,001th, 20,002th, and 20,003th pulse;cthe 30,000th, 30,001th, 30,002th, and 30,003th pulse; anddthe 40,000th, 40,001th, 40,002th, and 40,003th pulse
shown in Fig. 9b, the detection performance of the BINGS detector in the case ofM=4,N=12 is superior.
We assume that DTRN consists of 3 terahertz radars and that the DTRN observes the same range-spread tar-get from different radar views. The BINGS detector is used as the local detector. The single-pulse SCR of these local detectors are equal. The other parameters are set as
PF =10−15,M=4, andN=12. Figure 10 represents the
detection performance curves of single radar and DTRN for different fusion rules. The detection performance of DTRN for the AND fusion rule and single radar is poorer than that of DTRN for the 2-out-of-3 fusion rule and the OR fusion rule. The detection probability of DTRN for the AND fusion rule remains at approximately 0.93 when the single-pulse SCR is high. The result shows that the prac-tical false alarm probability of DTRN for the AND fusion
-5 0 5 10 15 20 25
Fig. 10Detection performance of single radar and DTRN for different fusion rules
rule is higher than the theoretical false alarm probability (the false alarm probability is irrelevant to the single-pulse SCR). The theoretical false alarm probability must be set lower to control the practical false alarm probability.
Given the different detection ranges and radar views, the single-pulse SCR of the local detectors are consistently different. We assume that DTRN consists of 3 terahertz radars and that the DTRN observes the same range-spread target from different radar views. The BINGS detector is used as the local detector. The single-pulse SCR of the two detectors are equal, and the single-pulse SCR of the third detector is less than that of those two detectors by 5 dB. The other parameters are set as PF = 10−15,
M= 4, andN = 12. Figure 11 shows the detection
per-formance curves of DTRN for different fusion rules when the SCR of one local detector is different. The horizon-tal axis represents the single-pulse SCR of two detectors
-5 0 5 10 15 20 25
Fig. 11Detection performance of DTRN when the SCR of one detector is different
that have equivalent single-pulse SCR. By comparing the detection performance curves in Fig. 11 with those in Fig. 10, the detection performance loss of DTRN for the AND fusion rule is determined to be more than 4.5 dB. In addition, the detection performance loss of DTRN for the 2-out-of-3 fusion rule is approximately 3 dB, and the detection performance loss of DTRN for the OR fusion rule is less than 1 dB. The overall decision for the AND fusion rule relies on all the local binary decisions. When the SCR of one of three detectors worsens, the detection performance of DTRN for the AND fusion rule signifi-cantly deteriorates. When the SCR of the local detectors are highly different, the OR fusion rule is the optimal fusion rule.
5 Conclusions
In this study, a binary integration nonparametric detec-tion method based on the GS detector for range-spread targets in DTRN is proposed to detect person-borne concealed threats in range profiles. Experimental results show that the BINGS detector in DTRN is capable of not only observing range-spread targets from multiple views but also achieving effective detection for concealed threats under the circumstance of unknown clutter. If the single-pulse SCR of the local detectors are almost equal, then the m-out-of-nfusion rule is more appropriate for use. Meanwhile, when the single-pulse SCR of the local detectors are markedly different, using the OR fusion rule is recommended. The reasonable choice of the false alarm probability as well as the number of integration pulses and reference cells based on the practical application environment is a particular area of interest.
Acknowledgements
This work was supported by the National Natural Science Foundation of China under Grants U1433113, the National Nature Science Foundation of China under Grants 61301265, and the Fundamental Research Funds for the Central Universities under Grants ZYGX2015J020.
Competing interests
The authors declare that they have no competing interests.
Author details
1School of Electronic Engineering, University of Electronic Science and
Technology of China, No. 2006 Xi Yuan Avenue, Chengdu, China.2The Second Research Institute of Civil Aviation Administration of China (CAAC), No. 17, Second Section, Second Ring Road South, Chengdu, China.
Received: 30 April 2016 Accepted: 27 October 2016
References
1. KB Cooper, RJ Dengler, N Llombart, B Thomas, B Thomas, PH Siegel, THz imaging radar for standoff personnel screening. IEEE Trans. Terahertz Sci. Technol.1(1), 169–182 (2011)
2. S Gu, C Li, X Gao, Z Sun, G Fang, Terahertz aperture synthesized imaging with fan-beam scanning for personnel screening. IEEE Trans. Microw. Theory Tech.60(12), 3877–3885 (2012)
radar at 300 GHz with enhanced FoV. IEEE Trans. Microw. Theory Tech. 63(3), 1097–1107 (2015)
4. R Nitzberg, Effect of a few dominant specular reflectors target model upon target detection. IEEE Trans. Aerosp. Electron. Syst.AES-14(4), 670–673 (1978)
5. K Gerlach, MJ Steiner, FC Lin, Detection of a spatially distributed target in white noise. IEEE Signal Process. Lett.4(7), 198–200 (1997)
6. K Gerlach, MJ Steiner, Adaptive detection of range distributed targets. IEEE Trans. Signal Process.47(7), 1844–1851 (1999)
7. T Jian, Y He, F Su, C Qu, Cascaded detector for range-spread target in non-Gaussian clutter. IEEE Trans. Aerosp. Electron. Syst.48(2), 1713–1725 (2012)
8. S Xu, P Shui, X Yan, CFAR detection of range-spread target in white Gaussian noise using wave form entropy. Electron. Lett.46(9), 647–649 (2010)
9. A Aubry, A De Maio, L Pallotta, A Farina, Radar detection of distributed targets in homogeneous interference whose inverse covariance structure is defined via unitary invariant functions. IEEE Trans. Signal Process. 61(20), 4949–4961 (2013)
10. T Jian, Y He, F Su, C Qu, Adaptive range-spread target detection based on modified generalized likelihood ratio test in non-Gaussian clutter. IET Radar Sonar Navig.5(9), 970–977 (2011)
11. E Conte, AD Maio, G Ricci, GLRT-based adaptive detection algorithms for range-spread targets. IEEE Trans. Signal Process.49(7), 1336–1348 (2001) 12. Y He, T Jian, F Su, X Gu, Novel range-spread target detectors in
non-Gaussian clutter. IEEE Trans. Aerosp. Electron. Syst.46(3), 1312–1328 (2010)
13. JL Sanz-González, F Álvarez-Vaquero, Nonparametric rank detectors under K-distributed clutter in radar applications. IEEE Trans. Aerosp. Electron. Syst.41(2), 702–710 (2005)
14. H Chen, PK Varshney, S Kay, JH Michels, Noise enhanced nonparametric detection. IEEE Trans. Inf. Theory.55(2), 499–506 (2009)
15. W Sun, S He, G Guo, W Li, Z He, Adaptive range-cell integrated detection method with application. Acta Electronica Sinica.27(2), 111–112 (1999) 16. N Otsu, A threshold selection method from gray-level histograms. IEEE
Trans. Syst. Man Cybernet.9(1), 62–66 (1979)
17. EK Al-Hussaini, AM Al-Bassiouni, YA El-Far, Decentralized CFAR signal detection. Signal Process.44(1995), 299–307 (1995)
18. B Zhang, Y Pi, J Li, Terahertz imaging radar with inverse aperture synthesis techniques: system structure, signal processing, and experiment results. IEEE Sensors J.15(1), 290–299 (2015)
Submit your manuscript to a
journal and benefi t from:
7Convenient online submission
7Rigorous peer review
7Immediate publication on acceptance
7Open access: articles freely available online
7High visibility within the fi eld
7Retaining the copyright to your article