Structural design optimization for pedal operated paddy thresher
using response surface methodology
Shadad Md Khayer, Thaneswer Patel
*, Krishna Narayan Dewangan
(Department of Agricultural Engineering, North Eastern Regional Institute of Science & Technology (NERIST), Nirjuli – 791 109, Arunachal Pradesh, India)
Abstract: Paddy is the main crop in India grown in about 44 million ha area. Threshing of paddy is one of the most widely used
practices in India. Traditional methods of threshing are still prevalent in most of the parts of North-Eastern region. The farming community of the North-Eastern region faces some difficulties in adoption due to low productivity, inadequate design, and injuries during threshing. This study attempted to optimize the most significant design parameter of pedal operated paddy thresher (POPT) such as loop spacing, tip height, drum peripheral speed and number of strips in the periphery of drum to achieve the optimum threshing capacity using Response surface methodology (RSM) in Design Expert tool. From the analysis of variance (ANOVA), results indicated that the linear term of loop spacing and tip height; interaction term of drum peripheral speed and number of strips and the quadratic term of loop spacing and drum peripheral speed have more influence on the response (P<0.05). The coefficient of determination (R2) of the model was 0.95 which indicate a good fit between the predicted value and the experimental value. For machine parameter, optimize design dimensions are-loop spacing 3.99 cm, tip height 5.09 cm, drum peripheral speed 398.215 r min-1. and number of strips 13.9421(~14). At optimum condition of machine parameters, the threshing capacity was found approximately 53.0127 kg h-1 with minimal worker’s discomfort.
Keywords: paddy, threshing, POPT, machine parameters, RSM, optimize
Citation: Khayer S. M., T. Patel and K. N. Dewangan. 2019. Structural design optimization for pedal operated paddy thresher
using response surface methodology. Agricultural Engineering International: CIGR Journal, 21(1): 67–73.
1 Introduction
Rice (Oryza sativa L.) is the main crop in India grown in about 44.01 million ha area produces 105.30 million tonnes in 2011-2012 (Anonymous, 2015). India is one of the world's largest producers accounting for 20% of global rice production. The North-East (NE) regions with rich bio-diversity and varying agro-climatic conditions have tremendous potential to increase the productivity of rice. In the NE, 75% farmers are small and marginal farm holder (<2 ha) (Birthal et al., 2006) are not capable of purchasing higher machinery like power thresher, instead of its, farmers used to hire the machinery but which still
Received date: 2017-10-18 Accepted date: 2018-11-03
Corresponding author: Thaneswer Patel, Department of
Agricultural Engineering, North Eastern Regional Institute of Science and Technology (NERIST), Nirjuli (Itanagar) – 791109, Arunachal Pradesh, India. Email: [email protected]; Tel: +91-360- 2257401-08, Ex. 6263; Fax: +91-360-2257418.
not meeting the needs of the farmer. The land-to-person ratio for the NE region (0.68 ha person-1) is much higher than the national average (0.32 ha person-1) (Anonymous, 2011). Although NE continues to be a net importer of food grains as despite covering 8.8% of the country’s total geographical area, it produces only 1.5% of the country’s total food grain production (Patel et al., 2013). At present, it is estimated that farm power availability in the North-East region is 0.67 kW ha-1 which is much lower than the national average of 1.15 kW ha-1 (Kaul,
2001).
Traditional threshing methods trampling with humans and animals incur enormous losses (Belay et al., 2013). Increased rice production, the inefficiency of manual threshing, seasonal drudgeries of women worker and children, and subsequent losses require the implementation of improved threshing machines (Azouma et al., 2009). Farmers of NE mostly prefer to carry machine like the thresher by a single man for which machine weight should be less than 35 kg (Singh et al., 2008). Existing thresher available from this region (power as well as manual thresher) is not comfortable to fulfil the needs of NE farm workers. Due to non-availability of power thresher to every corner of NE area; threshing is still practised by pedal operated paddy thresher (POPT). However, many studies revealed that the threshing machine was responsible for severe injuries due to inadequate design. Many researchers have reported that threshing machines caused 2% of total agricultural injuries (Mohan et al., 1992) and the accident caused by threshers in four regions of India is about 14.6% (Nag et al., 2004) in a survey conducted in India. It was reported that more than 20% of the energy utilized for threshing activity alone (Satapathy and Sahay, 1998). Traditional methods of threshing require manpower input in the range of 80- 120 man-h ha-1 whereas pedal paddy thresher requires
about 35-40 man-h ha-1, which means considerable
savings in time and cost (Agrawal, 2008). The existing paddy thresher encountered problems of wrapping of paddy stalks due to the clearance between the drum and concave, inadequate threshing due to fewer numbers of strips on the periphery of the thresher drum. Thus, the objective of the present study is to optimize structural machine parameters to enhance maximum threshing capacity using response surface methodology (RSM) and central composite rotatable design (CCRD) techniques.
2 Materials and methods
A single variety of paddy was used to thresh in the nearest village, Harmuti, North Lakhimpur District, Assam. The moisture content of paddy during threshing was 20±2% (w.b.), and it was determined by universal moisture testing machine.
2.1 A brief description and measurement of existing
thresher
Several pedal operated paddy threshers are available in the Department of Agricultural Engineering, North Eastern Regional Institute of Science and Technology (NERIST), Arunachal Pradesh, India.
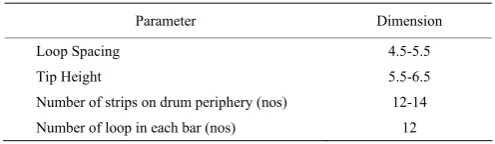
Table 1 Various dimensions of existing POPT
Parameter Dimension
Loop Spacing 4.5-5.5
Tip Height 5.5-6.5
Number of strips on drum periphery (nos) 12-14
Number of loop in each bar (nos) 12
Note: All the dimensions are in cm except otherwise mentioned.
The most important machine parameter which mostly influenced in paddy threshing along with their various dimensions is listed in Table 1. Although POPT is used in some part of NE region, however, the threshing output is not up to the mark as compared to traditional practice. Therefore, further modification is required for maximizing threshing output by changing the machine parameter through optimization considering threshing capacity as an output variable.
2.2 Central composite rotatable experiment design
A central composite design (CCD) with four independent variables, viz., loop spacing (X1), tip height
(X2), drum peripheral speed (X3) and number of the
horizontal bar in the periphery of the thresher drum (X4) at
three levels was performed by applying the Stat-Ease Design Expert v7.0.0 software. For this study, RSM, using a CCRD (Hunter, 1959; Rastogi et al., 1998; Das, 2005; and Myers, 1971) to fit a 2nd order polynomial equation, was employed. The CCRD of RSM is employed to fit 2nd order polynomial equation for a desirable and optimum solution among the four independent and one dependent variable (Singh et al., 2008). The values of loop spacing (X1) ranged from 3.5 to 5.5 cm, tip height (X2) ranged
from 4 to 6 cm, drum peripheral speed (X3) ranged from
300 to 500 r min-1 (Patel, 2015) and number of strips (X 4)
ranged from 12 to 14 as shown in Table 2. The limiting value of the independent variable was taken from the survey of the existing thresher and literature study. With the help of limiting values of independent variables, three different coded values viz. -1, 0 and +1 were selected. For analyzing data statistically, the variables were coded as given below (Sampaio et al., 2006).
i m i
D
X X
x
X − =
where, Xi is the uncoded value of the ith test variable; xi is
the coded value of the ith variable; Xm is the uncoded value
of the ith test variable at the center point and ΔXD is the step
change value (Singh et al., 2008).
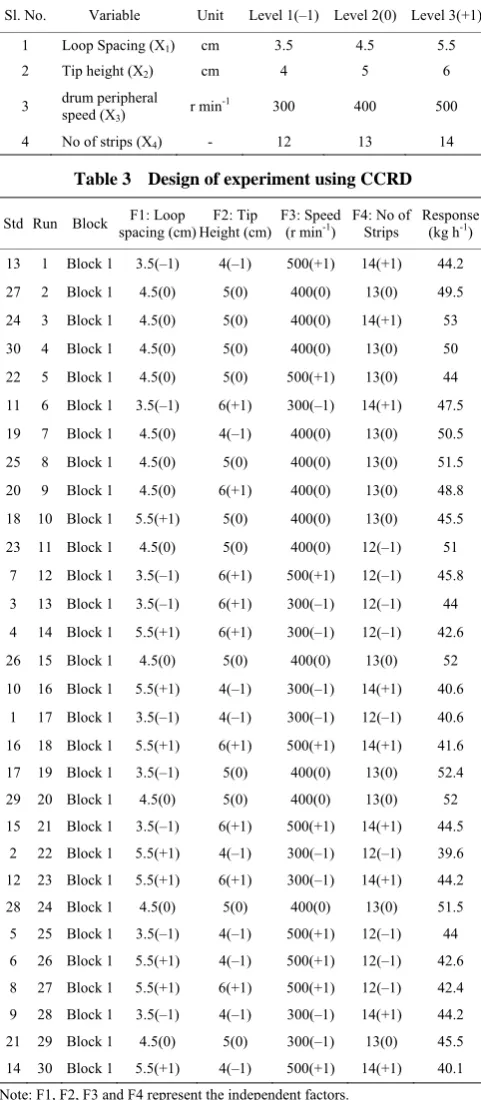
Table 2 Experimental design for conducting the study
Sl. No. Variable Unit Level 1(–1) Level 2(0) Level 3(+1)
1 Loop Spacing (X1) cm 3.5 4.5 5.5
2 Tip height (X2) cm 4 5 6
3 drum peripheral speed (X3) r min
-1 300 400 500
4 No of strips (X4) - 12 13 14
Table 3 Design of experiment using CCRD
Std Run Block F1: Loop spacing (cm)
F2: Tip Height (cm)
F3: Speed
(r min-1) F4: No of Strips Response(kg h-1)
13 1 Block 1 3.5(–1) 4(–1) 500(+1) 14(+1) 44.2
27 2 Block 1 4.5(0) 5(0) 400(0) 13(0) 49.5
24 3 Block 1 4.5(0) 5(0) 400(0) 14(+1) 53
30 4 Block 1 4.5(0) 5(0) 400(0) 13(0) 50
22 5 Block 1 4.5(0) 5(0) 500(+1) 13(0) 44
11 6 Block 1 3.5(–1) 6(+1) 300(–1) 14(+1) 47.5
19 7 Block 1 4.5(0) 4(–1) 400(0) 13(0) 50.5
25 8 Block 1 4.5(0) 5(0) 400(0) 13(0) 51.5
20 9 Block 1 4.5(0) 6(+1) 400(0) 13(0) 48.8
18 10 Block 1 5.5(+1) 5(0) 400(0) 13(0) 45.5
23 11 Block 1 4.5(0) 5(0) 400(0) 12(–1) 51
7 12 Block 1 3.5(–1) 6(+1) 500(+1) 12(–1) 45.8
3 13 Block 1 3.5(–1) 6(+1) 300(–1) 12(–1) 44
4 14 Block 1 5.5(+1) 6(+1) 300(–1) 12(–1) 42.6
26 15 Block 1 4.5(0) 5(0) 400(0) 13(0) 52
10 16 Block 1 5.5(+1) 4(–1) 300(–1) 14(+1) 40.6
1 17 Block 1 3.5(–1) 4(–1) 300(–1) 12(–1) 40.6
16 18 Block 1 5.5(+1) 6(+1) 500(+1) 14(+1) 41.6 17 19 Block 1 3.5(–1) 5(0) 400(0) 13(0) 52.4
29 20 Block 1 4.5(0) 5(0) 400(0) 13(0) 52
15 21 Block 1 3.5(–1) 6(+1) 500(+1) 14(+1) 44.5
2 22 Block 1 5.5(+1) 4(–1) 300(–1) 12(–1) 39.6 12 23 Block 1 5.5(+1) 6(+1) 300(–1) 14(+1) 44.2
28 24 Block 1 4.5(0) 5(0) 400(0) 13(0) 51.5
5 25 Block 1 3.5(–1) 4(–1) 500(+1) 12(–1) 44 6 26 Block 1 5.5(+1) 4(–1) 500(+1) 12(–1) 42.6
8 27 Block 1 5.5(+1) 6(+1) 500(+1) 12(–1) 42.4 9 28 Block 1 3.5(–1) 4(–1) 300(–1) 14(+1) 44.2 21 29 Block 1 4.5(0) 5(0) 300(–1) 13(0) 45.5 14 30 Block 1 5.5(+1) 4(–1) 500(+1) 14(+1) 40.1 Note: F1, F2, F3 and F4 represent the independent factors.
The loop spacing, tip height and number of strips with three levels of coded value were fabricated in the Department of Agricultural Engineering, NERIST, Arunachal Pradesh. For optimization of the machine parameters, a 2nd order polynomial equation (Equation (2))
was developed as a response (threshing capacity) for the coded value of independent parameters (Chen et al., 2012).
2 0
1 1
n n
i i ii i ij i j
i i i j
Y β βX β X β x x ε
= =
= +
∑
+∑
+∑∑
+ (2)The goodness of fit of the developed non-linear equations tested by F- value for lack of fit (LoF). The independent variables have fixed at three levels as per CCRD type experimental design, and a total number of 30 experiments were carried out as shown in Table 3.
3 Results and discussion
The investigation was carried out for threshing of paddy with different drum peripheral speed with a combination of tip height, loop spacing and strips to obtain the response against the independent variable. Response surface analysis applied to 30 experimental runs, and 2nd order polynomial response surface model (Equation (3)) fitted to response variables (threshing capacity). Regression analysis and ANOVA were carried out for fitting the model equation to examine the statistical significance of model terms. From the model summary statistics of the experiment, quadratic model was showing the R2 value of 0.953 a better one along with
adjusted R2 of 0.910 and predicted R2 of 0.819 and the quadratic model was significant (p<0.001) as shown in
Table 4. Lack of fit having F-value of 1.62 was
insignificant as the p>0.05 imply that the quadratic model was found significant and this model was sufficiently accurate for predicting the response (Table 5). From the ANOVA analysis, the linear term of loop spacing (A) and tip height (B); interaction term of drum peripheral speed (C) and number of strips (D), and the quadratic term of spacing (A2) and drum peripheral speed (C2) has more influence on the response. The coefficient of
determination (R2) of the model was 0.953, which
indicates a good fit between the predicted value and the experimental value. Further, it also implies that the independent variable explains 95.33% of the variation for threshing capacity. The mathematical expression in a change of the threshing capacity with different variables
A, B, C and D were well fitted to the 2nd order
polynomial equation as shown in Equation 3 with R2 of
2 2 2 2
50.95 1.56 0.83
0.022 0.41 0.056 0.16
0.42 0.62 0.044
0.88 1.87 1.17 6.07
1.18
Threshing Capacity A B
C D A B A C
A D B C B D
C D A B C
D
= − × + × +
× + × − × × − × × −
× × − × × + × × −
× × − × − × − × +
×
(3)
Table 4 Model summary statistics
Source Std. Dev. R2 Adjusted R2 Predicted R2 PRESS
Linear 4.29 0.113 –0.0281 –0.2427 645.00
2FI 4.80 0.155 –0.2885 –1.9032 1506.8
Quadratic 1.27 0.953 0.9097 0.8192 93.82 Suggested
Cubic 0.95 0.987 0.9494 0.7447 132.51 Aliased
Note: PRESS stands for predicted residual error sum of squares.
Table 5 ANOVA for response surface quadratic model
Source Sum of Square df SquareMean F value p-value Prob>F
Model 494.76 14 35.34 21.86 <0.0001 Significant
A- loop spacing 43.56 1 43.56 26.94 0.0001
B-tip height 12.50 1 12.50 7.73 0.014 C-drum peripheral
speed 0.0089 1 0.008889 0.005499 0.9419 D- No of strips 2.96 1 2.96 1.83 0.1960
AB 0.051 1 0.051 0.031 0.8619
AC 0.39 1 0.39 0.24 0.6301
AD 2.81 1 2.81 1.74 0.2075
BC 6.13 1 6.13 3.79 0.0706
BD 0.031 1 0.031 0.019 0.8924
CD 12.43 1 12.43 7.69 0.0142
A2 9.08 1 9.08 5.62 0.0316
B2 3.56 1 3.56 2.20 0.1586
C2 95.52 1 95.52 59.09 <0.0001
D2 3.60 1 3.60 2.22 0.1566
Residual 24.25 15 1.62
Lack of Fit 18.54 10 1.85 1.62 0.3086 Insignificant
Pure Error 5.71 5 1.14
Total 519.01 29
3.1 Variation of threshing capacity with independent
variables
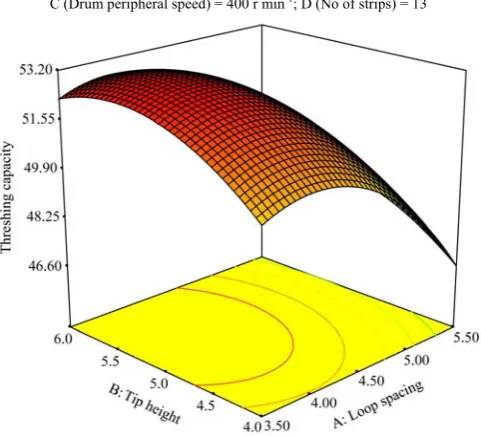
From the above relation between the response and independent variable, it clearly shows that threshing capacity (Response) was directly related to every independent parameter. It observed from the Figure 1 that at fixed value of speed (400 r min-1) and number of strips (13), threshing capacity increased slowly with loop spacing up to 4 cm (approx.) and decreasing thereafter, achieving the maximum response of capacity at about 52.6 kg h-1. Similarly, at same condition, it increased with
tip height up to 5.3 cm (approx.) and reduced thereafter. At a fixed value of tip height (5 cm) and number of strips
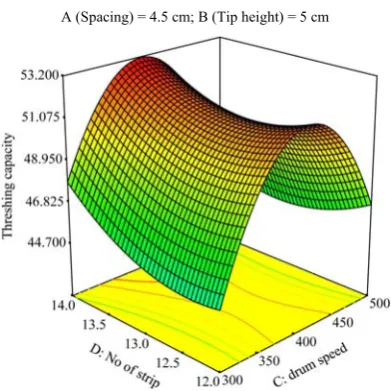
(13), threshing capacity was slightly increased with loop spacing up to 4 cm but decreased abruptly thereafter with increasing the spacing (Figure 2), and at this stage, maximum capacity with peripheral speed was observed at around 390 r min-1. and decreased thereafter. Again at fixed value of loop spacing (4.5 cm) and number of strips (13), threshing capacity increased gradually with tip height up to 5.8 cm (approx.) and decreased gradually. At same condition, it increased with drum peripheral speed up to 400 r min-1. (approx.) and reduced thereafter (Figure 3). At fixed value of loop spacing (4.5 cm) and tip height (5 cm), threshing capacity increased gradually with drum peripheral speed 400 r min-1. (approx.) and decreased thereafter, and it decreased with number of
strips up to 13 r min-1. (approx.) and increased
thereafter (Figure 4). Threshing capacity is maximum at loop spacing of 4 cm (approx.) with the number of strips in between 13 and 14 when other two parameters are in constant (i.e. tip height = 5 cm and drum peripheral speed
= 400 r min-1) and decreases gradually (Figure 5).
Similarly, threshing capacity found maximum around tip height of 5.5 cm with 14 numbers of strips (approx.) at a constant spacing of 4.5 cm and drum peripheral speed of 400 r min-1. and decreases slowly with varying the tip
height and number of strips (Figure 6). These were the probable findings towards the best optimal condition for the existing pedal thresher.
C (Drum peripheral speed) = 400 r min-1; D (No of strips) = 13
Figure 1 Effect of loop spacing (cm) and tip height (cm) on threshing capacity at optimum drum peripheral speed (400 r min-1)
B (Tip height) = 5 cm; D (No of strips) = 13
Figure 2 Effect of loop spacing (cm) and drum peripheral speed (r min-1) on threshing capacity at optimum height (5 cm) and No of
strips (13)
A (Spacing) = 4.5 cm; D (No of strips) = 13
Figure 3 Effect of tip height (cm) and drum peripheral speed (r min-1) on threshing capacity at optimum loop spacing (4.5 cm) and
No of strips (13)
A (Spacing) = 4.5 cm; B (Tip height) = 5 cm
Figure 4 Effect of No of strips and drum peripheral speed (r min-1) on threshing capacity at optimum height (5 cm) and loop spacing
(4.5 cm)
B (Tip height) = 5 cm; C (Drum peripheral speed) = 400 r min-1
Figure 5 Effect of loop spacing (cm) and No of strips on threshing capacity at optimum height (5 cm) and drum peripheral speed
(400 r min-1)
A (Spacing) = 4.5 cm; C (Drum peripheral Speed) = 400 r min-1
Figure 6 Effect of No of strips and tip height (cm) on threshing capacity at optimum drum peripheral speed (400 r min-1) and loop
spacing (4.5 cm)
3.2 Desirability function approach towards the
optimum response
The desirability function approach is a technique for simultaneous determination of optimum settings of input variables that can determine optimum performance levels for one or more responses. It was introduced by Harrington (1965).
The general approach is to first convert each response (yi) into an individual desirability function (di) over the
range.
0 ≤ di≤ 1
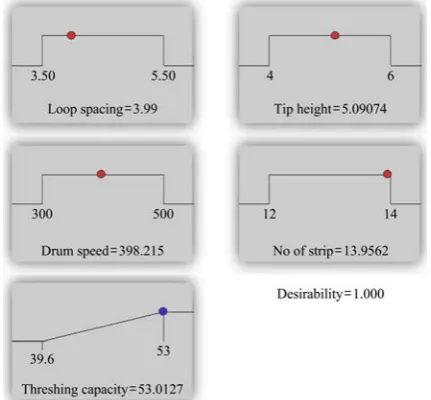
threshing capacity with respect to four independent variables having a maximum desirable value of 1.0 as shown in Figure 7.
(Unit of parameter: loop spacing in cm; tip height in cm; drum speed in r min-1)
Figure 7 Desirability ramp for optimization 3.3 Optimization of design parameter
From the selected design parameters, optimize dimensions are loop spacing=3.99 cm, tip height=5.09 cm, drum peripheral speed = 398.215 r min-1 and number of strips = 14. The maximum threshing capacity for optimize independent variables was found 53.0127 kg h-1 (Figure 8). The findings of the optimization study i.e. threshing capacity and developed model was found comparable with work carried out by other researchers in agriculture and allied science (Goyal et al., 2008; Zhang et al., 2007; Mangaraj et al., 2011; Pratape et al., 2004; and Rastogi et al., 1998). Further, similar approach was also carried out for paddy thresher by Singh et al. (2008) and inferred that wire loop geometry and speed of the drum have a significant effect on the threshing efficiency.
Figure 8 Overlay plot for optimizing threshing capacity
4 Conclusions
This paper presents the application of response surface methodology for optimizing the most significant design parameters of pedal operated paddy thresher. The experiment investigated into the effect of loop spacing, tip height, drum peripheral speed and number of the strips in the periphery of the drum on the threshing capacity of POPT. The outcome of the investigation revealed that loop spacing = 3.99 cm, tip height = 5.09 cm, peripheral drum speed = 398.215 r min-1 and number of strips on the periphery of the rotating drum =13.9421(~14) were the significant factors influencing the threshing capacity investigated. Among the four independent parameters, most considerable influence on threshing capacity was a linear term of loop spacing (A) and tip height (B); the quadratic term of spacing (A2) and speed of the drum (C2) and an interaction term of drum peripheral speed and number of strips (CD). The quadratic models developed using RSM were reasonably accurate and can be used for prediction within the limits of the factors considered for investigation.
Nomenclature
ha hectare
kW ha-1 Kilowatt/hectare
w.b. Wet basis
No number cm centimeter
F-test Fisher test
df Degree of freedom
Xi Uncoded value
xi Coded value
Xm Uncoded value at center point
XD Steep change
Y Threshing capacity
v7 Version 7
Kg h-1 Kilogram/hour
βo Constant coefficient
βi Linear coefficient
βij Interaction coefficient
Xi Coded value of independent parameter
Xii Quadratic term of independent parameter
Xij Interaction term of independent parameter
Ɛ Experimental error
r min-1 Revolution per minute NE North-East Eqn Equation
References
Agrawal, K. N. 2008. Design modification of pedal operated paddy thresher for Northeastern hilly region of India. Ph.D. thesis., Department of agricultural and food engineering, Indian Institute of Technology, Kharagpur, West Bengal, India. Anonymous. 2011. Regional Project Implementation Plan. North
East Rural Livelihood Project. Ministry of DONER, Govt. of India. Available at: http://www.mdoner.gov.in. Accessed 9 January 2017.
Anonymous. 2015. Agricultural Statistics at a Glance 2015. Department of Agriculture and Cooperation and Farmers Welfare, Ministry of Agriculture and Farmers Welfare, Government of India.
Azouma, O. Y., M. Porosi, and K. Yamaguchi. 2009. Design of throw-in type rice thresher for small scale farmers. Indian Journal of Science and Technology, 2(9): 10–14.
Belay, Z. A., A. Fanta, and S. Abera. 2013. Effects of parboiling treatment on the milling quality of selected rice varieties.
Journal of Post-Harvest Technology, 1(1): 60–68.
Birthal, P. S., A. K. Jha, P. K. Joshi, and D. K. Singh. 2006. Agricultural diversification in North eastern region of India: Implications for growth and equity. Indian Journal of Agricultural Economics, 61(3): 328.
Chen, G., J. Chen, C. Srinivasakannan, and J. Peng. 2012. Application of response surface methodology for optimization of the synthesis of synthetic rutile from titania slag. Applied Surface Science, 258(7): 3068–3073.
Das, H. 2005. Food Processing Operations Analysis. Asian books private limited, New Delhi, India.
Goyal, R. K., R. K. Vishwakarma, and O. D. Wanjari. 2008. Optimisation of the pigeon pea dehulling process. Biosystems Engineering, 99(1): 56–61.
Harrington, E. C. 1965. The desirability function. Industrial Quality Control, 21(10): 494–498.
Hunter, J. S. 1959. Determination of optimum operating conditions by experimental methods. Industrial Quality Control, 15(8): 6–11.
Kaul, G. L. 2001. Strategies for agricultural research in the North-East. Policy paper 9. New Delhi, India: National Academy of Agricultural Sciences.
Mangaraj, S., and K. P. Singh. 2011. Optimization of machine parameters for milling of pigeon pea using RSM. Food and Bioprocess Technology, 4(5): 762–769.
Mohan, D. and R. Patel. 1992. Design of safer agricultural
equipment: Application of ergonomics and epidemiology.
International Journal of Industrial Ergonomics, 10(4): 301–309.
Myers, R. H. 1971. Response Surface Methodology. Boston, MA: Allyn and Bacon: 256.
Nag, P. K., and A. Nag. 2004. Drudgery, accidents and injuries in Indian agriculture. Industrial Health, 42(2): 149–162.
Patel, T., S. Karmakar, J. Sanjog, S. Kumar, and A. Chowdhury. 2013. Socio-economic and environmental changes with transition from shifting to settled cultivation in North-Eastern India: an ergonomics perspective. International Journal of Agricultural Science and Research, 3(2): 117–136.
Patel, T. 2015. Ergonomic design modification of ‘pedal operated paddy thresher’ adoptable for agricultural needs of North-east India. Unpublished Ph.D. diss., Indian Institute of Technology, Kharagpur, India.
Paulsen, M. R., P. K Kalita, and K. D. Rausch, (2015). Postharvest losses due to harvesting operations in developing countries: a review. In 2015 ASABE Annual International Meeting, American Society of Agricultural and Biological Engineers. 562–596, New Orleans, Louisiana, 26-29 July.
Pratape, V. M., V. B. Sashikala, and H. V Narasimha. 2004. Mini Dhal Mill-an appropriate technology for Indian rural areas for processing of pulses. Journal of Rural Technology, 1(2): 87–90.
Rastogi, N. K., G. Rajesh, and T. R. Shamala. 1998. Optimization of enzymatic degradation of coconut residue. Journal of the Science of Food and Agriculture, 76(1): 129–134.
Sampaio, F. C., D. De Faveri, H. C. Mantovani, F. M. L. Passos, P. Perego, and A. Converti. 2006. Use of response surface methodology for optimization of xylitol production by the new yeast strain Debaryomyces hansenii UFV-170. Journal of Food Engineering, 76(3): 376–386.
Satapathy, K. K., and C. S. Sahay. 1998. Energy management and farm tools of north-East hill region, Research Bulletin No-46. Umroi Road, Umiam, Meghalaya: ICAR research complex for North–East Hill Region.
Singh, K. P., I. L. Pardeshi, M. Kumar, K. Srinivas, and A. K. Srivastva. 2008. Optimisation of machine parameters of a pedal-operated paddy thresher using RSM. Biosystems Engineering, 100(4): 591–600.