http://www.sciencepublishinggroup.com/j/ijmsa doi: 10.11648/j.ijmsa.s.2018070101.13
ISSN: 2327-2635 (Print); ISSN: 2327-2643 (Online)
Preparation and Characterization of Phosphate Material
Doped with Chromium
Youssef Makhkhas
1, Saida Krimi
2, Mohamed Taibi
3, El Hassan Sayouty
11Faculty of Science, High Energy and Condensed Matter Lab, Hassan II University of Casablanca, Casablanca,Morocco 2
Faculty of Science, Physico Chemistry of Inorganic Materials Lab, Hassan II University of Casablanca, Morocco
3Ecole Normale Supérieure de Rabat, Physico Chemistry of Inorganic and Organic Materials Lab, Université Mohammed V, Rabat, Morocco
Email address:
[email protected] (Y. Makhkhas), [email protected] (El H. Sayouty), [email protected] (S. Krimi), [email protected] (M. Taibi)
To cite this article:
Youssef Makhkhas, Saida Krimi, Mohamed Taibi, El Hassan Sayouty. Preparation and Characterization of Phosphate Material Doped with Chromium. International Journal of Materials Science and Applications. Special Issue: Energy and Materials II.
Vol. 7, No. 1-1, 2018, pp. 11-17. doi: 10.11648/j.ijmsa.s.2018070101.13
Received: October 1, 2017; Accepted: October 10, 2017; Published:November 7, 2017
Abstract:
The paper reports a study on phosphate glasses containing Chromium, Iron and Sodium oxides. The phosphate glasses have been obtained in air by direct melting of Cr2O3, Fe2O3, Na2CO3, and (NH4)2HPO4. The preparation temperature is1020°C. After annealing at 650°C for 48h, the glasses were partially crystallized and contained β-CrPO4 and Fe3(P2O7)2
crystalline phases. We have performed the measurement of X-Ray diffraction, and Infra-Infra-Red spectroscopy. The differential
scanning calorimetry (DSC) was used in this work to determine the glass transitionand the crystallization temperatures (Tg and
Tc). We noticed that the Tg and Tc depends on the composition of the samples. The chemical durability was evaluated by weight losses of glass samples after immersion in hot distilled water at 90°C for 30 days. Weight loss measurements showed a good chemical durability against water and enhance the glass capacity to embed different chemical compounds. The density and molar volume were also measured.
Keywords:
Chemical Durability, IR Spectroscopy, Differential Scanning Calorimetry, Glass Formation, Sodium-Chromium-Iron-Phosphate Glasses, XRD1. Introduction
In the last years, phosphate glasses have been studied for their interesting properties [1, 2]. Recent studies of iron phosphate glasses have shown that the addition of iron to sodium phosphate glasses had a significant effect on the glass transition temperature, thermal expansion coefficient and chemical durability [3]. It has been suggested that the chemical durability of iron phosphate glasses is attributed to the replacement of P-O-P bonds by more water resistance P-O-Fe bonds [4]. The properties of phosphate glasses are largely determined by the cation additives used in their production, with di and multivalent ionic species having a more drastic effect [5-7]. Iron in particular has a strong effect on phosphate glasses, with these glasses demonstrating extremely good resistance to hydrolysis. Indeed the durability of some iron glass formulations has been shown to exceed that
of normal window glass [1–2], which has led to the consideration of these glasses for applications as extreme as long-term containment of high-level nuclear waste [5, 8–9].
2. Materials and Methods
The glasses of compositions
(26-y)Fe2O3-yCr2O3-19Na2O-55P2O5 (mol %), with (0≤y≤4)
are obtained by the melting quench method at 1020°C. The corresponding mixture with compounds Na2CO3, Fe2O3,
Cr2O3 and (NH4)2HPO4 is introduced in porcelain crucible and
then heated for 24 hours. Appropriate amounts of material were shown in Table 1.
The dissolution rates (DR) of the analyzed glasses are also
given in Table 1, measured from the weight loss experiments conducted in distilled water at 90°C.
Table 1. Compositions, chemical durability of (26-y)Fe2o3-yCr2O3-19Na2O-55P2O5 (mol%). with (0≤y≤4) glasses with the ratio (o/p)=3,38.
Starting glass composition (mol %) (DR) (g/cm3/mn)
Fe2O3 Cr2O3 Na2O P2O5 30 days
26 0 19 55 (3,042±0,001)*10-9
25 1 19 55 (3,041±0,001)*10-9
24 2 19 55 (3,040±0,001)*10-9
23 3 19 55 (3,034±0,001)*10-9
22 4 19 55 (3,031±0,001)*10-9
3. The Synthesis Reaction of Glasses
Figure 1. The synthesis reaction of the glasses.
The melting was achieved in porcelain crucibles for about 30 min at 1020±10°C. The isolated glasses samples have an approximate diameter of 10 mm and 3 mm in thickness. The densities were determined on bulk of glasses by the
Archimedes’ method at room temperature using diethyl phthalate as fluid [8]. The samples were immersed in a flask filled with 100 ml of distilled water at 90°C for 30 days. The dissolution rate (DR) was then determined from the weight
loss during the aqueous treatment at 90°C.
R
D = m
2
(g)
S(cm ) * t(min)
∆
(1)
Where ∆m = The difference in mass weighed
S = the surface of the aqueous attack
t = time
4. Heat Treatment
Figure 2 shows the heat treatment of the glassy system.
Figure 2. Thermal treatment carried out for the preparation of the glasses.
After 24 hours the samples were removed from the furnace, swirled to homogenise the melt and then cast onto a polished
5. Density Measurments
The density was obtained by employing the relation:
glass
ρ = air ortho
air ortho ( ortho glass)
m
m (m m + )
×ρ
+ −
(2)
Where mair is the weight of glass sample in air, mortho is the
weight of diethyl orthophthalate only, m(ortho + glass) is the
weight of glass immersed in diethyl orthophthalate and ρortho is
density of the buoyant
≈
(1,11422 g/cm³). All themeasurements were made using a digital balance (contech). In case when sample reacts with water, a suitable inert liquids such as diethyl orthophthalate, xylene, toluene etc, can be selected as the immersion medium.
6. Molar Volume Calculation
The molecular weight of the glass was also calculated as described below and using these molecular weights and
density, the molar volume of the glass samples can be calculated from the following expression:
m M
V = ρ (3)
Where, Vm is the molar volume, ρ is the density of the
sample and M is the molecular weight of the sample. In the present immersion fluid and the reported density values are the average of at least three independently measured values.
OM
V =
Na O
M N
ρ × (4)
2 cal
r (O )− = 3
OM
1
(V )
2 (5)
M= molar mass, ρ= density, NA= Avogadro’s constant,
NO= number of atoms of oxygen
VOM= molar volume of oxygen
cal
r = calculated ionic radius of oxygen
Table 2. Characteristics of the glasses.
N° de série
La composition molar mass
(g/mol)
Density ρ
(g/cm3) molar volume
Number of
oxygen atoms ionic radius Fe2O3 Cr2O3 Na2O P2O5
0 26 0 19 55 131,44 2.66 20.22 372 1.4022
1 25 1 19 55 131,36 2.68 20.05 372 1.4018
2 24 2 19 55 131,28 2.70 19.89 372 1.4014
3 23 3 19 55 131,20 2.72 19.73 372 1. 4012
4 22 4 19 55 131,12 2.74 19.52 372 1.4010
The evolution of the density of the glasses as a function of chromium rate is shown in Figure 3. We observe a
monotonous increase, from 2.66 to 2.74 g / cm3 with y which
could translate crosslinking of the network under the effect of the addition of Cr2O3. To verify this interpretation, we have
chosen to study the evolution of the molar volume deduced from the density by the relation 3:
Figure 3. Evolution of the density (ρ) of the glasses (26-y)Fe2o3-yCr2O3-19Na2O-55P2O5 with 0≤y≤5 as a function of the
chromium (y) content.
Figure 4. Evolution of the molar volume of the glasses (26-y)Fe2O3-yCr2O3-19Na2O-55P2O5 with 0≤y≤4 as a function of the
chromium (y) content.
Figures 2 and 3 shows respectively the variation of the density and the molar volume of the glasses of compositions (26-y) Fe2O3-yCr2O3-19Na2O-55P2O5, with 0≤y≤4. We note
in the case of this glass system that the density increases and the molar volume decreases continuously as the chromium oxide level increases.
The evolution of the density is due to the molar masses of Cr2O3 (151.99 g / mol) and Fe2O3 (159.69 g / mol) which are
0 1 2 3 4
higher than that of Na2O (61.9789 g / mol). The decrease in the
molar volume shows that the glasses become more and more compact.
Indeed, the evolution of the molar volume (VM) (or the
molar volume occupied by an oxygen atom), as a function of the oxide content introduced into the glass, reflects the effect of this oxide within the vitreous network. If the molar volume remains constant, it can be said that the introduced cation is placed in the cavities of the network, this phenomenon is well
observed when ZnO is introduced into NaPO3 [16]. A decrease
in VM shows that the cations introduced reinforce the network
with one contraction of the oxygen ion stack. Conversely, an increase in VM is indicative of an expansion of the network.
This case was observed by Delahaye et al. by studying the glasses of the system 50P2O5- (50-y) Na2O-yCaO [17].
The value of the O / P ratio of the studied glasses is also calculated and grouped in Table 3.
Table 3. Glasse composition and the with the (O/P) ratio.
Composition initial du matériau (mol %) [O/P]
Fe2O3 Cr2O3 Na2O P2O5
26 0 19 55 3,3818 25 1 19 55 3,3818 24 2 19 55 3,3818 23 3 19 55 3,3818 22 4 19 55 3,3818
7. Results and Discussion
(a)XRD study
The X-ray diffraction analysis was used to confirm the amorphous state of the samples. The annealing of the glasses was realized at 650°C for 48 hours. The first structural approach was made using X-rays diffraction.
XRD studies were carried out in order to get an idea about the structure of (26-y)Fe2O3-yCr2O3-19Na2O-55P2O5 (mol%)
with (0≤y≤4) glasses and to investigate the amorphous state of the prepared glasses before annealing.
Figure 5. XRD of the (26-y)Fe2O3-yCr2O3-19Na2O-55P2O5 sample (before annealing).
No crystalline phase was detected by X-ray in the glass composition (26-y)Fe2O3-yCr2O3-19Na2O-55P2O5 (mol%)
with (0≤y≤4) before annealing (Figure 3). Whereas after annealing at 650°C, we notice the existence of crystalline micro domain in the samples (Figure 4) which means that the crystallization of the glass was just starting [18]. This observation comes from the appearance of some peaks related to the Na2FeP2O7 phase, and some non-identified peaks.
(b)IR spectroscopy
Figure 5 represents the IR spectra of
(26-y)Fe2O3-yCr2O3-19Na2O-55P2O5 (mol%) with (0≤y≤4)
glasses.
Figure 7. IR spectra of the samples.
In Figure 5 the bands at 1368 cm-1, 1329 cm-1 and 1260 cm-1 are a characteristic feature of the symmetric stretching
vibration of the νs(PO3). The bands at, 895 cm
-1
, 934 cm-1, 952 cm-1, are attributed to the asymmetric stretching vibration of the ν − −asP O P [20] and 880 cm
-1
was assigned to symmetric stretching vibration of ν − −sP O P [18,19].
While the bands at 703 cm-1 and 694 cm-1 are attributed to the symmetric stretching vibration of P–O–P linkages,
sP O P
ν − − . The absorption band at 640 cm-1 may be due to the bending mode of PO4 units.
(c)Differential Scanning Calorimetry (DSC)
Tg (glass transition temperature) and Tc (crystallization temperature) were determined by DSC 121 SETRAM instrument. Data acquisition and processing was done using SetSoft software, using a heating rate of 10°C/min (20°C to 800°C).
A mass of 28 mg of crushed sample were placed in a platinum crucible then heated from 20°C to 800°C at a heating rate of 10°C/min under an argon atmosphere.
The DSC thermograms of the
(26-y)Fe2O3-yCr2O3-19Na2O-55P2O5 (mol%) with (0≤y≤4)
glasses compositions are shown in Figure 6.
Figure 8. DSC thermograms of the glass composition (26-y)Fe2O3-yCr2O3-19Na2O-55P2O5 (mol%) with (0≤y≤4).
In the case of (26-y)Fe2O3-yCr2O3-19Na2O-55P2O5 (mol%) with (0≤y≤4) glasses, the substitution of Fe2O3 by Cr2O3, is
manifested by a decrease in glass transition temperatures Tg and increase of the crystallization temperature Tc. After the examination of the values of Tg, Tc and Tc-Tg (Table 3) we could make the following observations:
Table 4. Values of Tg, Tc and Tc-Tg of the glasses compositions (26-y)Fe2O3-yCr2O3-19Na2O-55P2O5 (mol%) with (0≤y≤4).
composition Tg(±5°C) Tc(±5°C) Tc-Tg
As we can see from the table 3 the glass transition temperature Tg is decreasing when the chromium content increases in the glass series whereas the crystallization temperature Tc is increases.
This study of DSC shows then a good thermal stability that we can deduce from the subtraction Tc-Tg [21].
(d)Chemical durability
The chemical durability of the glasses compositions glasses
with approximate size of 1×1×1cm3 was evaluated by weight
loss measurements from glasses exposed to beaker containing 100 ml of distilled water at 90°C for 30 days. Glasses were polished to 600 grit, finished with SiC paper, and cleaned with acetone.
The measurements were conducted for each glass and the
average dissolution rate (DR), normalized to the glass surface area
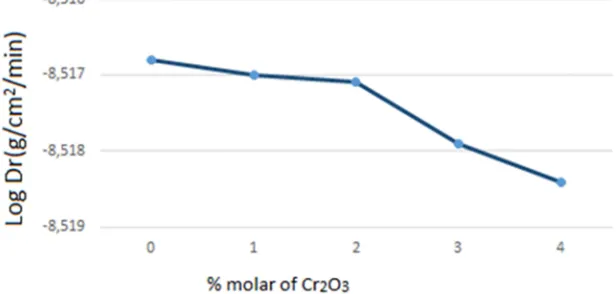
and the corrosion time was calculated from the weight loss. From the two curves below it is noted that the aqueous dissolution rate decreases slightly with increasing rate of Cr2O3 in the glass system, but this decrease still very low that
can be assumed to remain the same( 9
R
D ≈10− ).
In general the chemical durability for phosphate glasses improves with the increase in Iron and Chromium content, however the indecreasing of chemical durability could be attributed to the replacement of P–O–P bonds by P–O–Fe and P–O–Cr bonds. The presence of P–O–Fe bonds in higher concentration makes the glass more hydration resistant. The P–O–Cr bonds seem to play the same role than P–O–Fe ones.
Figure 9. Logarithm of the dissolution rate as a function of the number of days in distilled water.
Figure 10. Logarithm of the aqueous dissolution rate as a function of % Cr2O3.
8. Conclusion
The investigations performed on the samples of
(26-y)Fe2O3-yCr2O3-19Na2O-55P2O5 (mol%) with
(0≤y≤4)glass allowed to formulate the following statements: a. The X-ray diffraction investigations revealed that the
studied materials were in amorphous state, and probably inform about existence of different amorphous states in samples with various content of chromium and iron. On the other hand many crystalline materials can be formed after annealing.
b.Infrared absorption spectra of
(26-y)Fe2O3-yCr2O3-19Na2O-55P2O5 (mol%) (mol %),
with (0≤y≤4) glasses, have been studied in the region of
400–1500 cm−1. The spectra were analyzed to determine
the relative intensity of the IR bands responsible for the different phosphate units.
c. After washing crucibles containing glass samples with in
HCl solution at 200°C, we noticed that the prepared glasses have exceptionally good chemical durability and low dissolution even against acides in high temperature, which make them a good candidate for matrix to immobilization of radioactive waste.
e. The DSC study shows a good thermal stabily of the glass
composition with increasing Cr2O3 in the sodium
chromium-iron phosphate glasses.
Acknowledgements
This work is supported by the Physico Chemistry of Inorganic Materials Lab, we thank R. Ait Mouss, and M. Oubela for their advices.
References
[1] B. C. Sales, M. M. Abraham, J. B. Bates and L. A. Boat- ner, “Structural Properties of Lead-Iron Phosphate Glass- es,” Journal of Non-Crystalline, Vol. 71, 1985, pp. 103- 112. http://dx.doi.org/10.1016/0022-3093(85)90279-0
[2] B. C. Sales and L. A. Boatner, “Physical and Chemical Characteristics of Lead-Iron Phosphate Nuclear Waste Glasses,” Journal of Non-Crystalline Solids, Vol. 79, 1986, pp. 83-116. http://dx.doi.org/10.1016/0022-3093(86)90040-2
[3] X. Yu, D. E. Day, G. J. Long, R. K. Brow, J. Non-Cryst. Solids 215 (1997) 21.
[4] R. K. Brow, C. M. Arens, X. Yu, D. E. Day, Phys. Chem. Glasses 35 (1994) 132.
[5] Y. Makhkhas, S. Aqdim, E. H. Sayouty “Study of Sodium-Chromium-Iron-Phosphate Glass by XRD, IR, Chemical Durability and SEM” Journal of Materials Science and Chemical Engineering 2013, 1, 1-6.
[6] R. K. Brow, J. Non-Crist. Solids 263&264(2000) 1.
[7] J. Clement, J. M. Manero. J. A. Panell, G. Avila, S. Martinez, J. Mater. Sci. Mater. Med. 10(1999) 729.
[8] Y. Makhkhas and E. H. Sayouty “CHEMICAL DURABILITY AND CHARACTERIZATION OF THE PHOSPHATE GLASSES CONTAINING IRON, SODIUM AND CHROMIUM” International Journal of Advances in Chemistry (IJAC) Vol. 2, No. 1, 23-29.
[9] D. E. Day, Z. Wu, C. S. Ray, P. Hrma, J. Non-Cryst. Solids 241 (1998) 1.
[10] T. Yamashita, S. Hayashi, M. Yoshida, Method for manufacturing precision glass spheres and method for manufacturing optical glass elements, 2005 (Patent Nos. JP2005272292, US2005210923).
[11] N. Kopylov, A. Kortan, Method for manufacturing phosphate glass-coated fluoride glass optical fibers, 1999 (Patent No. US5858052).
[12] J. Iseki, H. Higata, T. Yamanaka, Glass for sealing and sealing material which uses it, 2002 (Patent No. JP2002037644). [13] T. Ishidoya, Y. Minoura, Dosimeter glass element method for
manufacturing same and dosimeter holder, 2003 (Patent Nos. JP2003073137, US2003071229).
[14] E. Daniela, D. Cacaina, M. Coldea, M. Valeanu, S. Simon, J. Magn. Magn. Mater. 293 (2005) 310.
[15] E. A. Lisitsyna, V. D. Khalilev, S. P. Lunkin, Glass for heat-shielding lightfilters,1987 (Patent No. SU1291562). [16] L. Montagne, G. Palavit, R. Delaval, «Effect of ZnO on
properties of (100-x)(NaPO3) – x ZnO glasses», J. Non Cryst.
Solids, 223 (1998) 43.
[17] F. Delahaye-Carrière «Influence de la solution altérante sur la dissolution des verres du système (50-x)Na2O-xCaO-50P2O5»
Thèse de l'Université de Technologie de Compiègne-Lille. 1997.
[18] K. Nakamoto, in: Infrared spectra of Inorganic and Coordination Compounds, Wiley-Interscience, New York, 1970.
[19] Y. M. Moustafa, A. EL-Adawy, Phys. Stat. Sol. (a) 179 (2000) 83.