University of South Carolina
Scholar Commons
Theses and Dissertations
1-1-2013
The Impact of Age and Executive Function On
Susceptibility to Misinformation
Michelle Phillips-Meek
University of South Carolina
Follow this and additional works at:https://scholarcommons.sc.edu/etd
Part of thePsychology Commons
Recommended Citation
THE IMPACT OF AGE AND EXECUTIVE FUNCTION ON SUSCEPTIBILITY TO MISINFORMATION
by
Michelle C. Phillips-Meek
Bachelor of Arts
The College of New Jersey, 2006
Master of Arts
University of South Carolina, 2010
Submitted in Partial Fulfillment of the Requirements
For the Degree of Doctor of Philosophy in
Experimental Psychology
College of Arts and Sciences
University of South Carolina
2013
Accepted by:
Jennifer Vendemia, Major Professor
Doug Wedell, Committee Member
Scott Decker, Committee Member
Julius Fridriksson, Committee Member
ABSTRACT
The current study examined the impact of age and executive function on susceptibility to
misinformation. A total of 41 healthy young (19-31) and older (59-77) adults were
presented with visual misinformation in a paradigm originally used by Okado and Stark
(2005). Participants then completed a recognition memory task while undergoing a
functional magnetic resonance imaging (fMRI) scan. Participants also completed a series
of cognitive measures used to assess executive function. Results showed that age and
executive function were both significant predictors of recognition memory accuracy.
Activity in brain regions associated with conflict processing was greater for accurate
versus false memory retrieval in both older and young adults. In older adults, activity in
the anterior cingulate cortex was positively correlated with accuracy. The results of the
current work demonstrate that conflict resolution is a critical part of overcoming the
effects of misinformation and individual difference variables predict susceptibility in
TABLE OF CONTENTS
ABSTRACT ... iii
LIST OF TABLES ...v
LIST OF FIGURES ... vi
CHAPTER 1 INTRODUCTION ...1
CHAPTER 2 AGING AND MEMORY ...2
CHAPTER 3 NEUROIMAGING OF AGING AND SOURCE MEMORY ...6
CHAPTER 4 NEUROIMAGING OF AGING AND FALSE MEMORIES ...11
CHAPTER 5 INDIVIDUAL DIFFERENCES ...14
CHAPTER 6 CURRENT WORK ...17
CHAPTER 7 METHODS ...21
CHAPTER 8 RESULTS ...31
CHAPTER 9 DISCUSSION ...44
CHAPTER 10 CONCLUSIONS ...53
REFERENCES ...56
LIST OF TABLES
Table 5.1 Summary of main findings. ... 16
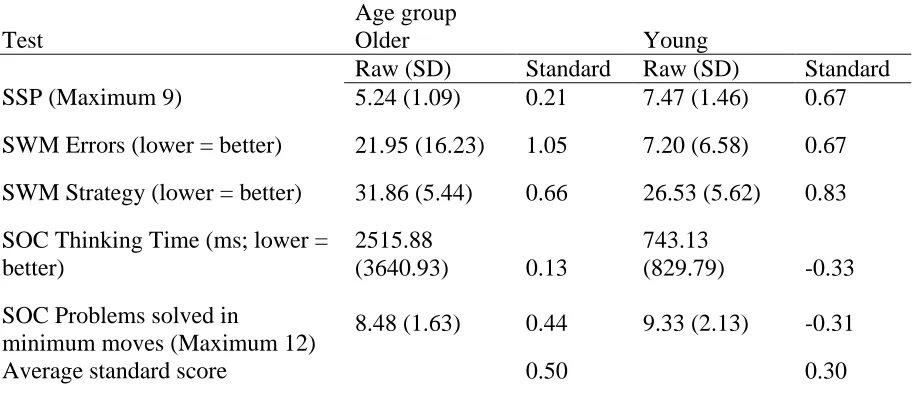
Table 8.1 Mean raw and standard scores for both age groups on the five measures used for the composite executive function z-score. ... 33
Table 8.2 Results for accurate critical trials compared against accurate consistent trials. ... 35
Table 8.3 Results for accurate critical trials compared against false critical trials. ... 37
Table 8.4 Correlations between mean percent signal change, composite executive
function score, and accuracy. ... 39
Table 8.5 Rotated component matrix for a three-factor solution of the five measures used to derive the composite executive function score. ... 41
LIST OF FIGURES
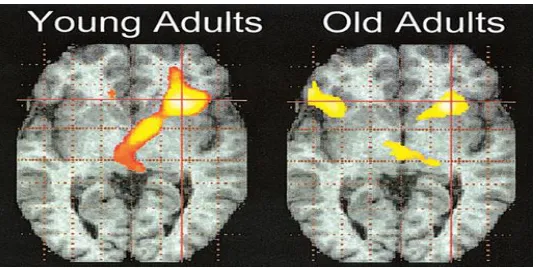
Figure 3.1 An example of the HAROLD pattern. Activity in the young adults is mainly restricted to the right hemisphere. Activity in the older adults is bilateral. Taken from Cabeza (2002). ... 9
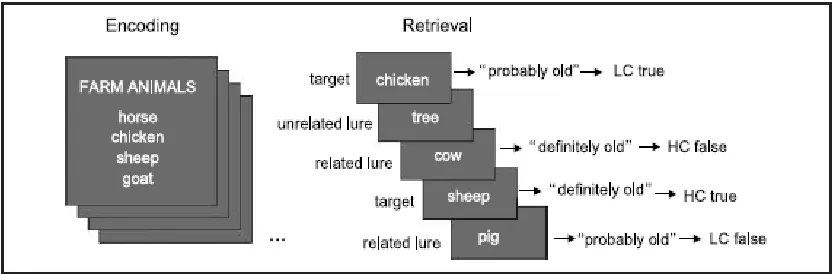
Figure 4.1 An example of the DRM paradigm (Roediger & McDermott, 1995). Targets are words that were presented previously. Unrelated lures are words that are unrelated to the semantic category “farm animals” and were not presented previously. Related lures are words that are related to the semantic category but were not presented previously. Responding with “old’ to a related lure is considered a false memory. Taken from Dennis, et al. (2008). ... 13
Figure 7.1 Functional region-of-interest (ROI) masks on one older adult participant. Top – ACC; Bottom – Contralateral PFC ... 30
Figure 8.1 Accuracy on the recognition memory test. Consistent = proportion of time participants endorsed correct item. Original = proportion of time participants endorsed original event item on critical questions (accurate memory).
Misinformation = proportion of time participants endorsed second, misinformation event item on critical questions (false memory). Foil = proportion of time participants endorsed foil item on critical questions. Error bars represent +/- 1 SE. * p < .05 ** p < .01 ... 32
Figure 8.2 Scatterplot of accuracy on critical items by composite executive function score. Young adults’ regression line and data points are shown in red, older adults in black. ... 33
Figure 8.3 Areas showing a greater relative signal increase on accurate critical trials compared against accurate consistent trials. Thresholded at Z > 2.3, p <.05. Brain represents an average of all participants. Left – Young Adults; Right – Older Adults ... 34
Figure 8.5 Areas showing a greater relative signal increase for older adults than young adults for accurate critical trials compared against accurate consistent trials. Left – Older adults’ main effect; Middle – Young adults’ main effect; Right – Significant difference between groups (interaction). Thresholded at Z > 2.3, p
<.05. Brain represents an average of all participants. ... 36
Figure 8.6 Areas showing a greater relative signal increase on accurate critical trials compared against false critical trials. Thresholded at Z > 2.3, p < .05. Brain represents an average of all participants. Left – Young Adults; Right – Older Adults ... 38
Figure 8.7 Results of conjunction analysis. Areas, in common to both groups, showing a greater relative signal increase for accurate critical trials compared against false critical trials. Thresholded at Z > 2.3, p < .05. Brain represents an
average of all participants. ... 38
Figure 8.8 Scatterplot of accuracy on critical items by mean percent signal change in the ACC for older adults. ... 40
Figure 8.9 Scatterplot of accuracy on critical items by mean percent signal change in contralateral PFC for older adults. ... 40
Figure 8.10 Scatterplot of accuracy on critical items by SWM errors z-score. Young adults’ data points are shown in red, older adults in black. ... 42
Figure 8.11 Scatterplot of accuracy on critical items by SWM strategy z-score. Young adults’ data points are shown in red, older adults in black. ... 43
Figure 9.1 Endorsement rates for original, misinformation and foil items for critical items, as well as correct endorsement rate for control, consistent items. Left – taken from Okado and Stark (2005). ... 45
Figure 9.2 Pictorial representation of the frontal compensation model. Taken from
CHAPTER 1INTRODUCTION
The purpose of this project is to examine the roles that age and executive function
play in susceptibility to misinformation. Past research has shown that older adults are
more susceptible to the interfering effects of misinformation and typically experience
more false memories than young adults. One theory for why older adults are more
susceptible to misinformation is because they have difficulty with source monitoring, an
episodic memory process (Mitchell & Johnson, 2009). Older adults typically perform
worse than young adults on tasks that require attribution of source at retrieval and
neuroimaging studies show consistent age-related differences in the prefrontal cortex
during source retrieval. However, the few neuroimaging studies that have looked
explicitly at false memories fail to support a strictly source monitoring account of
increased susceptibility. Thus, the first goal of this work is to observe the neural
correlates of accurate and false memory retrieval during a misinformation task and assess
age-related as well as individual differences in these correlates. Additionally, recent
behavioral studies suggest individual differences in tests of executive function may
predict susceptibility to misinformation in both older and young adults. The second goal
of this work is to determine the contributions of both age and executive function to
CHAPTER 2AGING AND MEMORY
Decline in memory for events or episodic memory is perhaps one of the most
prominent and researched topics in the field of cognitive aging. A robust finding in the
literature is a decline in episodic memory across the lifespan (for a review see Zacks,
Hasher, & Li, 2000). In addition to exhibiting general deficits in episodic memory, older
adults are much more vulnerable to false memories than young adults (Zacks, Hasher, &
Li, 2000). False memories most often occur when conflicting information is present in
the long-term memory store and the incorrect information is mistakenly retrieved, but
false memories can and do occur without the presentation or suggestion of conflicting
information.
In laboratory studies, older adults are more likely than young adults to report
actually witnessing events that are only suggested to them during “Misinformation
Paradigms”. Misinformation is a manipulation in an experiment during which
information is intentionally presented or only suggested which conflicts with previous
to-be-remembered information (Loftus, 1979). For example, an early study by Schacter,
Koustaal, Johnson, Gross, and Angell (1997) demonstrated that after reviewing photos of
events that had not been shown earlier in a video, older adults were more likely to report
that those events had been shown in the video.
Older adults are also more likely to misattribute events even when explicitly
adults a short video depicting a crime. After seeing the video, all participants answered
questions about the events which contained misleading post event information. For
example, while the thief was depicted without a gun at his waist during the video, a later
question might imply that he did have a gun at his waist. After these initial questions, all
participants were given a surprise source memory test which asked them to indicate
where certain items originated. Older adults were more likely to attribute items suggested
in the questions to the actual video.
One theory for why older adults are more susceptible to misinformation and thus
experience more false memories is because they have more problems than young adults
with something called source monitoring (Mitchell & Johnson, 2009). In 1993, Johnson,
Hastroudi, & Lindsay (1993) outlined the source monitoring framework as a way to
describe the attribution of source to memory traces. Similar updated descriptions of this
framework can also be found in Johnson (2006) and Mitchell & Johnson (2009).
According to Johnson and colleagues, the central tenet of the source monitoring
framework (SMF) is that complex event memories (e.g. “Last Wednesday, when I went
to the bank….”) are made up of features. These features can include perceptual
information (e.g. her shirt was red), spatial details (e.g. the desk was on the right side of
the room), temporal details (e.g. it was the afternoon), emotional information (e.g. the
woman was angry) and so on. Binding these features together during the encoding stage
helps us to distinguish one event from another, creating “episodes”. When brought to
Johnson and colleagues (1993) used the term differentiation to refer to the idea
that as you pull information from memory, it coheres, giving rise to specific
characteristics of memories such as the perceptual, temporal, or emotional details.
Information is relatively undifferentiated at weak levels of cohesion or if only a single
feature is activated. In other words, differentiation is greater when two or more features
together form the basis for separating one event from another. Relatively undifferentiated
information can result in nonspecific source attributions (e.g. “I’ve seen this word in the
experiment.”) Other source attributions are based on more differentiated information (“I
remember the word couch was written in blue ink.”).
Another key feature of the SMF is that during decision processes at retrieval,
features are flexibly weighted according to current context or goals. This can determine
what information is searched for and accessed and how it is combined and evaluated
during the source attribution process. For example, in a study where people look at some
actions taking place and also perform some actions themselves, later asking a participant
“Did you perform this action?” would lead to an emphasis on internal thought processes
and cognitive operations, whereas asking him/her “Did you see this action take place?”
would lead to an emphasis on perceptual information when making the source attribution.
This feature of the SMF suggests that in addition to encoding, processes at retrieval are
important and necessary for a successful source attribution.
Past research shows that older adults have particular difficulties with source
monitoring in comparison with younger adults (for reviews see Mitchell & Johnson,
2009; Spencer & Raz, 1995). Early studies demonstrated that older adults have more
(Norman & Schacter, 1997) or determining who said what (Naveh-Benjamin & Craik,
1996). Mitchell, Johnson, Raye, Mather, and D’Esposito (2000), using a working
memory paradigm, found that older adults were fine at recognizing individual items but
were impaired in ability to recognize an item in context (e.g. an object and its location).
These studies, and other like them, provide behavioral evidence that older adults are more
susceptible to the interfering effects of the misinformation because they have difficulty
CHAPTER 3NEUROIMAGING OF AGING AND SOURCE MEMORY
Much of the work on the neural bases of source monitoring has focused on the
roles of the medial temporal lobes (MTL) and prefrontal cortex (PFC). The MTL has a
strong role in both encoding and retrieval of sources (Davachi, Mitchell, & Wagner,
2003; Mitchell & Johnson, 2009). The hippocampus is involved in binding together
features into complex episodic memories and in specific remembering of item plus
context information at retrieval (often called “recollection”), whereas the perirhinal
cortex, another division of the MTL, supports simple item memory and less-differentiated
remembering (often called “familiarity”) (Ranganath, et al., 2004). The role of the MTL
in source monitoring is important but the main focus of the current work is the role of the
frontal lobes. I chose to focus mostly on the frontal lobes given recent evidence,
discussed further below, that differences in tests of executive function may predict
individual differences in susceptibility to misinformation (Butler, McDaniel, McCabe, &
Dornburg, 2010; Chan & McDermott, 2007; Roediger & Geraci, 2007). Butler, et al.
(2010) also administered tests of MTL functioning but found that they did not predict
susceptibility to false memories.
Previous neuropsychological work has found that damage to the PFC disrupts
revival and systematic evaluation of source information at retrieval (Mitchell & Johnson,
2009). Mitchell, Johnson, Raye & Greene (2004) found that the left lateral PFC
well-differentiated information during a source task in which participants tried to
remember the format or location an item appeared in whereas the same areas in right
lateral PFC were involved in the evaluation of less-differentiated information during a
simple old/new recognition task. The areas involved in source evaluation in Mitchell, et
al. (2004) tended to be more dorsal than ventral consistent with a proposal by Petrides
(2002) that the ventrolateral PFC is involved in controlled retrieval and selection of
relevant information whereas the left dorsolateral PFC is more involved in evaluation of
active information (e.g. Is this information characteristic of Source X?”). In a later study,
Mitchell, Raye, Johnson, & Greene (2006) also found that the left dorsolateral PFC was
more active during source judgments than during simple old-new judgments.
Neuroimaging studies show consistent age-related differences in PFC activity
during source retrieval (Mitchell & Johnson, 2009). The frontal lobes show considerable
age-related declines in volume which may lead to changes in processing (Dennis &
Cabeza, 2008). For example, Mitchell, et al. (2006), within the same experiment
discussed in the previous paragraph, found age-related decreases in left dorsolateral PFC
activity during source judgments at the retrieval period. Given the proposal that left
lateral PFC may be responsible for systematic monitoring of well-differentiated
information during source retrieval (Petrides, 2002), evaluating specific information at
retrieval may become more difficult as one ages.
Age-related reductions in right PFC have also been found and older adults show
context information, a task similar to that of source monitoring, but no differences during
simple retrieval of items, a less difficult task. It is interesting that while Cabeza, et al.
(2000) found decreased right PFC activity during context retrieval, Mitchell, et al. (2006)
found decreases in left PFC during source retrieval. It is possible that this is task-related.
Mitchell and colleagues probed memory for location (left or right) and format (word or
picture) of items. Cabeza and colleagues probed memory for temporal order (i.e. When
did this item appear in a list?). It is possible that location or format decisions rely more on
systematic evaluation of information (e.g. is the information I retrieved about this item
characteristic of format A or B?”) than do temporal order decisions.
Frequently, age-related reductions in activity in the PFC during episodic memory
are accompanied by increased activity in other regions, especially contralateral PFC
regions (for review see Daselaar, et al., 2007; Dennis & Cabeza, 2008; Mitchell &
Johnson, 2009). Studies show initial reduction in activity may occur in either the left or
right hemisphere, depending on the task. Figure 3.1 shows an example. The pattern is
typically found only among high-performing older adults or is greatest among the
highest-performing participants and has been found previously during source memory
(Morcom, Li, & Rugg, 2007). Importantly, Morcom, Li, and Rugg (2007) investigated
differences between older and young adults when task performance was matched. They
found no age-related decreases in activity, only age-related increases.
This pattern of findings is thought to reflect compensatory activity and led to the
development of the hemispheric asymmetry reduction in older adults (HAROLD) model
(Cabeza, 2002). It has still been unclear whether the additional activity represents the
processes to perform the same task (Mitchell & Johnson, 2009). A very recent study by
Spaniol and Grady (2012) sheds light on this issue. Spaniol and Grady were able to show
that during source memory, older adults disproportionately engaged frontally-mediated
control processes in a way very similar to young adults when they were asked to
complete a difficult memory task. While both groups showed greater activity in left
medial anterior PFC (BA 10) for source memory, older adults also engaged the right
inferior (BA 45), middle (BA 8), and superior frontal gyri (BA 8) during source retrieval.
These results suggest that both young and older adults may engage in functional
reorganization as a strategy to complete particularly laborious memory tasks. Given that
the HAROLD pattern is typically seen in high-performing older adults, reorganization
during retrieval may be a way for older adults to optimize their performance. When
responding to questions about an event after exposure to misinformation, older adults
(matched on performance to young adults) should also disproportionately engage these
contralateral PFC regions. We would also expect to see more engagement of these
regions as task performance improves.
In addition to PFC, activity in parietal cortex differs depending on the specificity
of information being evaluated at retrieval (Mitchell & Johnson, 2009). Vilberg and Rugg
(2007) found that left lateral inferior parietal cortex (BA 39) seemed to be associated with
amount of specific information recollected, with more activity for more specific
information recollected. Monitoring of source information at retrieval, then, seems to
require coordinated activity between the prefrontal and parietal cortices. Mitchell, et al
(2008) found, in a short-term source memory task, more activity in both left dorsolateral
PFC and lateral parietal cortex (BAs 7/39/40) for source judgments.
Coordination between activity in PFC and parietal areas has also been found in
misinformation studies. Okado and Stark (2003) found that both accurate and false
memories following exposure to misinformation elicited activity in left dorsolateral PFC
(BA 9) and left lateral parietal regions (BAs 7/39/40) . They concluded this activity may
be related to the attempt to retrieve source information versus retrieval success
specifically. Recently collected data from our lab (Meek, 2012) reflect a similar pattern,
in that accurate memories after exposure to misinformation elicited greater activity in left
dorsolateral frontal and lateral parietal regions than did memories not associated with
misinformation.
While not specifically focused on source monitoring, a preponderance of studies
show decreased activity in posterior regions in older adults during memory and attention
tasks (for a review see Dennis & Cabeza, 2008). These reductions are often accompanied
by the increases in PFC activity mentioned earlier. This pattern has been termed the
posterior–anterior shift in aging(PASA; Cabeza, et al., 2004; Dennis, Hayes, et al., 2008)
CHAPTER 4NEUROIMAGING OF AGING AND FALSE MEMORIES
Neuroimaging studies of false memory formation in older adults are few and
currently no study has examined brain activity in older adults in the context of a visual
eyewitness memory paradigm. Despite evidence for the source monitoring hypothesis,
the few studies that have looked explicitly at false memories fail to support a strictly
source monitoring account of increased susceptibility. Dennis, Kim, and Cabeza (2007,
2008) investigated the neural correlates of false recognition of semantically related lures
with the Deese-Roediger-McDermott (DRM) paradigm (Roediger & McDermott, 1995).
Figure 4.1 below illustrates the DRM paradigm. Dennis, et al. (2007) showed that
encoding-related activity for subsequent accurate memories (i.e. calling a target word
“old”) in MTL and left ventrolateral PFC was reduced in older adults. Despite these
decreases, older adults did show an increase in right ventrolateral PFC activity which
may reflect the compensatory activity discussed earlier (HAROLD model; Cabeza,
2002). They also showed increases in the left superior temporal gyrus (STG) for accurate
memories and false memories. During the retrieval period of the same experiment,
Dennis, et al. (2008) found that behaviorally, older adults exhibited poorer memory
performance than young adults. Specifically, they displayed an increase in high
confidence false alarms to related lures (i.e. calling a related lure “old”). Similar to the
false remembering of non-presented items. Dennis and colleagues believe these results
are consistent with an increase in semantically-based gist responding (mediated by the
lateral temporal cortex), which leads to errors in this paradigm.
Recently, using a picture-based paradigm, Duarte, Graham, and Henson (2010)
proposed that older adults show enhanced false alarm rates not because of an increase in
more familiarity-based gist responding, but because the neural signatures associated with
true and false recognition are less distinguishable in older adults than they are in the
young. In support of their hypothesis, they found that a difference between true and false
recognition in the dorsomedial PFC (BAs 6/8/32), inferior frontal areas (BA 47), and
posterior inferior temporal areas (BAs 37/19) observed in young adults was absent in
older adults, implying a reduced capacity of frontal and temporal regions to distinguish
studied from unstudied items. The authors go on to discuss that dorsomedial (including
anterior cingulate cortex (ACC)) and inferior frontal regions have previous been linked to
conflict monitoring and resolving response competition (see Botvinick, Cohen, & Carter,
2004 for a recent review), suggesting that these control processes subserved by the frontal
lobes may be disturbed in some older adults. The older adults in Duarte, et al. (2010)
were chosen because they had high levels of false alarms or were “low-performers”.
Older adults who are “high-performers” may be better able to engage in response conflict
resolution and demonstrate enhanced performance during the retrieval task.
Conflict processing is especially relevant to the current work in that to
successfully navigate misinformation; participants have to choose among competing
items in memory to pick the correct piece of information. A recent behavioral study also
Dodson and Kreuger (2006) found that when young and older adults were matched on
their overall memory for experienced events, both groups showed comparable rates of
source errors or times they claimed to have seen events that appeared exclusively in a
post-event questionnaire. However, older adults were most likely to make source errors
when they were most confident in their response versus young adults who were most
likely to make these errors when they were uncertain about their response. Dodson and
Krueger proposed the errors were a result of older adults’ confidently misremembering
past events. It could also be that the uncertainty more often experienced by the young
adults was a result of conflict between the original item and the post-event questionnaire
item. Successful resolution of response conflict may be critical to success in a
misinformation task.
CHAPTER 5INDIVIDUAL DIFFERENCES
Recent behavioral studies suggest that executive function may be important in
determining individual differences in susceptibility to misinformation and formation of
false memories. Such an investigation was that done by Roediger and Geraci (2007), who
used a visual misinformation paradigm which presented participants first with a slide
show of an event followed by a written account of the event that contained information
not consistent with the slides (misinformation). They found that the older adults most
susceptible to false memories in this misinformation paradigm had lower scores on
measures of executive function.
A recent study by Butler, McDaniel, McCabe and Dornburg (2010) investigated
whether older adults could use a strategy previously used with young adults to decrease
false memories in the DRM paradigm. This strategy involves generating item-specific
characteristics for each studied word at encoding. This information is then used as an
additional type of cue at retrieval. Surprisingly, they found that under item-specific
encoding instructions, false recall rose, especially for those with lower executive
function. Butler and colleagues proposed that the extra information generated at encoding
became a hindrance for the older adults as they now had more information to sift through
and evaluate during retrieval. This was worse for those with lower executive function
providing further evidence for the critical role of the frontal lobes in deliberate and
Both of the studies discussed above only measured executive function in the older
adults and implicitly assumed that young adults’ executive function was homogenous.
This assumption was tested in a study by Chan and McDermott (2007). Chan and
McDermott measured executive function in both young and older adults and looked at the
contributions of both age and executive function to misinformation susceptibility in a
paradigm similar to that used in Roediger and McDermott (2007). Using regression
analyses, they found that both age and executive function were significant predictors of
retrieval accuracy. These results suggest that executive function may be a general
predictor of individual differences in susceptibility to misinformation, rather than
age-specific. Before moving on, below is a summary table of the main findings discussed
Table 5.1 Summary of main findings.
Topic Major Findings
Aging and Memory Older adults are more susceptible to the interfering effects of misinformation than young adults.
Older adults have more difficulty than younger adults in
distinguishing whether they heard or saw something, determining who said what, or recognizing an item in context.
Neuroimaging of Aging and Source Memory
Source Memory: General
Left dorsolateral PFC more active during source judgments than during simple old-new judgments.
Left lateral inferior parietal cortex associated with amount of specific information recollected.
More activity in both left dorsolateral PFC and lateral parietal cortex for source judgments.
Both accurate and false memories following exposure to misinformation elicit activity in left dorsolateral PFC and left lateral parietal regions.
Accurate and false memories may be distinguished by activity in dorsomedial PFC and posterior inferior temporal regions.
Source Memory: Age-Related
Age-related decreases in left and right PFC activity during source judgments at the retrieval period.
Age-related reductions in activity in the PFC during episodic memory/source memory often accompanied by increased activity in other regions, especially contralateral PFC regions.
Decreased activity in posterior regions in older adults during memory and attention tasks.
Neuroimaging of Aging and False Memories
In word-based false memory paradigms, older adults show more activity in lateral temporal regions related to familiarity-based gist processing.
In a picture-based paradigm, older adults may show enhanced false alarms because the neural signatures associated with true and false recognition are less distinguishable.
Individual Differences
CHAPTER 6CURRENT WORK
The current work examined age-related similarities and differences in the neural
correlates of accurate and false memory retrieval using a misinformation paradigm
originally developed by Loftus (1979) and recently updated by Okado and Stark (2005).
Compared to the DRM paradigm and other word-based tasks, this paradigm more closely
mimics real-world eyewitness memory scenarios and is very similar to the paradigm
previously used by Roediger and Geraci (2007). Currently, only one of the three studies
to specifically look at age-related differences in neural correlates of accurate and false
memory retrieval did so with a picture-based paradigm and as such the current project
fills a gap in the cognitive aging literature.
The current work also examined individual differences in susceptibility to
misinformation in both young and older adults. We measured the ability of age and
executive function to predict task accuracy in order to replicate the findings of Chan and
McDermott (2007). Additionally, relationships between blood-oxygen-level-dependent
(BOLD) signal change in specific regions-of-interest (ROIs), executive function, and task
performance were explored.
The current work addresses the following four research questions:
1. How is behavioral performance (i.e. retrieval accuracy) on a misinformation task
2. What are the neural correlates of accurate and false memory retrieval during a
misinformation task?
3. How do those neural correlates differ between older and younger adults when
performance is matched?
4. Are those neural correlates modulated by individual differences in retrieval accuracy
and executive function?
Hypotheses1
Specific hypotheses for each research question are listed below.
1. A regression analysis will show that executive function and age each account for
variability in retrieval accuracy for critical items.
2a. During accurate and false memory retrieval following exposure to misinformation,
participants will attempt to resolve the conflict between the two salient items in memory.
As a result, both accurate critical items and false critical items will elicit more relative
activity in medial PFC, left lateral PFC, and ACC compared with accurate consistent
items.
2b. The increase in the amount of specific information recollected (as one attempts to
resolve conflict) will also result in more activity in lateral parietal areas.
2c. Accurate memory retrieval following exposure to misinformation will be
distinguished from false memory retrieval following exposure to misinformation by
greater relative activity for accurate memory in medial PFC and ACC as well as posterior
inferior temporal regions previously associated with successful resolution of response
competition.
3a.During accurate and false critical items, compared with young adults, older adults may
show more activity than young adults in PFC regions, especially those contralateral to the
PFC areas present in a conjunction analysis combining the two groups (consistent with
HAROLD pattern).
3b. In older adults, accurate memory retrieval following exposure to misinformation may
not be distinguished from false memory retrieval following exposure to misinformation
by greater relative activity for accurate memory in medial PFC and ACC and posterior
inferior temporal regions. As such, older adults may show less activity than young adults
in these areas for this contrast.
4a. Executive function and task performance will be positively correlated with neural
activity in ACC during accurate memory retrieval following exposure to misinformation
in all participants. This will be measured by examining the correlation of composite
executive function score and retrieval accuracy with mean BOLD percent signal change
in ACC/medial PFC during accurate critical trials compared with false critical trials.
4b. Older adults only: Executive function and task performance will be positively
correlated with neural activity in PFC areas contralateral to the PFC areas present in a
conjunction analysis combining the two groups (consistent with HAROLD pattern)
retrieval accuracy with mean BOLD percent signal change in contralateral PFC during
CHAPTER 7METHODS
Participants
Twenty young adults (13 females) and 23 older adults (15 females) participated in
this study. The young adults were 19-31 years of age (M = 21.35; SD = 2.54). The older
adults were 59-77 years of age (M = 66.39; SD = 4.73). Mean level of education for
young adults was 14.85 years (SD = .88). Mean level of education for older adults was
16.39 years (SD = 2.29). Older adults’ mean level of education was significantly higher
than that of the young adults (t (41) = 2.83, p < .01). This difference was mostly due to
the fact that many of the young adult participants were still attending college at the time
of data collection, and as such their maximum attained level of education was lower.
Mean Mini Mental Status Exam (MMSE; Folstein, Folstein, & McHugh, 1975) score for
older adults was a 29.2 out of 30 and no one scored lower than 28. Mean raw score for
older adults on the Wechsler Adult Intelligence Scale (WAIS-IV) Vocabulary Subtest
(Wechsler, 2008) was 42.73/52 (SD= 5.46). Raw score translates into a scaled score that
is roughly .67, or 2/3rds of a standard deviation above the average scaled score. Older
adults were also screened for the presence of significant neurological or cardiovascular
issues (e.g. stroke, Parkinson’s disease, Alzheimer’s disease, uncontrolled hypertension,
heart surgery, etc.). Two of the 23 older adults were excluded from the study, one
abnormalities on the MRI scan.2 Informed consent was obtained from all participants in
accordance with the guidelines of the University of South Carolina Institutional Review
Board.
Neuropsychological Tests
A series of fully computerized, neuropsychological tests was given to all
participants, with the exception of five young adults, to assess general cognitive ability as
well as to derive a composite executive function score. Six tests were used from the
CANTAB® computerized cognitive assessment battery (Cambridge Cognition, 2012).
The CANTAB tests are designed to test a myriad of cognitive functions, including verbal
ability, attention, memory, and executive functioning. They are predominantly
non-linguistic and culturally neutral. The six tests used were: Reaction Time (RTI), Rapid
Visual Information Processing (RVP), Stockings of Cambridge (SOC), Spatial Span
(SSP), Spatial Working Memory (SWM), and Intra-Extra Dimensional Set Shift (IED).
All CANTAB tests have satisfactory levels of test-retest reliability (Cambridge
Cognition, 2012). Any participant scoring more than two standard deviations below
age-matched normative data on more than two of the neuropsychological subtests would have
been excluded post hoc. No participant was excluded on this basis.
Five measures total from three of the tests were used to derive a composite
executive function z-score: mean thinking time and number of problems solved in
minimum moves from the SOC, a spatial planning test which gives a measure of frontal
lobe function; spatial span from the SSP, which assesses working memory capacity, and
is a visuospatial analogue of the Digit Span test; and number of errors and strategy score
from the SWM, which is a sensitive measure of frontal lobe and ‘executive’ dysfunction.
The measures from these three tests were chosen based on a factor analysis of CANTAB
tests done by Robbins, et al. (1998). Robbins and colleagues found that performance on
these tests was not simply related to a measure of fluid intelligence and performance had
a factor loading structure distinct from that for tests of visual memory and learning more
dependent on the temporal lobes. Each measure was computed as an age-adjusted z-score
by the CANTAB software. Age-adjusted scores control for age, such that a z-score of 1
means the same thing for a 65-year-old or a 20-year-old (one standard deviation above
mean for appropriate age). The five age-adjusted z-scores were averaged to create one
“composite” z-score.
Materials
The stimuli used in this study were taken, with permission, from previous fMRI
studies of misinformation (Okado & Stark, 2005; Stark, Okado, & Loftus, 2010). These
stimuli consisted of 8 vignettes, each of which contains 50 color slides that detail an
event taking place. 12 of these 50 slides were marked as critical slides, and contain
information that changes between the original event and misinformation trials. For
example, in the first presentation the participant viewed an image of a man opening a car
door using a credit card. In the second presentation, he committed the exact same action
holding a wire hanger instead. Each set of 50 slides contained two different sets of critical
items (62 slides in total). Slides were uniformly sized at 300 x 300 pixels.
(pertaining to consistent slides). An example of a critical question was “Where was the
man hiding after he stole the girl’s wallet and crossed the street?” Each critical question
had three answer options: (1) the detail presented in the Original Event phase (Behind a
Door), (2) the detail presented in the Misinformation phase (Behind a Tree), and (3) a foil
option (Behind a Car). Control questions were similar in detail to critical questions. An
example of a control question was “What kind of store was to the left of the video store?”
Each control question also had three responses options: (1) the detail presented in both
phases (Hair Salon), (2) a foil option (Music Store), and (3) a foil option (Clothing Store).
There was a separate recognition test for all eight vignettes.
Procedure
Participants came to the 3T scanner suite located at Palmetto Richland Medical
Center, Columbia, SC for two sessions. In Session 1, informed consent was obtained
from all participants. Once consent was obtained, older adults filled out a health history
questionnaire that included all health-related exclusion criteria. All participants filled out
the MRI Participant Screening Document. Questions on these forms were used to
determine final eligibility for the study. Eligible participants then underwent the series of
neuropsychological tests3.
The first part of Session 2 occurred outside the MRI scanner and was conducted
on a laboratory computer in the scanner suite. The original event and misleading
post-event information was presented using power point software. A total of eight vignettes
were presented twice, each consisting of 50 slides. Each slide was presented for four
seconds, for a total of 200 seconds per vignette. There was a short (30 second) delay
between vignette presentations. During the misleading post-event information slides, 12
of the initially presented critical slides were replaced by their misinformation
counterparts. This resulted in a total of 96 misinformation items presented across the
second presentation of the vignettes. There were three null trials per vignette (24 total).
Null trials were white screens with a blue letter “X” randomly placed on the screen.
Participants were asked to press the “X” button on the keyboard when they saw the “X”
screen. Null trials were also presented for four seconds. All of the null trials were
randomly intermixed within each event.
Participants were instructed to watch all eight vignettes, each containing different
events, and were told that they would answer questions concerning what they witnessed
later. Participants were initially presented with 50 slides depicting an event. After a short
delay, they were then presented with the next vignette. This portion of the experiment
served as the original event phase. After a delay, during which the experimenter went
over the MRI screening document again with participants, a second presentation of the
eight vignettes was given. However, in this second presentation 12 of the slides in each
vignette contained different details from the original event slides. In these slides the scene
itself remained almost identical, with just one major detail altered (i.e. a hat falling off a
head, the main actor holding a wire hanger instead of a credit card, the denomination of
bills, etc.).
The second part of session 2 occurred inside the MRI scanner approximately 20
remembered seeing in the original set of events they viewed. An event-related design
was used to present 144 test items to each participant. Each trial consisted of a fixation
screen, a test item screen (3.5s), and a response screen (4.5s). Participants were cued for a
particular vignette before a new set of questions began. Within each set of questions they
were presented with 12 critical questions related to items that changed between the
vignettes. Another six questions were presented for items that were consistent for both
the original and misleading information presentations. This resulted in a total of 18
questions per vignette, for a total of 144 questions (96 critical, 48 consistent; see
Appendix A for a copy of all questions). A jittered inter-stimulus interval (ISI) was added
between trials. The ISI between trials were one of four times: 400, 800, 1200, or 1600
milliseconds. The order of these times was randomly generated but balanced so as to
have an equal number of each type. The order was randomly generated once and then
kept the same for all participants.
At this stage of the study participants underwent both a functional and a structural
MRI scan. The structural scan was first. The recognition test items were presented during
the following functional scan, and participants were asked to respond using button press
via a device strapped onto their hands. Trials consisted of a fixation screen followed by a
question screen and then a response screen. At the response screen, participants were
prompted to choose between three potential answer choices, pressing 1 with their index
finger for the top answer option, 2 with their middle finger for the middle answer option,
Image Acquisition
Scanning was performed on a 3T Siemens Trio scanner (Munich, Germany)
equipped with a 12-element head coil.
Structural scans. A 3D saggital T1-weighted MPRAGE scan (192 slices; 1mm
thick) was employed the following parameters: TR = 2250 ms, T1 = 925 ms, TE = 4.15
ms, flip angle = 9°, matrix = 1 x 1 x 1 mm3, 256 X 256 FOV.
Functional scans. A total of 668 echo-planar imaging (EPI) volumes (36 axial
slices; 3.0 mm thick, with a 0.6 mm gap between slices) was acquired during the fMRI
session. The sequence employed the following parameters: TR = 2130 ms; TE = 35 ms;
matrix = 64 X 64 voxels; flip angle = 90°, 208 X 208 mm FOV.
Data Analysis
Behavioral data. The general linear model (within SAS GLM) was used to
analyze behavioral data (Research Question 1). A total of 36 subjects were included in
this analysis (21 older adults, 15 young adults). The dependent variable was accuracy
defined as rate of endorsement of original event item on a critical question. Composite
executive function z-score and age group (categorical) were used as predictor variables.
Functional brain data. Data preprocessing and statistical analyses were
performed using FEAT (FMRI Expert Analysis Tool) Version 5.98, part of FSL
(FMRIB’s Software Library, www.fmrib.ox.ac.uk/fsl). Preprocessing consisted of motion
correction using MCFLIRT (Jenkinson, Bannister, Brady, & Smith, 2002). MCFLIRT
uses liner image registration to attempt to correct for participant head motion during
so that it matches the midpoint of the TR. Next, the brain was extracted from the whole
head functional image using BET (brain extraction tool; Smith, 2002). Spatial smoothing
using a Gaussian kernel of FWHM 5.0mm was then done to increase signal-to-noise
ratio, followed by grand-mean intensity normalization of the entire 4D dataset by a single
multiplicative factor. This final step accounted for potential spatial and temporal
differences in MRI signal by forcing all volumes to have equal mean intensity values.
Image registration involved a two-step procedure, whereby low-resolution functional data
were first registered to the matched high-resolution structural data using a six-parameter
affine transformation (Jenkinson, et al., 2002; Jenkinson & Smith, 2001) and then
registered to standard Montreal Neurological Institute (MNI) space (FSL 4.5 MNI
avg152 template) using a 12-parameter linear transformation (Jenkinson, et al., 2002;
Jenkinson & Smith, 2001). Statistical analyses were performed in native space, with the
statistical maps normalized to standard space prior to higher-level analysis.
Time-series statistical analysis used generalized least squares in FILM (FMRIB's
Improved Linear Model) with local autocorrelation correction (Woolrich, Ripley, Brady,
& Smith, 2001) after high pass temporal filtering (Gaussian-weighted least-squares
straight line fitting, with sigma = 50.0s). Voxel-wise analysis used flexible hemodynamic
response function (HRF) modeling, allowing HRF to vary spatially and between subjects
(Woolrich, Behrens, Beckmann, Jenkinson, & Smith, 2004). For each participant, activity
related to each experimental condition of interest was modeled as a canonical HRF. A
previous study looking at source memory modeled a second, delayed HRF (~ 1 TR) for
older adults (Morcom, et al., 2007), however this second model did not account for any
modeled here. It should also be noted that reported differences in shape and timing of the
HRF between older and younger groups has been small (Huettel, Singerman, &
McCarthy, 2001). Trials were coded into three main conditions of interest: 1) correct
responses to control, consistent items, 2) responding with the original event item to a
critical question (accurate memory), and 3) responding with the second misinformation
phase item to a critical question (false memory). Trials during which participants
responded with the foil option or omitted a response were modeled as events of no
interest.
A second-level analysis was then calculated by investigating the mean activation
across a subset of 12 young adult participants and a subset of 12 older adult participants
who were matched on retrieval accuracy for critical questions. Twelve participants is the
typical number needed to have sufficient power in an fMRI experiment (Desmond &
Glover, 2002). The range of endorsement rates of the original items for both groups
ranged from roughly .45 - .65 with means that were not significantly different, t (22) =
-.99, p = .33. The main effect for each group (Research Question 2) as well as the
difference between groups (interaction) was calculated for each specified contrast
(Research Question 3). This analysis utilized FLAME (FMRIB's Local Analysis of
Mixed Effects; Woolrich, et al., 2004), a process that allows for estimation of mixed
effects variance. A separate conjunction analysis (Nichols, Brett, Andersson, Wager, &
Poline, 2005) was performed to look for activity in common between the two groups
Following the whole-brain analyses, functional ROI masks were created from the
group results for two predetermined regions, ACC in all participants and contralateral
PFC in older adults. The ACC mask was created separately for the older and young adult
groups based on peak of activity in ACC for both groups from the accurate critical item >
false critical item contrast (see Figure 7.1 for example of mask). The contralateral PFC
mask was created for the older adult group based on peak of activity in contralateral PFC
from the accurate critical item > accurate consistent item contrast (see Figure 7.1 for
example of mask). These masks were overlaid on to each individual’s T1 to ensure the
mask only covered brain matter. Featquery, part of the FEAT analysis software package,
was used to extract mean percent signal change values from the masks for each
participant. The percent signal change values were entered into Pearson’s correlations
with composite executive function z-scores and accuracy scores (for the 33 participants
with neuropsychological and functional imaging data) to understand the relationship
between these variables and neural activity (Research Question 4).
CHAPTER 8RESULTS
Behavioral Data
Overall, participants endorsed misleading post-event items more often than foil
items (t (40) = 16.041, p < .001), confirming that the paradigm reliably created false
memories (responding with items shown in the Misinformation phase when asked about
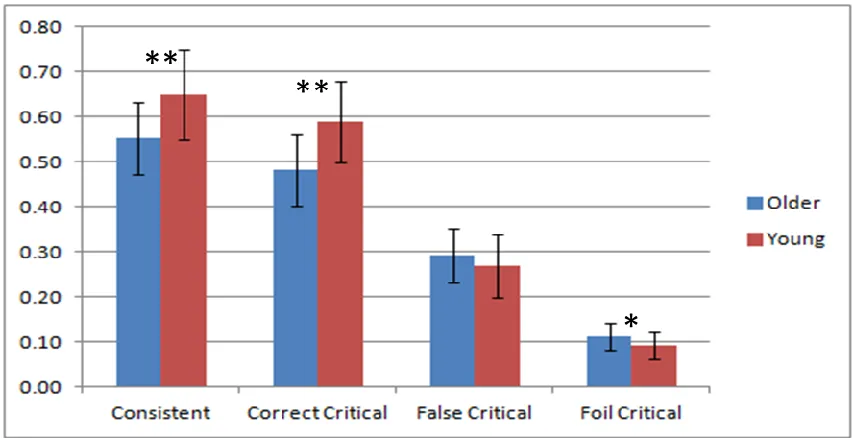
the Original Event phase). As shown in Figure 8.1, young adults performed better on the
recognition memory task than older adults. Both groups were more accurate on consistent
items than critical items, in line with previous research (Okado & Stark, 2005). Table 8.1
displays raw scores and z-scores for both age groups on the five measures from three
CANTAB tests used to create the composite executive function z-score. The raw scores
for young adults demonstrated that they performed better than older adults on all
measures, as would be expected given that many cognitive functions decline with age.
The standard scores showed that overall, the older adults performed better than average
for people their age. The young adults performed better than average for people their age
except for the two SOC measures; where standard scores were slightly lower than
average for their age. The average standard score (across all five measures) was not
significantly different between the groups, t (34) = .88, p > .05 suggesting both groups
performed similarly relative to people their own age.
general linear model was significant, F (3, 32) = 5.83, p < .01, R2 = .35. Both composite
executive functioning z-score F (1, 32) = 4.22, p < .05 and age group F (1, 32) = 10.08, p
< .01 predicted accuracy for critical items. There was no interaction between executive
functioning and age group (F < 1). The relationship between executive function score and
accuracy was the same within both age groups. Figure 8.2 shows a scatterplot of accuracy
on critical items by composite executive score.
Figure 8.1 Accuracy on the recognition memory test. Consistent = proportion of time participants endorsed correct item. Original = proportion of time participants endorsed original event item on critical questions (accurate memory).
Misinformation = proportion of time participants endorsed second, misinformation event item on critical questions (false memory). Foil = proportion of time participants endorsed foil item on critical questions. Error bars represent +/- 1 SE. * p < .05 ** p < .01
Functional Brain Data
Second-level group analyses were performed on a subset of 24 participants (12
per group) matched on accuracy for critical items, as discussed in the data analysis
Table 8.1 Mean raw and standard scores for both age groups on the five measures used for the composite executive function z-score.
Age group
Test Older Young
Raw (SD) Standard Raw (SD) Standard
SSP (Maximum 9) 5.24 (1.09) 0.21 7.47 (1.46) 0.67
SWM Errors (lower = better) 21.95 (16.23) 1.05 7.20 (6.58) 0.67
SWM Strategy (lower = better) 31.86 (5.44) 0.66 26.53 (5.62) 0.83
SOC Thinking Time (ms; lower = better)
2515.88
(3640.93) 0.13
743.13
(829.79) -0.33
SOC Problems solved in
minimum moves (Maximum 12) 8.48 (1.63) 0.44 9.33 (2.13) -0.31
Average standard score 0.50 0.30
Note: SSP = Spatial Span; SWM = Spatial Working Memory; SOC = Stockings of Cambridge
For young adults, several clusters of activity emerged, most notably in right lateral
parietal areas (BAs 39/40), right middle frontal gyrus (BA 9), right fusiform gyrus (BAs
37/19), and posterior cingulate (BA 23). For older adults, results were very similar with
the exception of two clusters in left superior/middle (BAs 6,8,9) and inferior frontal
cortex (BA 47). Table 8.2 reports cluster membership, MNI coordinates (x, y, z), region,
and approximate Brodmann Area (BA) for each peak voxel within a cluster for the young
and older groups separately. Figure 8.3 displays the results for both groups overlaid onto
a brain representing the average of all 24 participants. The analysis revealed no
significant relative signal increase on false critical trials compared against accurate
consistent trials in either group. The analysis also revealed no significant relative signal
increase on combined accurate and false critical trials compared against accurate
consistent trials in either group.
Table 8.2 Results for accurate critical trials compared against accurate consistent trials.
Cluster z-score
Coordinates
(x,y,z) Region
Approximate BA Young Adults
1 3.58 -2 -33 24
L/R posterior cingulate
gyrus 23
2 3.73 11 -73 0 R lingual gyrus 18
3 3.64 54 -54 3 R fusiform gyrus 37/19
4 3.41 43 -54 29 R angular gyrus 39
5 2.99 58 -30 36 R inferior parietal lobule 40
6 3.03 28 29 28 R middle frontal gyrus 9
Older Adults
1 3.91 -19 14 51
L superior/middle frontal
gyrus 6/8/9
2 3.84 -64 -58 25 L fusiform gyrus 37/19
3 3.19 11 -71 34
L/R precuneus/angular
gyrus 39/7
4 3.41 3 -94 22 L/R cuneus 18/19
5 3.49 -16 19 -25 L inferior frontal gyrus 47
6 3.07 44 41 18 R middle frontal gyrus 46
7 3.03 13 -98 -13 R lingual gyrus 17
8 3.35 -70 -32 23 L inferior parietal lobule 40
Older > Young
1
L superior/middle frontal
gyrus 6/8/9
A conjunction analysis combining both age groups for the accurate critical versus
accurate consistent contrast revealed areas in right lateral parietal and right dorsal
prefrontal cortex that were common to both the older and younger groups. These areas
are highlighted in Figure 8.4. Examining the difference between groups for the accurate
critical versus accurate consistent contrast (interaction), older adults had significantly
more activity in a cluster in left superior/middle frontal gyrus (BAs 6, 8, 9; Figure 8.5;
adult group. There were no areas where young adults had significantly more activity than
older adults for this contrast.
Figure 8.4 Results of conjunction analysis. Areas, in common to both groups, showing a greater relative signal increase for on accurate critical trials compared against accurate consistent trials. Thresholded at Z > 2.3, p <.05. Brain represents an average of all participants.
Figure 8.5 Areas showing a greater relative signal increase for older adults than young adults for accurate critical trials compared against accurate consistent trials. Left – Older adults’ main effect; Middle – Young adults’ main effect; Right – Significant difference between groups (interaction). Thresholded at Z > 2.3, p
<.05. Brain represents an average of all participants.
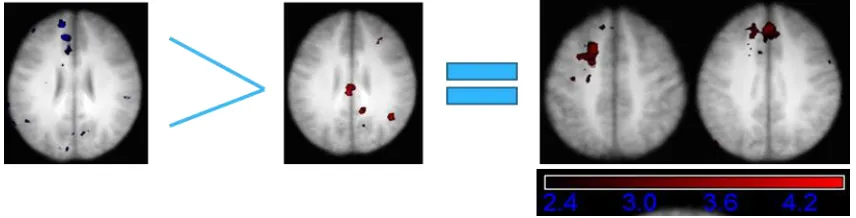
Results also revealed a significant relative signal increase on accurate critical
trials compared against false critical trials, in both age groups. For young adults, several
clusters of activity emerged, bilateral posterior cingulate cortex (BAs 23, 31), bilateral
adults did have a cluster of activity in left middle frontal gyrus (BA 10) not present in the
young adults, but an analysis of the difference between groups for this contrast revealed
no significant results. Table 8.3 reports cluster membership, MNI coordinates (x, y, z),
region, and approximate Brodmann Area (BA) for each peak voxel within a cluster for
both groups. Figure 8.6 displays the results for both groups overlaid onto a brain
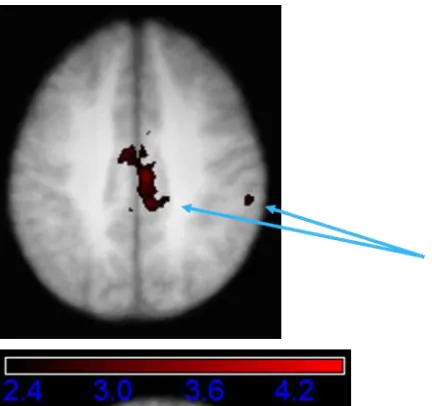
representing the average of all participants. A conjunction analysis combining both age
groups for the accurate critical versus false critical contrast revealed areas in right lateral
parietal and cingulate cortex that were common to both the older and younger groups.
These areas are highlighted in Figure 8.7. There were no differences between groups for
this contrast.
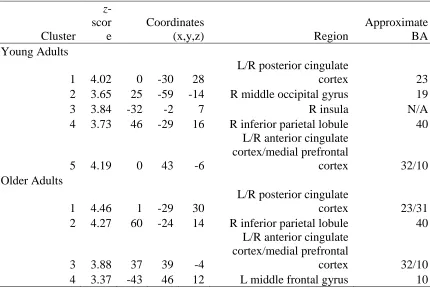
Table 8.3 Results for accurate critical trials compared against false critical trials.
Cluster
z -scor e
Coordinates
(x,y,z) Region
Approximate BA Young Adults
1 4.02 0 -30 28
L/R posterior cingulate
cortex 23
2 3.65 25 -59 -14 R middle occipital gyrus 19
3 3.84 -32 -2 7 R insula N/A
4 3.73 46 -29 16 R inferior parietal lobule 40
5 4.19 0 43 -6
L/R anterior cingulate cortex/medial prefrontal
cortex 32/10
Older Adults
1 4.46 1 -29 30
L/R posterior cingulate
cortex 23/31
2 4.27 60 -24 14 R inferior parietal lobule 40
3 3.88 37 39 -4
L/R anterior cingulate cortex/medial prefrontal
cortex 32/10
Figure 8.6 Areas showing a greater relative signal increase on accurate critical trials compared against false critical trials. Thresholded at Z > 2.3, p < .05. Brain represents an average of all participants. Left – Young Adults; Right – Older Adults
Figure 8.7 Results of conjunction analysis. Areas, in common to both groups, showing a greater relative signal increase for accurate critical trials compared against false critical trials. Thresholded at Z > 2.3, p < .05. Brain represents an average of all participants.
Functional ROI masks were created from the group results for predetermined
regions. The anterior cingulate cortex (ACC) mask was created separately for the older
and young adult groups based on peak of activity in ACC for both groups from the
The contralateral PFC mask was created for the older adult group based on peak of
activity in contralateral PFC from the accurate critical item > accurate consistent item
contrast (see Figure 7.1 for example of mask). Table 8.4 shows correlations between the
percent signal change values, composite executive function z-scores, and accuracy for
critical items. For ACC, collapsing across age groups produced extremely small
correlations, thus correlations were looked at separately for the older and young groups.
Due to the somewhat small sample sizes; only the correlation between accuracy on
critical items and percent signal change in ACC for older adults was significant. Figure
8.8 shows a scatterplot of accuracy on critical items by percent signal change in ACC for
older adults. Older adults did show a moderate positive correlation between accuracy on
critical items and percent signal change in contralateral PFC. Figure 8.9 shows a
scatterplot of accuracy on critical items by percent signal change in contralateral PFC for
older adults. The correlations between accuracy on critical items, composite executive
function, and percent signal change in ACC for young adults were both negative,
explaining the very small values produced by collapsing across groups.
Table 8.4 Correlations between mean percent signal change, composite executive function score, and accuracy.
Region Composite score Accuracy (critical)
Anterior cingulate cortex (ACC)
Older (n = 18) .10 .56*
Young (n = 14) -.21 -.19
Contralateral PFC
Older .08 .37
Figure 8.8 Scatterplot of accuracy on critical items by mean percent signal change in the ACC for older adults.
Figure 8.9 Scatterplot of accuracy on critical items by mean percent signal change in contralateral PFC for older adults.
Follow-Up Analyses
Previous literature (Robbins, et al., 1998) suggested that the five measures used to
post-hoc factor analysis (within SPSS) of the five measures for the current dataset suggested
that a three-factor solution fitted the data better than a one-factor (80% versus 34% of the
variance explained, respectively). Table 8.5 displays the rotated (Varimax rotation)
component matrix for the three-factor solution. Each component best represents the
measures from each of the three CANTAB tests (SSP, SWM, SOC), suggesting they
should not be combined into a composite score, as the literature originally suggested.
Table 8.5 Rotated component matrix for a three-factor solution of the five measures used to derive the composite executive function score.
Component
Measure 1 2 3
SWM Errors .571 .501 .207
SWM Strategy .058 .944 .108
SOC Thinking Time .754 .310 .038
SOC Minimum Moves .908 -.119 .010
SSP Span .056 .131 .986
Note: SWM = Spatial Working Memory; SOC = Stockings of Cambridge; SSP = Spatial Span
We ran three additional separate regression analyses (within SPSS) using the
age-adjusted z-score measures from each factor, along with age group, as predictor variables.
Only the measures comprising SWM were significant and as such, only the results of that
regression analysis are presented here. The overall model was significant, F (3, 31) =
10.914, p < .001, R2 = .51. SWM errors z-score,= .51, t (32) = 3.44, p < .01, SWM
strategy z-score, = -.28, t (32) = -2.05, p < .05, and age group, = .76, t (32) = 5.51, p
< .001 all significantly predicted accuracy for critical items. Figures 8.10 and 8.11
to test for the interaction between age group and SWM errors z-score and between age
group and SWM strategy z-score. There was no interaction between SWM errors and age
(F < 1) or between SWM strategy and age (F < 1). The relationship between these
variables and accuracy was the same within both age groups.
Given the results of the factor analysis and new regressions, additional Pearson’s
correlations were computed between mean percent signal change values and the two
measures from the SWM. Table 8.6 shows these new correlations. Correlations between
composite executive function scores and mean percent signal change values were small,
especially for the older adults. Correlations between the two SWM measures and mean
percent signal change values were much higher for the older adults. The correlation
between percent signal change in the ACC and SWM errors was quite large and
significant.
Figure 8.11 Scatterplot of accuracy on critical items by SWM strategy z-score. Young adults’ data points are shown in red, older adults in black.
Table 8.6 Correlations between mean percent signal change, SWM errors z-score, and SWM strategy z-score.
Region SWM Errors SWM Strategy
Anterior cingulate cortex (ACC)
Older (n = 18) .56* -.22
Young (n = 14) -.03 -.04
Contralateral PFC
Older .28 -.13
CHAPTER 9DISCUSSION
Behavioral Findings – Research Question 1
Accuracy results supported the main behavioral hypothesis (Hypothesis 1), as age
and executive function were both predictors of endorsement of the original event items
on critical questions. There was no interaction between age and executive function,
suggesting that the relationship between executive function and accuracy was not
different for older and young adults. Although the intent of the current work was to use a
composite executive function score, a post-hoc factor analysis suggested the measures
used for the composite were best explained by three factors, each representing a separate
CANTAB test. Thus, it may be best to look at the contributions of these tests separately
rather than as a composite. Separate post-hoc regression analyses revealed that only the
two measures from the Spatial Working Memory subtest were significant predictors of
accuracy on critical questions. This is not entirely surprising given that the Spatial
Working Memory subtest requires one to continuously monitor and update stored
information, similar to what is required during the misinformation task. There was again
no interaction between age and these measures. These results support those of Chan &
McDermott (2007) and provide support for executive function as a general predictor of
susceptibility to misinformation and not an age-specific mechanism. Individual
differences in scores on measures of executive function cannot explain all of the