Tuberculosis, public health and gathering new
evidence to guide control efforts
GUEST EDITORS
Amanda Christensen
A, Chris Lowbridge
A,
Guy B. Marks
Band Vitali Sintchenko
C,D,E AHealth Protection NSW B
Department of Respiratory Medicine, Liverpool Hospital C
Centre for Infectious Diseases and Microbiology, Westmead Hospital
D
Sydney Institute for Emerging Infectious Diseases and Biosecurity, The University of Sydney E
Corresponding author. Email: [email protected]. nsw.gov.au
More than 100 years after the discovery of the tubercle bacillus by Robert Koch, tuberculosis (TB) remains one of the most important public health challenges worldwide. Despite signif-icant achievements in communicable disease control in the last century, the World Health Organization (WHO) estimates that in 2011 there were 8.7 million incident cases of TB and 1.4 million TB-related deaths, as well as an additional 430 000 deaths as a result of TB and human immunodeficiency virus (HIV) co-infection.1 In Australia, the incidence of TB has fluctuated at around 6.0 per 100 000 population for the last 15 years, with more than 85% of cases occurring in people born overseas.2 This special issue of the NSW Public Health Bulletinreviews the current epidemiology of TB in New South Wales (NSW), showcases the experiences of clinicians in managing difficult TB cases, highlights the public health challenges involved in TB control, and adds new evidence to aid future action towards the elimination of TB in Australia.
The first paper, from the NSW TB Control Program, describes the epidemiology of TB in the state. Lowbridge, Christensen and McAnulty review TB notifications over the past two decades and explain why, despite high rates of treatment success, this disease remains a continued strategic priority for disease control. They focus our attention on two key themes: TB transmission within sub-groups of the NSW population, and the potential threat of evolving TB
epidemics in neighbouring countries. These two themes are reinforced and expanded upon by other papers in the issue.
Gilbert and Sintchenko outline new opportunities in decipher-ing TB transmission chains presented by the radically improved resolution of subtyping and whole-genome sequencing of Mycobacterium tuberculosis. It is important to raise public health professionals’ awareness about recent advances in pathogen genome characterisation as these meth-ods are becoming available at state public health laboratories and allow inference about the direction of transmission between cases and the prediction of undiagnosed cases.3
Britton, Perez-Velez and Marais offer an update on the clinical management of TB in children. They demonstrate that rates of paediatric TB in Australia are comparable to other developed countries, with minimal local transmission and routine post-exposure prophylaxis.
The case studies present emerging issues in TB management and control. Michail summarises recommendations about monitoring for adverse events following anti-TB therapy. Banner shares the lessons she and her colleagues learnt following a contact tracing exercise within a school envi-ronment. Fisher, Cook and Marks estimate the costs of contact screening in a neonatal intensive care unit following the incidental exposure of neonates to a health care worker diagnosed with respiratory TB. Vogelnest, a senior veteri-narian, presents TB as an emerging zoonotic disease and highlights the need for occupational health programs and screening programs for susceptible species. These reports illustrate the increasing complexity of TB patient manage-ment and public health investigations.
Two papers aim to improve our understanding of effective contact investigations, especially in hard-to-reach popula-tions. They add to the body of knowledge about how to prioritise contacts on the basis of the infectiousness of the
Vol. 24(1) 2013 ISSN 1034 7674
NSW PUBLIC HEALTH
BULLETIN
CONTENTS – See back page w w w . p u b l i s h . c s i r o . a u / j o u r n a l s / p h b
10.1071/NB12124
index case, intensity of exposure and susceptibility of contacts. Dobler discusses the findings from a retrospec-tive review of TB contact investigations in NSW. This study demonstrated that only 9% of contacts with positive skin tests received treatment for latent TB infection and advocated for more consistent decision-making and testing strategies for latent TB management. Devlin and Passmore highlight the challenges faced by public health profes-sionals in managing ongoing outbreaks in high-risk com-munities. Their paper provides important details on the transmission of TB in Aboriginal communities in northern NSW, perhaps the only example of an ongoing local TB outbreak in the state.
The final paper reminds us about the critical importance of TB control interventions in high-incidence countries. Shaw explains Australia’s role in promoting and support-ing TB control within the Western Pacific Region. This region has been responsible for almost a quarter of the world’s TB cases and its challenges of drug-resistance and co-infection with HIV make a strong case for improved engagement from Australia. The author details opportu-nities for our country to contribute to theRegional Strategy to Stop TB in the Western Pacific4 and to the local TB control capacity building in the region.
The editorial team hopes that this issue of theNSW Public Health Bulletinwill assist both public health professionals and clinicians involved in the management and control of TB and will be of interest to everyone who is passionate about local and international efforts in TB control.
References
1. World Health Organization. Global tuberculosis report 2012. Geneva: World Health Organization; 2012.
2. Barry C, Waring J, Stapledon R, Konstantinos A; National Tuberculosis Advisory Committee, for the Communicable Diseases Network Australia. Tuberculosis notifications in Australia, 2008 and 2009.Commun Dis Intell2012; 36(1): 82–94.
3. Walker TM, Ip CL, Harrell RH, Evans JT, Kapatai G, Dedicoat MJ et al. Whole-genome sequencing to delineate
Mycobacterium tuberculosisoutbreaks: a retrospective
observational study.Lancet Infect Dis2013; 13(2): 137–46. doi:10.1016/S1473-3099(12)70277-3
4. World Health Organization. Regional Strategy to Stop Tuberculosis in the Western Pacific 2011–2015. Available at: http://www.wpro.who.int/tb/documents/policy/2010/regional_ strategy/en/index.html (Cited 29 January 2013).
Notice
This issue of theBulletinmarks the beginning of quarterly publication.
Erratum
Typhoid and paratyphoid fever in Western Sydney Local Health District, NSW, January–June 2011 (N S W Public Health Bull 2012; 23(7–8): 148–152).
The paper by Blackstock, Sheppeard, Paterson and Ralph erroneously used the term ‘serotype’ in some instances where the term ‘phage type’ should have been used, for example in the sentence ‘‘ThreeS.Typhi isolates acquired at large social gatherings in Samoa had the same serotype and susceptibility profilesy’’ The sentence should have read: ‘‘Three S. Typhi isolates acquired at large social gatherings in Samoa had the same phage type and sus-ceptibility profilesy’’ In addition, differences from the
locally endemic strain would need to have been shown to ‘‘suggest a potential outbreak’’.
The authors would also like to clarify that, while the results reported in this paper were provided by the NSW Enteric Reference Laboratory, Institute for Clinical Pathology and Medical Research, Westmead Hospital, the phage typing was in fact performed at the Microbiological Diagnostic Unit – Public Health Laboratory, The University of Melbourne.
Tuberculosis in NSW, 2009
–
2011
Chris Lowbridge
A,B, Amanda Christensen
Aand Jeremy M. McAnulty
AA
Health Protection NSW B
Corresponding author. Email: [email protected]
Abstract: Aim:To describe the epidemiology of tuberculosis in NSW between 2009 and 2011 and compare with previous years.Methods:Data from all cases of tuberculosis notified in NSW during this period were extracted from the Notifiable Conditions Information Management System. Descriptive analyses of notification data were undertaken. Incidence rates were calculated per 100 000 population. Results:Between 2009 and 2011, there were 1548 cases of tuberculosis notified in NSW, translating to an average annual notification rate of 7.2 per 100 000 population for this period. A total of 89% (n¼1371) of notified cases were overseas-born, and 1.6% (n¼24) of cases were recorded as Aboriginal persons. The most common site of infection was the lung (60% of cases). Of notified cases, 68% were reported as having been tested for HIV, of which 3% (n¼28) of cases had HIV/tuberculosis co-infection. There were 20 cases of multidrug-resistant tuberculosis, including one case of extensively drug-resistant tuberculosis. Conclusion: The notification rate of tuberculosis in NSW has remained relatively stable over the past two decades, though small incremental increases since 2003 are evident. Endemic transmission of tuberculosis within sub-groups of the NSW population, as well as the ongoing high endemnicity for tuberculosis in neighbouring countries, highlight the importance of tuberculosis control as a continued strategic priority for disease control in NSW.
Tuberculosis (TB) remains a disease of global public health significance. The World Health Organization (WHO) esti-mates that in 2011 there were 8.7 million incident cases of TB and 1.4 million TB-related deaths, as well as an
additional 430 000 deaths as a result of TB and human immunodeficiency virus (HIV) co-infection.1In Australia the incidence of TB is low: in 2010 it was reported by WHO to be 6.1 cases per 100 000 population. Mortality from TB, excluding HIV-positive cases, was less than one TB-related death per 100 000 population in Australia in 2010.1
Despite Australia’s low incidence, TB control remains a challenge as the epidemiology of this disease must be considered in a global context given the frequency of international travel and migration from high-incidence countries.2The incidence and prevalence of TB in many of Australia’s international neighbours remains high. Twenty-two countries account for 80% of the global burden of TB; nine of these countries are within the South-East Asian and Western Pacific Regions. These two regions also account for approximately 18% of multidrug-resistant TB (MDR-TB) cases.1
Given the global context of TB epidemiology, elimination of disease within any given country is not considered feasible. The key goals and strategies of the New South Wales (NSW) TB Control Program therefore focus on case finding, early diagnoses and effective treatment in order to minimise and eliminate local transmission.3 NSW has a strong surveillance system in place, whereby all patients diagnosed with TB are notified to a public health unit or chest clinic in accordance with the NSWPublic Health Act 2010. Case details are then entered into a central registry, the Notifiable Conditions Information Management System.
The aim of this report is to describe the epidemiology of TB in NSW between 2009 and 2011 by examining the demographic and clinical characteristics, and risk factors for infection, of notified cases. We report on the public health follow-up of cases and the extent of contact tracing activities undertaken by public health and clinical services. We also compare incidence data with data from previous years. Understanding the epidemiology of TB in NSW is critical for informing and evaluating disease control strategies.
Methods Data sources
TB notification data were extracted from the Notifiable Conditions Information Management System. Data were included in the study when the year of diagnosis was between 2009 and 2011 (inclusive). Population data including NSW mid-year population estimates, estimated populations by country of birth and population estimates by Local Health District (LHD) were obtained from the
10.1071/NB12115 Vol. 24(1) 2013 NSW Public Health Bulletin | 3
Australian Bureau of Statistics (ABS) via the Secure Analytics for Population Health Research and Intelligence system. Results for the 2009–2011 period were compared with the two most recently published NSW TB EpiReviews for the periods 2008 and 2003–2007.2,4
Definitions
For the purpose of this report TB was defined as active infection withMycobacterium tuberculosis. Cases of latent TB are not included. Pulmonary TB was defined as disease occurring within the patient’s lung, excluding the pleura. Extrapulmonary TB was defined as disease affecting any other region of the body including the pleura. A case of TB was defined as ‘new’ when there was no record of previous TB treatment of more than 1 month duration.
TB notification data were analysed by year of diagnosis. Each case of TB is assigned a year of diagnosis, which is the year in which the majority of clinical and public health action, including diagnosis, treatment, isolation and con-tact tracing, occurred.
High-risk countries were defined as per the WHO defini-tion of countries in which the incidence of TB is greater than or equal to 60 cases per 100 000 population per year.5
Cases were defined as having MDR-TB when their isolates demonstrated resistance to at least isoniazid and rifampi-cin. Extensively drug-resistant TB (XDR-TB) was defined as cases in which isolates demonstrated resistance to isoniazid and rifampicin, as well as additional resistance to any fluoroquinolone, and to at least one injectable second-line drug (capreomycin, kanamycin or amikacin).6
0 1 2 3 4 5 6 7 8
0 100 200 300 400 500 600
1991 1992 1993 1994 1995 1996 1997 1998 1999 2000 2001 2002 2003 2004 2005 2006 2007 2008 2009 2010 2011
Rate per 100
000 population
Number of cases
Year
Cases Rate
Figure 1. Annual number and rate per 100 000 population of notified tuberculosis cases, NSW, 1991–2011
Source: Notifiable Conditions Information Management System and Secure Analytics for Population Health Research and Intelligence, NSW Ministry of Health (2009–2011), Roberts-Witteveen et al (2008), O’Connor et al (1991–2007).
Table 1. Demographic characteristics, number and rate per 100 000 of notified tuberculosis cases, NSW, 2009]2011
2009 2010 2011
n Rate n Rate n Rate
Sex Male 282 8.0 301 8.5 287 8.0
Female 224 6.3 224 6.2 225 6.2
Unknown 1 – 4 – 0 –
Age 0–4 2 0.4 8 1.7 4 0.8
5–14 12 1.3 10 1.1 7 0.8
15–24 90 9.2 101 10.3 87 8.9
25–34 157 15.7 163 16.4 152 15.3
35–44 64 6.4 59 5.9 73 7.2
45–54 67 6.9 63 6.5 56 5.7
55–64 43 5.3 44 5.4 52 6.2
65þ 72 7.3 81 8.0 81 7.8
Country of birth and Indigenous status
Australian-born 53 1.0 65 1.3 59 n/a
– Aboriginal or
Torres Strait Islandera 5 3.1 11 6.8 8 4.8
– Non-Indigenous 48 1.0 54 1.1 48 n/a
Overseas-born 454 22.9 464 23.2 453 n/a
n/a¼Population estimates not available
aThree cases in 2011 had unknown Indigenous status.
Statistical analyses
Descriptive analyses of notification data were under-taken. Cases were categorised as overseas-born, non-Indigenous Australian-born, or Aboriginal and/or Torres Strait Islander Australian-born. Overseas-born cases were categorised into regions of birth using ABS standards.7 Incidence rates per 100 000 population were calculated for the whole of NSW using select fields from demo-graphic, clinical, risk factor and contact management data categories. Incidence rates for TB by LHD of resi-dence were calculated and mapped. Data were analysed using SASÒEnterprise GuideÒ (version 4.3, SAS Insti-tute, Cary, NC, USA).
Results
There were 1548 notifications of TB received in NSW between 2009 and 2011 inclusive (507–529 notifications per year), equating to an annualised rate of 7.2 cases per 100 000 population for the period (range 7.1–7.4 per 100 000 population). The rate of TB notification in NSW has remained relatively stable over the past two decades (Figure 1) however there have been small incremental increases since 2003.
Demographic characteristics
Males accounted for 56% of tuberculosis cases diagnosed between 2009 and 2011. The mean age of cases was 41 years (range: 6 months–94 years). Adults aged 25–34 years accounted for the largest proportion (30%) of cases (Table 1). There were 24 cases of TB in Aboriginal persons (1.6% of all cases) in NSW between 2009 and 2011, equating to a crude incidence rate of 4.9 cases per 100 000 population per year. The highest annual crude rate of infection in Aboriginal persons was 6.8 cases per 100 000 population (n¼11) in 2010. The rate of infection in non-Indigenous Australian-born persons in 2010 was 1.0 per 100 000 popu-lation (9.5% of cases). In 2009, Aboriginal persons were three times more likely to be notified with TB than non-Indigenous Australian-born persons (Incident Rate Ratio (IRR) 3.3, 95% CI: 1.3–8.2), increasing to six times more likely in 2010 (IRR 6.3, 95% CI: 3.3–12.0). Of Aboriginal or Torres Strait Islander persons notified with TB between 2009 and 2011, 50% were residents of the Northern NSW or Mid North Coast LHDs.
The majority of cases of TB between 2009 and 2011 (85%) resided within the Sydney metropolitan area, giving an annualised incidence rate of 11.2 per 100 000 population
Table 2. Number and rate per 100 000 of notified tuberculosis cases by Local Health District, NSW, 2009]2011
2009 2010 2011 Total
n Rate n Rate n Rate n Rate
Regional and rural 39 1.8 46 2.1 49 2.2 134 2.1
Murrumbidgee 7 2.4 6 2.1 14 4.8 27 3.1
Far West ,3 3.1 0 0.0 ,3 3.2 ,3 2.1
Mid North Coast 3 1.4 9 4.3 5 2.3 17 2.7
Southern NSW 6 3.0 3 1.5 4 2.0 13 2.2
Hunter New England 15 1.7 15 1.7 17 1.9 47 1.8
Western NSW 0 0.0 4 1.5 5 1.9 9 1.1
Northern NSW 7 2.4 9 3.0 3 1.0 19 2.1
Outer metro 25 2.4 32 3.1 30 2.9 87 2.8
Illawarra Shoalhaven 12 3.1 13 3.4 14 3.6 39 3.4
Nepean Blue Mountains
10 2.9 14 4.1 12 3.5 36 3.5
Central Coast 3 1.0 5 1.6 4 1.3 12 1.3
Inner metro 442 11.4 450 11.5 427 10.8 1319 11.2
Western Sydney 127 15.6 111 13.5 127 15.3 365 14.8
Sydney 91 16.2 84 14.7 88 15.2 263 15.4
South Western Sydney 98 11.4 91 10.5 83 9.4 272 10.4
South Eastern Sydney 68 8.2 101 12.1 68 8.1 237 9.5
Northern Sydney 58 7.0 63 7.6 61 7.3 182 7.3
Other
Justice Health 0 n/a 0 n/a 5 n/a 5 n/a
Overseas ,3 n/a ,3 n/a ,3 n/a 3 n/a
n/a: Population estimates not available
Small cell counts have been suppressed for privacy and confidentiality reasons.
Source: Notifiable Conditions Information Management System and Secure Analytics for Population Health Research and Intelligence, NSW Ministry of Health.
Tuberculosis in NSW, 2009–2011
per year. The rate of infection in outer metropolitan, and regional and rural areas was 2.8 and 2.1 cases per 100 000 population respectively (Table 2). Within the Sydney metropolitan area, Sydney LHD and Western Sydney LHD had the highest overall rates and accounted for 41% of all TB notifications in NSW between 2009 and 2011. Of the regional and rural LHDs, Murrumbidgee had the highest rate (3.1 cases per 100 000 population per year).
Country of birth
The incidence rate of TB in overseas-born persons in 2010 was 23.2 per 100 000 population, compared to 1.3 cases per 100 000 population for Australian-born persons. Popu-lation estimates by country of birth were not available for 2011. Between 2009 and 2011, 89% (n¼1371) of cases were overseas-born. Of overseas-born cases, 45% (n¼613) were born in South-East Asia and 39% (n¼534) were born in the Western Pacific Region.
Site of infection
Between 2009 and 2011, pulmonary only disease (defined as site of infection including the lung but excluding the pleura) accounted for 50% (n¼780) of TB cases (Table 3). Extrapulmonary disease accounted for 40% (n¼623) and cases with both pulmonary and extrapulmonary disease accounted for 9% of cases (n¼145). Lymph nodes were the second most common site of infection after the lung and were recorded as a site of infection in 25% of all cases and 51% of cases with extrapulmonary involvement.
Case identification and laboratory confirmation
Of cases between 2009 and 2011, 76% were laboratory confirmed. Laboratory confirmation was made by isola-tion of M. tuberculosis by culture in 72% (n¼1111) of cases and by polymerase chain reaction alone in 4% (n¼61) of cases. In the remaining 24% of cases, diagnosis was made on clinical grounds with or without
laboratory-Table 3. Clinical and diagnostic characteristics of notified tuberculosis cases, NSW, 2009]2011
2009 2010 2011 Total
n % n % n % n %
Site of infection Pulmonary only 223 44 284 54 273 53 780 50
Pulmonary and other site 62 12 51 10 32 6 145 9
Extrapulmonary only 222 44 194 37 207 40 623 40
- Lymphatic 147 29 122 23 122 24 391 25
- Pleural 32 6 39 7 44 9 115 7
- Connective tissue 35 7 14 3 17 3 66 4
- Kidney/genito-urinary 20 4 14 3 8 2 42 3
- Miliary 11 2 7 1 5 1 23 1
- Brain/central nervous system 14 3 16 3 6 1 36 2
- Gastrointestinal 21 4 12 2 20 4 53 3
- Other 38 7 37 7 37 7 112 7
Case classification New active case 478 94 500 95 474 93 1452 94
Previously treated in Australia 12 2 9 2 12 2 33 2
Previously treated overseas 14 3 18 3 19 4 51 3
Classification unknown 3 1 2 0 7 1 12 1
Laboratory confirmation Laboratory confirmed (total) 390 77 399 75 383 75 1172 76
- Culture positive 364 72 385 73 362 71 1111 72
- PCR positive only 26 5 14 3 21 4 61 4
Clinical diagnosis only 117 23 130 25 129 25 376 24
Pulmonary cases (% of pulmonary cases)
Culture positivea 185 65 214 64 176 58 575 62
Culture negativea 94 33 105 31 113 37 312 34
Culture not reporteda 6 2 16 5 16 5 38 4
Smear positivea 88 31 112 33 74 24 274 30
Smear negativea 191 67 207 62 215 70 613 66
Smear not reporteda 6 2 16 5 16 5 38 4
HIV Tested 317 63 375 71 359 70 1051 68
Positive (% is of those tested for HIV) 8 3 9 2 11 3 28 3
PCR: polymerase chain reaction
aIncludes only respiratory culture/smear results.
suggestive evidence. Of pulmonary cases, 62% (n¼575) had M. tuberculosis isolated from a respiratory sample; 30% (n¼274) of pulmonary cases were direct sputum smear-positive.
Of cases where the nature of identification was reported (n¼1529), the majority (78%) were identified through investigation of symptomatic disease. This was followed by screening for TB (13%); that is, post-migration screen-ing, then contact tracing (6%).
Case classification
Case classification remained stable over the 3-year period from 2009 to 2011, with new active cases making up 94% of all reported cases (Table 3). Previously treated cases made up the remainder, with 3% of cases having received partial or complete treatment overseas and 2% having received partial or complete treatment in Australia.
HIV co-infection
The proportion of cases that were tested for HIV has increased since 2009, with 68% of cases being tested overall for this period. Of those tested for HIV, 28 cases had HIV co-infection (3%) (Table 3). Of HIV co-infected cases, 74% were male and all were aged between 20 and 59 years. Five (18%) were Australian-born, while the remain-ing cases were born primarily in South and South-East Asian and African countries.
Clinical outcomes
Known clinical outcome was recorded for 1033 cases in 2009 and 2010 (Table 4). A total of 87% (n¼904) of cases were successfully treated, consisting of 84% (n¼869) who completed treatment and 3% (n¼35) who were considered cured (culture positive prior to treatment and culture nega-tive after completion of treatment). There were five TB-related deaths reported, all in 2009. Twenty-three cases (2%) defaulted from treatment; the remainder were either transferred overseas, died of a non-TB related cause, or were continuing on treatment at the time of analysis.
Drug resistance
Between 2009 and 2011 there were 20 cases of MDR-TB reported (including one case with XDR-TB). All but two cases of MDR-TB were overseas-born, including seven born in the Western Pacific Region and eight born in South-East Asia. Of the two Australian-born MDR-TB cases, one had travelled to a high-risk country for more than 3 months, while the other had travelled to several high-risk countries on multiple occasions but never for more than 3 months. The proportion of cases with mono-resistance to rifampicin has remained stable at 1–2% of cases. However, the propor-tion of cases with mono-resistance to isoniazid has decreased from 9.3% of cases in 2009 to 5.3% of cases in 2011. This trend was found to be statistically significant when tested
using the Chi-square test for trend (x2¼5.8, P¼0.02). However, when a longer period is observed (2007–2011) there is no statistically significant trend.
Risk factors
The most commonly identified risk factor for TB in notified cases between 2009 and 2011 was being born in a high-risk country, with 80% of all cases reporting this risk factor. Past residence of more than 3 months in a high-risk country was reported by 47% of all cases. Other reported risk factors are presented inTable 5.
There was variation in the reported risk factors between Australian- and overseas-born cases. In Australian-born cases, the most frequently reported risk factor was past residence of more than 3 months in a high-risk country (28% of Australian-born cases), followed by having a household member or close contact with TB (25% of Australian-born cases). Of overseas-born cases, 90% were born in a high-risk country and 50% had resided in a high-high-risk country for more than 3 months. Amongst cases born in a high-risk country, the median length of stay in Australia prior to onset of disease was 4 years (Inter-quartile Range 2–12 years).
Contact tracing
A total of 7338 contacts of TB cases were identified between 2009 and 2011. Of these, 6027 (82%) received contact screening. Of contacts screened, 48 (1%) were determined to have active TB disease. A further 186 (3%)
Table 4. Outcomes of clinical management of notified tuberculosis cases, NSW, 2009]2010
2009 2010
n % n %
Treatment successa 440 87 464 88
- Completed treatment 424 84 445 84
- Curedb 16 3 19 4
Defaulted 15 3 8 2
Treatment failurec 0 0 0 0
Treatment interruptedd 0 0 0 0
Transferred overseas 24 5 29 5
Died of tuberculosis 5 1 0 0
Died of other or unknown cause 21 4 14 3
Still undergoing treatment 0 0 13 2
Outcome unknown 2 0 1 0
Total number of cases 507 100 529 100
aDefined as either completed treatment or cured.
bBacteriologically confirmed cure of smear or culture positive pulmonary cases.
cTreatment completed but case not cured.
dTreatment interrupted for 2 months or more, but completed. Source: Notifiable Conditions Information Management System and Secure Analytics for Population Health Research and Intelligence, NSW Ministry of Health.
Tuberculosis in NSW, 2009–2011
contacts screened had a tuberculin skin test (TST) conver-sion. On initial TST screening, 33% of contacts who received screening were TST positive. Of contacts screened, 412 (7%) received prophylactic treatment. Further breakdown of contact screening data by year is presented inTable 6.
Discussion
Between 2003 and 2011 there was a small but steady increase in the number of notifications of TB in NSW.
This increase is consistent with recent national trends8and is an indicator of the need for continued TB control measures. As the majority of TB notifications in NSW are in persons who were born in or have lived in a country with a high incidence of TB, the epidemiology of TB notifications in NSW can be expected to broadly reflect global TB trends. The notification rate for TB continues to remain highest in the Sydney metropolitan area, particu-larly within Sydney’s inner city and western suburbs. This has previously been suggested to be a reflection of migrant settlement patterns within NSW.2Between 2009 and 2011
Table 5. Risk factors for tuberculosis (TB) among notified cases, by country of birth, NSW, 2009]2011
Australian-born Overseas-born All cases
n % n % n %
Child (Australian-born) of parent(s) born in a high-risk countrya 21 11.9 n/a n/a 21 1.4
Born in a high-risk countryb n/a n/a 1234 90.0 1234 79.7
Past residence ($3 months) in a high-risk country 49 27.7 685 50.0 734 47.4
Household member or close contact with TB 45 25.4 161 11.7 206 13.3
Immunosuppressive therapy or condition 28 15.8 128 9.3 156 10.1
Currently or ever employed in the health care industry 12 6.8 102 7.4 114 7.4
Previously diagnosed with TB 12 6.8 73 5.3 85 5.5
Risk not able to be determined or not assessed 32 18.1 51 3.7 83 5.4
Chest X-ray suggestive of old untreated TB 2 1.1 12 0.9 14 0.9
Ever employed in a residential institution 0 0.0 7 0.5 7 0.5
Currently or ever residing in a homeless shelter 4 2.3 6 0.4 10 0.6
Currently or ever residing in a residential institution 2 1.1 6 0.4 8 0.5
Ever resided in a correctional facility 4 2.3 3 0.2 7 0.5
Other risk factor 19 10.7 57 4.2 76 4.9
n/a: not applicable
aRefers to children aged under 15 years who were born in Australia but whose parent or parents were born in a high-risk country. bAs determined by the clinician assessing the patient.
Source: Notifiable Conditions Information Management System and Secure Analytics for Population Health Research and Intelligence, NSW Ministry of Health.
Table 6. Outcomes of contact tracing of notified tuberculosis (TB) cases, in NSW, 2009]2011
2009 2010 2011 Total
n % n % n % n %
Contacts identified 2527 2427 2384 7338
Contacts screeneda 2083 82 1840 76 2104 88 6027 82
Contacts with active TBb 10 0 25 1 13 1 48 1
Contacts TST positive on initial screenb 652 31 704 38 631 30 1987 33
Contacts TST positive with risk factors for exposure/BCGb 565 27 750 41 596 28 1911 32
Contacts with TST conversionb 70 3 57 3 59 3 186 3
Contacts on preventive therapyb 127 6 186 10 99 5 412 7
BCG: Bacille Calmette-Gue´rin vaccine TST: tuberculin skin test
aPercentage of all contacts identified. bPercentage of all contacts screened.
there were 24 cases of TB reported in Aboriginal people in NSW; this is double the number of cases reported for the 3 years prior (2006–2008).2
Drug resistance is one of the most significant emerging issues in TB control globally.1In NSW the proportion of MDR-TB cases continues to remain low (1.3%). This is lower than the national proportion of cases with MDR-TB in 2008 (2.4%).9 WHO estimates that 3.7% of new TB cases globally are MDR-TB.1Despite the low proportion of cases with MDR-TB in NSW, the number of MDR-TB cases notified appears to be increasing. Between 2009 and 2011 the average annual number of MDR-TB cases was 6.7 per year, an increase from 3.8 cases per year between 2003 and 2007.4Due to the small numbers of MDR-TB cases, it is difficult to be certain whether this is a true increase or natural variation.
The proportion of cases tested for HIV co-infection has increased from 54% of cases in 2008 to 70% of cases in 2011.2 Despite this increase NSW remains behind the national level of 81% of cases tested for HIV in 2009.8 Further work is needed to reach the national performance indicator of 100% of TB cases assessed for HIV. Despite increased testing, the proportion of cases with HIV co-infection remains low (3%). This is consistent with the proportion of HIV co-infected TB cases nationally.8
Conclusion
The effectiveness of TB control services in NSW is evidenced by low mortality from TB, the high proportion of cases successfully treated, minimal local transmission of TB and extensive screening of contacts. Incremental increases in the overall notification rate of TB in the last 8 years, an increase in the average annual number of MDR-TB cases and ongoing local transmission within sub-groups of the population highlight the need for contin-ued vigilance in TB control.
Acknowledgments
The authors wish to acknowledge staff from the network of Chest Clinics and Public Health Units in NSW who collected the data. We also acknowledge Dr Vitali Sintchenko, Peter Jelfs and staff of the NSW Mycobacterium Reference Laboratory at the Institute for Clinical Pathology and Medical Research, Westmead Hospital.
References
1. World Health Organization. Global tuberculosis report 2012. Geneva: World Health Organization; 2012.
2. Roberts-Witteveen AR, Christensen AJ, McAnulty JM. EpiRe-view: Tuberculosis in NSW, 2008.N S W Public Health Bull 2010; 21(8): 174–82. doi:10.1071/NB10005
3. Communicable Diseases Branch. GL2005_030 Tuberculosis prevention and control services: the role of chest clinics in NSW. Sydney: NSW Department of Health; 2005.
4. O’Connor BA, Fritsche LL, Christensen AJ, McAnulty JM. EpiReview: Tuberculosis in NSW, 2003–2007.N S W Public
Health Bull2009; 20(4): 59–68. doi:10.1071/NB09001
5. World Health Organization. Global tuberculosis control 2011. Geneva: World Health Organization; 2011.
6. National Tuberculosis Advisory Committee. Multi-drug resis-tant tuberculosis.Commun Dis Intell2007; 31(4): 406–9.
7. Australian Bureau of Statistics. Standard Australian Classifica-tion of Countries (SACC). Canberra: Australian Bureau of Statistics; 2011.
8. Barry C, Waring J, Stapledon R, Konstantinos A; National Tuberculosis Advisory Committee, for the Communicable Dis-eases Network Australia. Tuberculosis notifications in Australia, 2008 and 2009.Commun Dis Intell2012; 36(1): 82–94.
9. Lumb R, Bastian I, Carter R, Jelfs P, Keehner T, Sievers A. Tuberculosis in Australia: bacteriologically confirmed cases and drug resistance, 2008 and 2009. A report of the Australian Mycobacterium Reference Laboratory Network.Commun Dis
Intell Q Rep2011; 35(2): 154–61.
Tuberculosis in NSW, 2009–2011
The use of mycobacterial interspersed repetitive
unit typing and whole genome sequencing
to inform tuberculosis prevention and control
activities
Gwendolyn L. Gilbert
A,B,Cand Vitali
Sintchenko
A,BA
Centre for Infectious Diseases and Microbiology, Westmead Hospital
B
Sydney Institute for Emerging Infectious Diseases and Biosecurity, The University of Sydney C
Corresponding author. Email: [email protected]
Abstract:Molecular strain typing of Mycobacte-rium tuberculosishas been possible for only about 20 years; it has significantly improved our under-standing of the evolution and epidemiology of Mycobacterium tuberculosis and tuberculosis disease. Mycobacterial interspersed repetitive unit typing, based on 24 variable number tandem repeat unit loci, is highly discriminatory, relatively easy to perform and interpret and is currently the most widely used molecular typing system for tuberculosis surveillance. Nevertheless, clusters identified by mycobacterial interspersed repetitive unit typing sometimes cannot be confirmed or adequately defined by contact tracing and additional methods are needed. Recently, whole genome sequencing has been used to identify single nucleo-tide polymorphisms and other mutations, between genotypically indistinguishable isolates from the same cluster, to more accurately trace transmission pathways. Rapidly increasing speed and quality and reduced costs will soon make large scale whole genome sequencing feasible, combined with the use of sophisticated bioinformatics tools, for epidemio-logical surveillance of tuberculosis.
Unlike many other bacterial pathogens, different strains of Mycobacterium tuberculosis complex cannot be easily distinguished by the use of phenotypic methods. It was not until the 1990s, whenM. tuberculosiscomplex molecular typing methods were developed, that it became possible to
accurately identify tuberculosis (TB) transmission and study the origins and global distribution ofM. tuberculosis com-plex genotypes.M. tuberculosiscomplex is a clonal species, in which horizontal transmission (recombination) of genetic material is rare. Genetic variation results from: (a) point mutations or single nucleotide polymorphisms (SNPs); (b) small DNA insertions or deletions, often mediated by mobile genetic elements, such as insertion sequences (IS); (c) larger DNA deletions, resulting in regions of difference (RDs) between strains, major enough to determine subspe-cies within theM. tuberculosiscomplex; and (d) variation in numbers of repeat sequences at various genomic loci. All of these are potential genotyping targets.
The appropriate choice of targets depends on the purpose of genotyping. For example, monitoring TB transmission requires targets that change rapidly enough to distinguish epidemiologically unrelated strains (such as IS or repeat sequences), but may not provide accurate information about lineage, whereas studies of long-term epidemiologi-cal trends and lineages require more stable targets reflect-ing rare genetic events (such as SNPs or RDs) that can trace the origins and global spread of different strains.
The rationale for molecular typing depends on the setting. In low-incidence settings it is often used, routinely, to identify case clusters (and, potentially, their sources) that are not apparent by conventional contact tracing. Routine typing can also identify laboratory contamination and false-positive culture results and, so, prevent unnecessary treatment. In high-prevalence settings, molecular typing is more likely to be performed, selectively, to investigate the evolution and transmission ofM. tuberculosis to inform and improve TB control programs.
Strain typing methods
containing IS6110 with a labelled molecular probe and separating them on a gel to produce a strain-specific banding pattern. Its disadvantages are that it requires prolonged incubation of isolates to produce a large enough quantity of DNA and the banding patterns can be difficult to interpret and reproduce. However, it has been used successfully, for many years, to provide insights into M. tuberculosistransmission, distinguish reactivation from reinfection, and identify laboratory cross-contamination.2 Spoligotyping detects the presence or absence of 43 non-repetitive spacer oligonucleotides, which are variably interspersed between short chromosomal repeats at the direct repeat locus of theM. tuberculosisgenome.3,4The direct repeat locus is amplified by polymerase chain reaction (PCR) and the product is hybridized to a series of probes on a strip to identify the presence of spacer sequences. It requires relatively little DNA and can be used on early cultures or clinical specimens.3 The results are objective and reproducible but it is less discriminatory than IS6110-RFLP and so less suitable for transmission studies. However, it differentiates M. tuberculosis strains into broad families that generally correspond with geographic areas5and, sometimes, with characteristics such as viru-lence, transmissibility and resistance.6
Recently, mycobacterial interspersed repetitive unit (MIRU) typing has largely overtaken both IS6110 and spoligotyping, although they are sometimes used together. MIRUs are tandem repeat sequences, dispersed among intergenic regions of theM. tuberculosisgenome, which vary between M. tuberculosis strains according to the number of repeats at each locus. They are one of a group of variable number tandem repeat (VNTR) sequences, which are the basis of multilocus VNTR analysis (MLVA), a common bacterial genotyping method.
M. tuberculosisMIRU-VNTR typing, originally based on 12 loci,7is rapid, objective and reproducible. It was rapidly adopted as the basis for large-scale, high-throughput M. tuberculosis genotyping8–10 but, even in combination with spoligotyping, was less discriminatory than IS6110 fingerprinting, especially for isolates of the widespread Beijing spoligotypes.11Because of the potential for false clusters, identified by MIRU-12 and spoligotyping, IS6110-RFLP typing of clustered isolates was often needed to more accurately define outbreaks,12especially if there were no obvious epidemiological links between cases. Subsequently, a more discriminatory set of 24-MIRU-VNTR loci, including the original 12, was identified. MIRU-24 typing of more than 800 geographically diverse isolates, representing all major lineages, identified 40% more genotypes and demonstrated a fourfold lower rate of clustering than MIRU-12 typing.13Even a smaller subset of 15 loci, with the highest evolutionary rates, was as discriminatory as IS6110-RFLP typing. Thus, MIRU-15 typing was proposed as a new standard for routine use and
MIRU-24 as a high-resolution alternative for phylogenetic studies.11,13Others have confirmed the higher discrimina-tory power of MIRU-24, compared with MIRU-12.14
MIRU-24 typing
MIRU-24 (or -15) is now the new ‘gold standard’ for routineM. tuberculosistyping. To facilitate global epide-miological studies, a web-based database (http://www. miru-vntrplus.org/) has been established, based on a col-lection of 186 reference strains, representing the primary M. tuberculosis complex lineages.15,16 The database includes geographic origin, drug susceptibility profile and comprehensive genetic lineage information, including the MIRU-24, SNP and RD profiles, spoligotype and IS6110-RFLP fingerprint of each strain. MIRU-24 analy-sis reliably predicted the correct lineage of greater than 99% of nearly 700 external strains.15,16 The database allows users to compare strains with the reference set, search for similar strains and map geographic information. An expanding genotype nomenclature (MLVA MtbC15-9 type) has been implemented to facilitate comparison between laboratories.16
MIRU typing can be performed either by separate PCRs for each locus and measurement of amplicon sizes by gel electrophoresis or by several multiplex PCRs, using fluo-rescently labeled primers, and determination of amplicon sizes by capillary electrophoresis in a DNA analyser. The number of tandem repeats (of known length) at each locus is calculated from the amplicon size and results are expressed as a numerical code corresponding to the numbers of repeats at each locus, which is the strain ‘fingerprint’.
In a recent international proficiency study17of MIRU-24 typing, a panel of 30 DNA extracts, from 20 well-characterised M. tuberculosis strains, was tested in 37 laboratories. There was wide variation in reproducibility of results between laboratories (average 60%); it was better (88%) when commercial kits were used than when in-house-adapted methods using capillary (70%) or gel (50%) electrophoresis were used. However, many in-house-adapted methods achieved greater than 80% reproducibil-ity, suggesting that, with care, they can be used reliably.17 The study demonstrated potential pitfalls of comparing genotypes between laboratories and the importance of quality assurance programs.
The New South Wales (NSW) Mycobacterium Reference Laboratory has used IS6110-RFLP and spoligotyping since 2004, MIRU-12 since 2005 and MIRU-24 since 2010, to confirm suspected transmission between epidemiologically-related TB cases,18 investigate out-breaks,12differentiate TB reactivation from reinfection,19 identify otherwise unsuspected case clusters or laboratory contamination and estimate rates of recent transmission.10 The most common spoligotypes in NSW belong to the
MIRU typing and whole genome sequencing
Beijing family (more than one-quarter of all isolates examined), which was first described in China and neigh-bouring countries in 1995, and has since been reported in many parts of the world, especially Asia and the former Soviet states. We have tracked an expanding cluster of cases, due to a strain with a unique MIRU-24 profile, among Aboriginal communities in the NSW North Coast region, which has involved at least 30 cases since 2000 (unpublished data; see also Devlin and Passmore20).
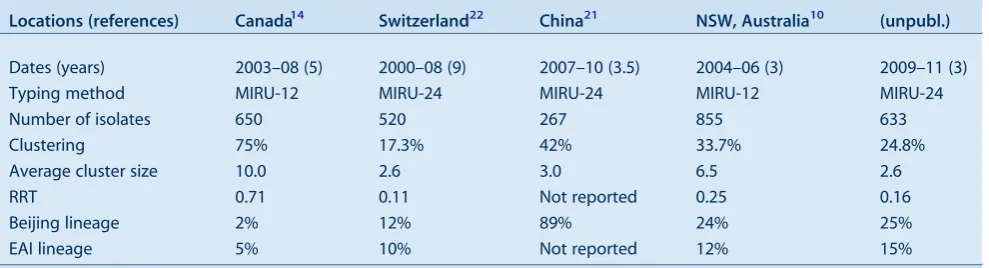
Table 1compares our MIRU-typing results with those of several studies showing rates of recent transmission (RRT) using this method.14,21,22It is worth noting that a low RRT reflects the degree of success of the local TB control program.
Despite the improved discriminatory power of MIRU-24 typing, apparent clusters cannot always be confirmed, even by the most detailed contact tracing, suggesting some false clustering, especially in settings with high rates of transmission of closely related M. tuberculosis strains. In China, a high proportion of cases are caused by the so-called ‘modern’ Beijing lineage. Isolates belonging to this lineage have only one or two IS6110copies and, generally, similar MIRU-24 patterns. False clustering of MIRU patterns occurs due to homoplasy or convergent evolution (independent mutations resulting in the same genotypes among isolates with different ancestry). This can mean, for example, that reinfection with a similar strain could be misinterpreted as reactivation of infection due to treatment failure. In future, problems like this could be resolved by whole genome sequencing, or inclusion of additional targets in typing methods. For example, SNPs have been identified, which can reliably differentiate these otherwise homogeneous ‘modern’ Beijing strains, with the same or very similar, MIRU-24 types, into several lineages. In a recent study, the combi-nation of MIRU-15 typing plus PCR amplification and sequence typing of three hypervariable regions and eight SNPs overcame false clustering; it was therefore
proposed for second-line typing of clustered isolates in settings of high prevalence of Beijing strains.21
Whole genome sequencing
The ultimate strain typing system is whole genome sequencing which, until recently, seemed fanciful because of the cost, time taken and requirement for sophisticated bioinformatics tools for sequence analysis. However, recent advances in sequencing technology have dramati-cally reduced the cost and turnaround time and improved the quality of sequence data and several recent investiga-tions have demonstrated its potential.
Whole genome sequencing was used in the Netherlands to investigate a well-characterisedM. tuberculosis transmis-sion chain (confirmed by genotyping and contact tracing) involving five patients aged over 12 years, for which no source had been identified.23Four SNPs, a tandem-repeat polymorphism and an IS6110transposition were identified between the first and last isolates of this cluster. The remaining isolates were screened for these six polymorph-isms and five were found in isolates from one patient, an alcoholic who had been non-compliant with treatment. It was hypothesised that molecular evolution ofM. tubercu-losis in vivomay be driven by environmental factors such as intermittent antibiotic use leading to successive bursts of multiplication, or by genomic stress due to alcohol abuse. Identifying factors that stimulate mutational bursts could have major implications for TB management.23 In a Canadian study,24whole genome sequencing of 32 isolates from a large 3-year community outbreak and four unrelat-ed historical isolates, all with identical MIRU-24 and IS6110-RFLP types, was combined with social network analysis based on patient interviews, to determine the origin and transmission dynamics of the outbreak. Analy-sis of more than 200 SNPs revealed two genetically distinct lineages, both represented among historical isolates, indi-cating that they had separated before the outbreak started.
Table 1. Comparison ofMycobacterium tuberculosisclustering rates in recent studies of tuberculosis transmission
Locations (references) Canada14 Switzerland22 China21 NSW, Australia10 (unpubl.)
Dates (years) 2003–08 (5) 2000–08 (9) 2007–10 (3.5) 2004–06 (3) 2009–11 (3)
Typing method MIRU-12 MIRU-24 MIRU-24 MIRU-12 MIRU-24
Number of isolates 650 520 267 855 633
Clustering 75% 17.3% 42% 33.7% 24.8%
Average cluster size 10.0 2.6 3.0 6.5 2.6
RRT 0.71 0.11 Not reported 0.25 0.16
Beijing lineage 2% 12% 89% 24% 25%
EAI lineage 5% 10% Not reported 12% 15%
EAI: East African Indian
MIRU: mycobacterial interspersed repetitive unit
Additional, targeted social network and epidemiological analyses identified three co-primary case-patients who had been symptomatic for prolonged periods before diagnosis. The outbreak coincided with an increase in crack cocaine use in the community.24Whole genome sequencing impli-cated socio-environmental factors, not identified by conventional genotyping and contact tracing, in triggering simultaneous expansion of two pre-existing M. tuber-culosislineages that were subsequently sustained within a high-risk social network.
The exponential fall in cost and increased speed and quality of whole genome sequencing will continue.25Only the availability of appropriate tools to analyse and interpret the results will limit its use. It has the potential to rapidly trackM. tuberculosistransmission and microevolution and identify virulent and antibiotic resistant strains. When combined with appropriate clinical data this will improve our understanding of disease risks and how to prevent it; allow more timely and individually targeted therapy; and identify new vaccine, antibiotic and diagnostic targets.
Conclusion
In the relatively short period since molecular strain typing ofM. tuberculosishas been available and widely used, it has considerably increased our understanding of the evolution and modes of transmission of this ubiquitous and important pathogen. It has demonstrated that transmission can occur as a result of apparently casual, transient contact by leading to more detailed investigation of possible common sources of exposure of apparently unrelated individuals who share the same infecting strain. It has allowed comparison of rates of clustering between different population groups and communities, which reflects and can lead to improvement in the efficacy of TB control programs. Finally, it has provided new insights into the evolution ofM. tuberculosis over long periods of time and widely distant geographic regions and also during the course of a single case cluster. As methods have improved from the highly discriminatory but slow and technically demanding IS6110RFLP to the simpler, but equally discriminatory MIRU-24, genotyping has become more accessible, which means that our under-standing of M. tuberculosis evolution and epidemiology has correspondingly increased. Whole genome sequencing promises to provide further insights and even more discrim-inatory and informative strain typing.
References
1. van Embden JD, Cave MD, Crawford JT, Dale JW, Eisenach KD, Gicquel B et al. Strain identification ofMycobacterium
tuberculosisby DNA fingerprinting: recommendations for a
standardized methodology.J Clin Microbiol1993; 31: 406–9.
2. Houben RMGJ, Glynn JR. A systematic review and meta-analysis of molecular epidemiological studies of tuberculosis: development of a new tool to aid interpretation.Trop Med Int
Health2009; 14: 892–909. doi:10.1111/j.1365-3156.
2009.02316.x
3. Kamerbeek J, Schouls L, Kolk A, van Agterveld M, van Soolingen D, Kuijper S et al. Simultaneous detection and strain differentiation ofMycobacterium tuberculosisfor diagnosis and epidemiology.J Clin Microbiol1997; 35: 907–14.
4. Soini H, Pan X, Teeter L, Musser JM, Graviss EA. Transmission dynamics and molecular characterization ofMycobacterium
tuberculosisisolates with low copy numbers of IS6110.J Clin
Microbiol2001; 39: 217–21.
doi:10.1128/JCM.39.1.217-221.2001
5. Filliol I, Driscoll JR, van Soolingen D, Kreiswirth BN, Kremer K, Valetudie G et al. Snapshot of moving and expanding clones
ofMycobacterium tuberculosisand their global distribution
assessed by spoligotyping in an international study.J Clin
Microbiol2003; 41: 1963–70.
doi:10.1128/JCM.41.5.1963-1970.2003
6. Buu TN, Huyen MN, Lan NTN, Quy HT, Hen NV, Zignol M et al. The Beijing genotype is associated with young age and multidrug-resistant tuberculosis in rural Vietnam.Int J Tuberc
Lung Dis2009; 13: 900–6.
7. Supply P, Mazars E, Lesjean S, Vincent V, Gicquel B, Locht C. Variable human minisatellite-like regions in theMycobacterium
tuberculosisgenome.Mol Microbiol2000; 36: 762–71.
doi:10.1046/j.1365-2958.2000.01905.x
8. Cowan LS, Diem L, Monson T, Wand P, Temporado D, Oemig TV et al. Evaluation of a two-step approach for large-scale, prospective genotyping ofMycobacterium tuberculosis isolates in the United States.J Clin Microbiol2005; 43: 688–95. doi:10.1128/JCM.43.2.688-695.2005
9. van Deutekom H, Supply P, de Haas PEW, Willery E, Hoijng SP, Locht C et al. Molecular typing ofMycobacterium tuberculosis by mycobacterial interspersed repetitive unit-variable-number tandem repeat analysis, a more accurate method for identifying epidemiological links between patients with tuberculosis.J Clin
Microbiol2005; 43: 4473–9.
doi:10.1128/JCM.43.9.4473-4479.2005
10. Gallego B, Sintchenko V, Jelfs P, Coiera E, Gilbert GL. Three-year longitudinal study of genotypes ofMycobacterium
tuberculosisin a low prevalence population.Pathology2010;
42: 267–72. doi:10.3109/00313021003631346
11. Allix-Be´guec C, Fauville-Dufaux M, Supply P. Three-year population-based evaluation of standardized mycobacterial interspersed repetitive-unit-variable-number tandem-repeat typing ofMycobacterium tuberculosis. J Clin Microbiol2008; 46: 1398–406. doi:10.1128/JCM.02089-07
12. Merritt TD, Sintchenko V, Jelfs P, Worthing M, Robinson B, Durrheim DN et al. An outbreak of pulmonary tuberculosis in young Australians.Med J Aust2007; 186: 240–2.
13. Supply P, Allix C, Lesjean S, Cardoso-Oelemann M, Rusch-Gerdes S, Willery E et al. Proposal for standardization of optimized mycobacterial interspersed repetitive unit-variable-number tandem repeat typing ofMycobacterium
tuberculosis. J Clin Microbiol2006; 44: 4498–510. doi:10.1128/
JCM.01392-06
14. Christianson S, Wolfe J, Orr P, Karlowsky J, Levett PN, Horsman GB et al. Evaluation of 24 locus MIRU-VNTR genotyping ofMycobacterium tuberculosisisolates in Canada.
Tuberculosis (Edinb)2010; 90: 31–8. doi:10.1016/
j.tube.2009.12.003
15. Allix-Be´guec C, Harmsen D, Weniger T, Supply P, Niemann S. Evaluation and strategy for use of MIRU-VNTRplus,
MIRU typing and whole genome sequencing
a multifunctional database for online analysis of genotyping data and phylogenetic identification ofMycobacterium tuberculosis complex isolates.J Clin Microbiol2008; 46: 2692–9.
doi:10.1128/JCM.00540-08
16. Weniger T, Krawczyk J, Supply P, Niemann S, Harmsen D. MIRU-VNTRplus: a web tool for polyphasic genotyping of
Mycobacterium tuberculosiscomplex bacteria.Nucleic Acids
Res2010; 38: W326–31. doi:10.1093/nar/gkq351
17. de Beer JL, Kremer K, Kodmon C, Supply P, van Soolingen D. Global Network for the Molecular Surveillance of Tuberculosis 2009. First worldwide proficiency study on variable-number tandem-repeat typing ofMycobacterium tuberculosiscomplex strains.J Clin Microbiol2012; 50: 662–9. doi:10.1128/ JCM.00607-11
18. Jelfs P, Sintchenko V, Gilbert GL. Genotyping of
Mycobacte-rium tuberculosisin New South Wales: results from 18 months
of a statewide trial.N S W Public Health Bull2006; 17: 81–5. doi:10.1071/NB06020
19. Dobler CC, Crawford ABH, Jelfs PJ, Gilbert GL, Marks GB. Recurrence of tuberculosis in a low-incidence setting.Eur Respir J2009; 33: 160–7. doi:10.1183/ 09031936.00104108
20. Devlin S, Passmore E. Ongoing transmission of tuberculosis in Aboriginal communities in NSW.N S W Public Health Bull 2013; 24(1): 38–42.
21. Luo T, Yang C, Gagneux S, Gicquel B, Mei J, Gao Q. Combi-nation of single nucleotide polymorphism and variable-number tandem repeats for genotyping a homogenous population of
Mycobacterium tuberculosisBeijing strains in China.J Clin
Microbiol2012; 50: 633–9. doi:10.1128/JCM.05539-11
22. Fenner L, Gagneux S, Helbling P, Battegay M, Rieder HL, Pfyffer GE et al.Mycobacterium tuberculosistransmission in a country with low tuberculosis incidence: role of immigration and HIV infection.J Clin Microbiol2012; 50: 388–95. doi:10.1128/ JCM.05392-11
23. Schu¨rch AC, Kremer K, Kiers A, Daviena O, Boeree MJ, Siezen RJ et al. The tempo and mode of molecular evolution of
Mycobacterium tuberculosisat patient-to-patient scale.Infect
Genet Evol2010; 10: 108–14. doi:10.1016/
j.meegid.2009.10.002
24. Gardy JL, Johnston JC, Ho Sui SJ, Cook VJ, Shah L, Brodkin E et al. Whole-genome sequencing and social-network analysis of a tuberculosis outbreak.N Engl J Med2011; 364: 730–9. doi:10.1056/NEJMoa1003176
Diagnosis, treatment and prevention
of tuberculosis in children
Philip Britton
A, Carlos M. Perez-Velez
B,Cand Ben J. Marais
A,C,DA
The Children’s Hospital at Westmead B
Grupo Tuberculosis Valle-Colorado and Clı´nica Leo´n XIII, IPS Universidad de Antioquia, Colombia
C
Sydney Emerging Infectious Diseases and Biosecurity Institute, The University of Sydney
D
Corresponding author. Email: [email protected]
Abstract: In Australia, tuberculosis notification rates have plateaued at a low level and disease is highly concentrated in immigrant communities where children may be affected. Many clinicians regard tuberculosis as an adult disease, hence it is rarely considered in the differential diagnosis of sick children. This paper provides a brief overview of the natural history of the disease in children to demonstrate the importance of taking a careful tuberculosis exposure history. It also provides guidance regarding the diagnosis, treatment and prevention of tuberculosis in children. The man-agement of paediatric cases is not difficult if important differences with adult disease are care-fully considered; these differences are discussed in detail.
Tuberculosis (TB) remains a major, but often unrecog-nised, cause of disease and death among women and children in TB endemic areas.1Cases are highly concen-trated in areas affected by poverty, social disruption, human immunodeficiency virus (HIV) infection and drug-resistant TB,2,3 with increased international travel and immigration posing major challenges to the control of TB. In Australia, TB incidence rates are among the lowest in the world at 5–6 per 100 000 population per year.4 However, rates are highly variable and up to 10 times higher in certain sub-groups of the population. More than 85% of cases occur in immigrant populations and represent imported infection, with the top five countries of origin being India, Viet Nam, the Philippines, China and Indo-nesia, where high rates of drug-resistant TB have been recorded.2,4Evidence of local transmission is limited and restricted to particular disease clusters.5New South Wales (NSW) reports the highest absolute number of TB cases
within Australia.4,6In 2008, children aged under 15 years constituted less than 5% of the disease burden (18/498),6 similar to other developed countries with minimal internal transmission and routine provision of post-exposure pro-phylaxis to young and vulnerable children.7,8Despite low numbers of children with TB, Australian clinicians need to consider TB as part of the differential diagnosis, as cases are observed at regular intervals.9–13This brief overview focuses on recent advances in diagnosis and on issues related to the clinical care of children with TB.
Natural history of disease
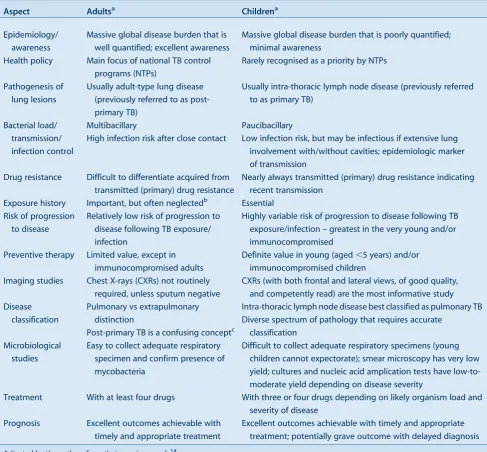
The pre-chemotherapy literature provides detailed natural history of disease descriptions which guide risk assessment and management.14,15An observation is that most children (.90%) who progress to TB disease do so within the first 12 months after primary infection; this is referred to as the ‘window of risk’. Another observation is the pronounced bi-modal risk profile: very young children (aged less than 2 years) experience the greatest risk; a nadir occurs at around 5–10 years of age and then an increase is seen with the onset of puberty. This coincides with a radical shift in the disease spectrum. In young children, lymph node disease with or without airway compression predominates, due to exuberant lymph node responses and small pliable airways. Dissemi-nated disease is also more common due to immature T-cell responses and poor disease containment. The sudden switch to adult-type TB that occurs around puberty, first in girls and then in boys, remains an enigma, but may shed light on key variables underlying individual vulnerability.16It is impor-tant to remember that adolescent children with adult-type disease are highly infectious.17Table 1 summarises some important differences between TB in adults and children.
Diagnosis
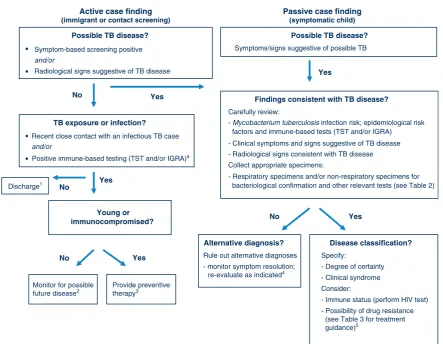
Children are usually evaluated for TB as a result of immigrant screening, contact investigation or following presentation with symptoms or signs suggestive of TB disease. It is important to distinguish these different entry points since they influence the diagnostic work-up and interpretation of results (Figure 1).Mycobacterium tuber-culosis infection detected during immigrant screening probably reflects remote past infection with reduced risk of disease progression, unless it is a young child or immunocompromised individual. M. tuberculosis infec-tion detected during contact investigainfec-tion is likely to be recent, implying a higher risk of disease progression, although this remains highly age-dependent. In this popu-lation, isolated radiographic findings in asymptomatic
children are problematic, since transient elements of the Ghon/primary complex are frequently visualised and not necessarily indicative of active disease. Observational studies and current World Health Organization guidance suggest that symptom-based screening is adequate, at least in older children, and the complete absence of current symptoms is sufficient to rule out TB disease in this group.18,19Table 2provides an overview of investigations to establish a diagnosis of TB in children.
Clinical evaluation
Children rarely present with near pathognomonic signs of TB such as a TB gibbus; most clinical manifestations are non-specific. In fact, one of the remarkable features of intra-thoracic TB is the frequent absence of physical signs
despite the presence of persistent non-remitting symptoms. Furthermore, despite minimal clinical findings, the clini-cian may be surprised by the radiographic extent of disease. The pathophysiological explanation for this discrepancy is not clear but may reflect the fact that TB often causes a vasculitis (as observed with TB meningitis) in addition to parenchymal involvement. This implies that both oxygen exchange and blood supply are reduced in affected parts of the lung, limiting the resultant ventilation:perfusion mis-match which may explain the frequent absence of acute respiratory distress despite extensive lung involvement.
A detailed history should explore the likelihood of recent (during the past 12 months) TB exposure and allow accurate symptom characterisation. This is important
Table 1. Tuberculosis (TB): differences between adults and children
Aspect Adultsa Childrena
Epidemiology/ awareness
Massive global disease burden that is well quantified; excellent awareness
Massive global disease burden that is poorly quantified; minimal awareness
Health policy Main focus of national TB control programs (NTPs)
Rarely recognised as a priority by NTPs
Pathogenesis of lung lesions
Usually adult-type lung disease (previously referred to as post-primary TB)
Usually intra-thoracic lymph node disease (previously referred to as primary TB)
Bacterial load/ transmission/ infection control
Multibacillary
High infection risk after close contact
Paucibacillary
Low infection risk, but may be infectious if extensive lung involvement with/without cavities; epidemiologic marker of transmission
Drug resistance Difficult to differentiate acquired from transmitted (primary) drug resistance
Nearly always transmitted (primary) drug resistance indicating recent transmission
Exposure history Important, but often neglectedb Essential
Risk of progression to disease
Relatively low risk of progression to disease following TB exposure/ infection
Highly variable risk of progression to disease following TB exposure/infection – greatest in the very young and/or immunocompromised
Preventive therapy Limited value, except in immunocompromised adults
Definite value in young (aged,5 years) and/or immunocompromised children
Imaging studies Chest X-rays (CXRs) not routinely required, unless sputum negative
CXRs (with both frontal and lateral views, of good quality, and competently read) are the most informative study Disease
classification
Pulmonary vs extrapulmonary distinction
Post-primary TB is a confusing conceptc
Intra-thoracic lymph node disease best classified as pulmonary TB Diverse spectrum of pathology that requires accurate
classification Microbiological
studies
Easy to collect adequate respiratory specimen and confirm presence of mycobacteria
Difficult to collect adequate respiratory specimens (young children cannot expectorate); smear microscopy has very low yield; cultures and nucleic acid amplication tests have low-to-moderate yield depending on disease severity
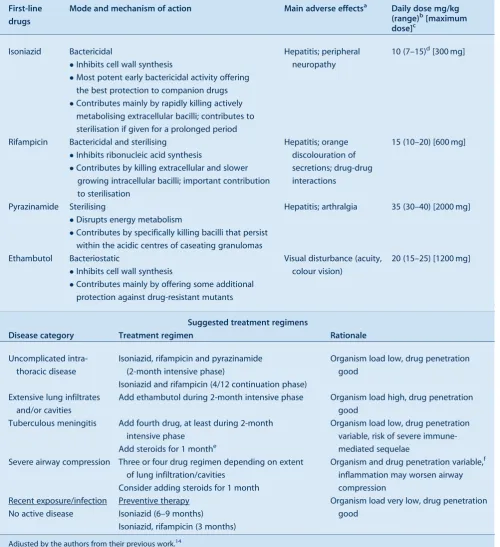
Treatment With at least four drugs With three or four drugs depending on likely organism load and
severity of disease
Prognosis Excellent outcomes achievable with
timely and appropriate treatment
Excellent outcomes achievable with timely and appropriate treatment; potentially grave outcome with delayed diagnosis Adjusted by the authors from their previous work.14
aTypical characteristics in the absence of HIV-infection and/or severely compromised immunity.
bTaking a careful contact history is often neglected for adults, but has particular relevance for the identification of drug-resistant TB suspects. cThe old distinction between primary and post-primary TB obscures the fact that adult-type (post-primary; secondary) TB frequently results from
because poorly-defined symptoms have poor discrimina-tory power.20Common constitutional symptoms include decreased appetite (recent crossing of weight centiles is most informative), fatigue or reduced playfulness, and fever. Despite TB being an infectious disease, fever is often absent, low-grade or intermittent. With lung involve-ment, children usually present with a persistent non-remitting cough that is unresponsive to standard first-line treatment. Airway compression may manifest as loud (large airway) wheezing that does not respond to bronch-odilators. Clinical follow-up is a useful diagnostic tool in children with mild disease manifestations for whom the diagnosis cannot be made with certainty.20
Imaging studies
Chest radiography is generally the most informative inves-tigation and should include both frontal and lateral views. Lateral views are important as they improve assessment of
the mediastinum and hilar areas. Childhood intra-thoracic TB has a wide range of appearances associated with different disease entities, which justifies careful classifica-tion.21,22Visible hilar adenopathy with or without airway compression is highly suggestive of TB disease. High-resolution chest computed tomography (CT) provides the most accurate visualisation of intra-thoracic structures,23 but due to the high cost and associated radiation exposure its use should be limited to complicated cases. CT and/or magnetic resonance imaging (MRI) is the best way to visualise extrapulmonary lesions, especially intra-cranial pathology. MRI is more sensitive for detecting brainstem lesions or early perfusion defects (infarcts) and also provides better evaluation of the spine and soft tissues.24 Laboratory studies
Immune-based tests are severely limited by their inability to differentiateM. tuberculosisinfection from active disease,
Possible TB disease?
Symptoms/signs suggestive of possible TB
Possible TB disease?
• Symptom-based screening positive
• Radiological signs suggestive of TB disease
Young or immunocompromised?
Disease classification?
Specify:
- Degree of certainty - Clinical syndrome Consider:
- Immune status (perform HIV test) - Possibility of drug resistance (see Table 3 for treatment guidance)5
Provide preventive therapy3 Monitor for possible
future disease2
Alternative diagnosis?
Rule out alternative diagnoses - monitor symptom resolution; re-evaluate as indicated4
TB exposure or infection?
•Recent close contact with an infectious TB case
•Positive immune-based testing (TST and/or IGRA)a
Findings consistent with TB disease?
Carefully review:
- Mycobacterium tuberculosis infection risk; epidemiological risk factors and immune-based tests (TST and/or IGRA) - Clinical symptoms and signs suggestive of TB disease - Radiological signs consistent with TB disease Collect appropriate specimens:
- Respiratory specimens and/or non-respiratory specimens for bacteriological confirmation and other relevant tests (see Table 2) Active case finding
(immigrant or contact screening)
Passive case finding
(symptomatic child)
No
Yes
Yes
Yes
Yes No
No No
Yes
Discharge1 and/or
and/or
Figure 1. Algorithm for diagnosis and classification of tuberculosis (TB) in children. Adjusted by the authors from their previous work.14
HIV: human immunodeficiency virus; TST: tuberculin skin test; IGRA: interferon-gamma release assay.
aNeither of the immune-based tests (TST/IGRA) can ‘rule out’ TB disease with confidence and conversion may be delayed for 2–3
months after documented exposure. All children aged,5 years and any child with current symptoms should receive a chest X-ray. Diagnostic labels
1No TB exposure or infection.
2TB exposure/infection with low risk of progression to disease.
3TB exposure/infection with high risk of progression to disease.
4Not TB disease. 5TB disease.
Diagnosis, treatment and prevention of tuberculosis in children
and neither the purified protein derivative tuberculin skin test (TST) or interferon-gamma release assays (IGRAs) (e.g. QuantiFERON-Gold In TubeÒ) offer a simple solution.25IGRAs do not replace TSTs for the detection of M. tuberculosis infection in children and, like TSTs, cannot be used to exclude TB. In certain clinical situations IGRAs may be used in addition to TSTs to improve sensitivity and specificity in the detection of TB infection.25 Smear microscopy has poor sensitivity in young children, most of whom are paucibacillary and unable to expectorate; it has been largely superseded by culture and nucleic acid amplification tests (NAATs). In general, culture yields in children are lower than in adults, depending on the severity of disease as well as the quality, quantity and types of specimens collected. Two studies have evaluated the per-formance of the rapid NAAT-based XpertÒ MTB/RIF assay in children, demonstrating similar performance char-acteristics to adult studies, with excellent specificity and detection of around 70% of culture-positive cases.26,27 Collecting adequate respiratory specimens in young chil-dren is problematic, but gastric aspirates, induced sputum (with or without laryngopharyngeal suction) and broncho-alveolar lavage (in select patients) offer feasible
alternatives. A combination of specimens provides the best yield.28 Fine-needle aspiration biopsy has excellent utility in children with a peripheral lymph node mass.29 With tuberculous meningitis, slow clinical onset, cerebro-spinal fluid pleocytosis (with total cell count,500) and elevated protein is highly suggestive.30Despite the chal-lenges discussed, bacteriological confirmation should always be attempted, although it should not delay treat-ment initiation in young and vulnerable children. TB can be diagnosed with relative certainty based on a combina-tion of clinical, radiological, laboratory and histopatholog-ical (when feasible) findings consistent with TB disease, in association with epidemiolog

![Table 2.Number and rate per 100 000 of notified tuberculosis cases by Local Health District, NSW, 2009]2011](https://thumb-us.123doks.com/thumbv2/123dok_us/57535.2007370/5.595.59.555.415.748/table-number-notified-tuberculosis-cases-local-health-district.webp)
![Table 3.Clinical and diagnostic characteristics of notified tuberculosis cases, NSW, 2009]2011](https://thumb-us.123doks.com/thumbv2/123dok_us/57535.2007370/6.595.47.542.351.756/table-clinical-diagnostic-characteristics-notified-tuberculosis-cases-nsw.webp)
![Table 4.Outcomes of clinical management of notifiedtuberculosis cases, NSW, 2009]2010](https://thumb-us.123doks.com/thumbv2/123dok_us/57535.2007370/7.595.312.551.503.706/table-outcomes-clinical-management-notifiedtuberculosis-cases-nsw.webp)
![Table 6.Outcomes of contact tracing of notified tuberculosis (TB) cases, in NSW, 2009]2011](https://thumb-us.123doks.com/thumbv2/123dok_us/57535.2007370/8.595.49.543.99.327/table-outcomes-contact-tracing-notified-tuberculosis-cases-nsw.webp)