1556
Analytical Approach for Optimal Placement of
Distributed Generators in Power System
Sanjeeva Kumar R A 1, H R Sudarshan Reddy2, Anantapadmanabha T 3
Department of Electrical and Electronics 1,2,3UBDT,Davangere 1,2, NIEIT,Mysuru 3 Email : [email protected] 1,[email protected] 2
Abstract- With the increase in demand of electrical power, distributed generation plays a vital role in fulfilling the requirement of good power quality to be supplied to the consumer without interruption. Placement of distributed generator (DG) is important point to be considered in the distribution system as the location and size of DGs will have both positive and negative impact on the power system as improper placement may leads to increase in power loss and variation in voltage profiles, hence the optimal allocation is considered in the power system to reduce the power losses as well as to improve the voltage profiles. In this paper optimal location of dg is selected based on analytical method called Logarithmic voltage deviation index(LVDI) with different levels of DG penetration for TYPE I,TYPE II, and TYPE III DGs and active power losses are calculated after load flow and performance of voltage profiles are analyzed. Analysis is carried out on standard IEEE 33bus test system using Matlab.
Index Terms- Distributed generation, DG penetration, Logarithmic voltage deviation index, optimal allocation, power losses, voltage profiles,
1.
INTRODUCTIONThe term "distributed generation" (DG) refers to the production of electricity near the load center at the distribution level. The distributed generation resources are renewable energies and cogeneration (simultaneous production of heat and electricity). Distributed Energy Resources (DER) had changed many features of distribution system operation, design and Execution. With increase in number of decentralized systems with smaller generating units connecting directly to the distribution networks near load center, the distribution companies reduce loss in their networks.
The position and capacity of the DG must be optimized to increase the benefits and minimize their negative impacts on the power system. The technical parameters are voltage profile, system protection, reactive power, power loss, power quality, power control and conditioning, reliability and stability. Improper placement of DG will leads to the increment in system losses which includes both active and reactive power losses, operating cost and network capital cost. It also leads to injection of harmonics, possibility of reverse power flow, risking
the safety issues and complex controlling scheme. In view of these, proper allocation of distributed generation could enhance the network potential in terms of better voltage profile and lower the system power losses, while improving the quality of power supply.
With the above considerations the optimal allocation and sizing of DG is necessary to improve the overall efficiency of the system by reducing the losses and improving voltage profiles and performance of the power system.
2.
PROBLEM FORMULATIONAllocation of DG includes placement of DG at suitable Position, with suitable capacity (total with the addition of multiple DG‟s), and type of DG. There are four types of DGs available:
DG that injects active power only, for example photovoltaic
DG that injects reactive power, such as induction generators.
1557
DG that injects both active and reactive power, for example synchronous generator
2.1.Power loss calculation
The power loss equation is given by
∑ ( )
Voltage at the nodes should be within the limits
Where │Vi│ is the voltage magnitude at bus i and Vmin and Vmax are the minimum and maximum voltage limits respectively.
2.1.1. To find the optimal location of DG “The location of DG is chosen as the one that gives the best voltage profile. This could be done by injecting the DG at each node calculating the voltage index by using equation. The best location is selected as the node with maximum logarithmic voltage deviation index (LVDI).”
Where Vnew is voltage after dg placement and Vold is the voltage before the placement of dg. In this work, the DG are placed at the weak voltage nodes in ascending order and LVDI is calculated, the bus giving highest LVDI with the better voltage profile and lowest power loss is selected as the optimal location. “Hence, the algorithm consists of optimal sizing and sitting by using the proposed index (LVDI)”.
2.1.2. Sizing of DG
Penetration level of DG is chosen based on the fallowing equation. Active power demand is considered for TYPE I DG installation and similarly reactive and apparent power demands are considered for TYPE II and TYPE III DGs.
The objectives function for the DG Placement for minimization of real power loss and LVDI of DG
simultaneously. Here, the fitness function for the set objectives is formulated as given below:
F= F1 +F2
Where, F1 is the power loss minimization index and
F2 is the voltage profile improvement by reducing the
deviation index. The set of equality and inequality constraints are,
∑| || || | ( )
2.2.Proposed algorithm
In this paper, the DG are placed at the maximum power loss nodes in descending order and LVDI is calculated, the bus giving highest LVDI with the better voltage profile and lowest power loss is selected as the optimal location. “Hence, the algorithm consists of optimal sizing and sitting by using the proposed index (LVDI)”.
1558 Where, Vnew is voltage after load flow and Vold is
the base case voltage before load flow and LVDI is calculated, the bus giving highest LVDI is selected as initial bus for placement of DG. And load flow is run with integration of DG at different penetration levels and LVDI is calculated for base case voltage and new voltage obtained after load flow with DG integration, the bus giving highest LVDI with the better voltage profile and lowest power loss is selected as the optimal location. “Hence, the algorithm consists of optimal sitting by using the proposed index (LVDI) for different levels of DG penetration”.
2.2.1. Results and discussion
In this work, different types of DGs are discussed and are considered in the analysis and made to operate at different penetration levels in the power system and impact of those are studied which results in reduced power losses and improved voltage profiles and this is achieved by a new analytical technique called Logarithmic voltage deviation index .
The plots of voltage profile and power loss using type I, II and III DGs at 50% penetration are as shown. The comparison of the voltage profiles by introducing different types of DG‟s is shown below
Fig2: Comparison of voltage profiles at bus 8 for different type of DG‟s
The LVDI is carried out and calculated by considering three different methods to allocate DG for the initial case i.e, Minimum Voltage bus method, Maximum power loss method and a method considering initial base case voltage and the voltage after load flow as mentioned in the algorithm and
flow chart. LVDI values of TYPE I, II and III DGs after 50% penetration.
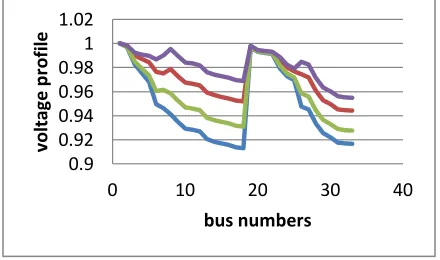
[image:3.612.72.292.450.580.2]The LVDI values obtained by integrating different TYPE of DGs are plotted in fig 3. And for the plot the node with maximum value is chosen as the best location where the best location obtained is at bus 6.The voltage profiles of different DGs at 50 % penetration level can be observed in fig4 and the graphs shows the variation of voltage at different nodes of different TYPEs of DGs and variation of power losses at all nodes of IEEE33 bus test system.
Fig 3: Comparision of LVDI values before and after installation of DG
Voltage profiles of IEEE33 bus at best location obtained from LVDI values at bus 6 for base case and with DG penetration at 50% for TYPE I, II and III. The minimum voltage and power losses before and after placement of all three types of DGs at the node 8 and node 6 are tabulated in table 1 and 2 respectively.
Fig4: Comparison of voltage profiles of bus 6 for different type of DG‟s
0.9 0.92 0.94 0.96 0.98 1 1.02
0 10 20 30 40
vol
ta
ge
p
rof
ile
bus numbers
0 0.2 0.4
1 4 7 10 13 1619 22 25 28 31
LV
D
I
bus numbers
0.85 0.9 0.95 1 1.05
1 4 7 10 13 16 19 22 25 28 31
vol
ta
ge
p
rof
ile
1559 Power loss and voltage profile at best location bus 6,
for 50% DG penetration TYPE I, II and III are tabulated below and it is ascertained that after the optimal allocation of DG at 6th bus there is an enhancement in the system performance.
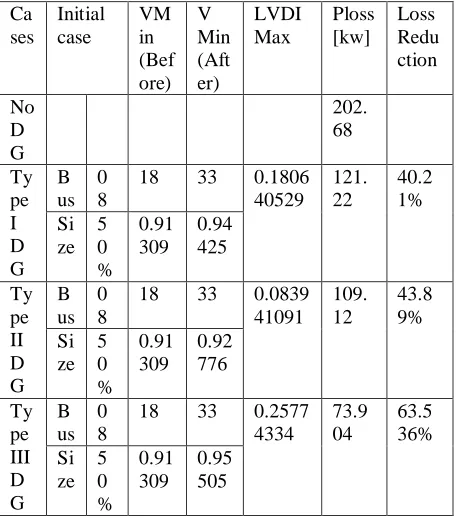
Table 1: Values of voltages and losses for initial case Ca ses Initial case VM in (Bef ore) V Min (Aft er) LVDI Max Ploss [kw] Loss Redu ction No D G 202. 68 Ty pe I D G B us 0 8
18 33 0.1806 40529 121. 22 40.2 1% Si ze 5 0 % 0.91 309 0.94 425 Ty pe II D G B us 0 8
18 33 0.0839 41091 109. 12 43.8 9% Si ze 5 0 % 0.91 309 0.92 776 Ty pe III D G B us 0 8
[image:4.612.67.295.210.469.2]18 33 0.2577 4334 73.9 04 63.5 36% Si ze 5 0 % 0.91 309 0.95 505
Table 2: Values of voltages and losses for optimal location Ca ses At optimal locatio n Vmi n Bef ore Vmi n Afte r LVD I Ploss [kw] Loss Redu ction No D G 202.6 8 Ty pe I D G B us
06 18 18 0.12 9976 111.2 2 45.12 4% Si ze 50 % 0.91 309 0.95 83 Ty pe II B us
06 18 18 0.05 3135
101.3 5
50.04 % Si 50 0.91 0.93
D G
ze % 309 3
Ty pe III D G B us
06 18 18 0.22 386 66.27 1 67.30 2% Si ze 50 % 0.91 309 0.96 139
3.
CONCLUSIONThis paper presents the analytical method of optimally allocating the distributed generators using the proposed logarithmic voltage deviation (LVDI) in the IEEE 33 bus radial distribution network. This method utilizes different types of DG‟s adaptively for finding the best location of the DG‟s. Results show that the location and size are the important factors in reducing the losses and improving the voltage profile of the network. The comparison among different types of DG in the IEEE 33 bus system showed that DG capable of delivering both active and reactive power gives better system performance. This can be a good guiding step for the operation of type 3 DG‟s.
REFERENCES
1. Mohit Mittal, Rajat Kamboj and Shivani Sehgal, “ Analytical approaches for Optimal Placement and sizing of Distributed generation in Power System”, in IOSR Journal of Electrical and Electronics Engineering (IOSRJEEE) ISSN : 2278-1676 Volume 1, Issue 1 (May-June 2012), PP 20-30
2. T. Ackermann, G. Anderson, and L. Söder., “Distributed generation: a definition,” Electric Power Systems Research, vol.57, pp.195–204, 2001.
3. Rau N.S., Wan Y., “Optimal location of resources in distributed planning,” IEEE Trans. Power Syst., Vol.9, No.4, pp. 2014–2020, 1994. 4. Kim JO, Nam SW, Park SK, Singh C.,
“Dispersed generation planning using improved Hereford ranch algorithm,” Electrical Power System Research, Vol.47, No.11,1998.
1560 6. Willis, H.L., “Analytical methods and rules of
thumb for modeling DGdistribution interaction,” Proc. IEEE Power Engineering Society Summer Meeting, Seattle, USA, pp. 1643–1644, 16–20 July 2000.
7. Nara, K., Hayashi, Y., Ikeda, K. et al., “Application of tabu search to optimal placement of distributed generators,” Proc. IEEE Power Engineering Society Winter Meeting, Columbus, USA, pp. 918–923, 28 January–1 February 2001
8. Kim K.-H., Lee Y.-J., Rhee S.-B., Lee S.-K., You S.-K., “Dispersed generator placement using fuzzy-GA in distribution systems,” Proc.
IEEE Power Engineering Society Summer Meeting, Chicago, IL, USA, Vol. 3, pp. 1148– 1153,2002.
9. Teng, J.-H., Luor, T.-S., and Liu, Y.-H., “Strategic distributed generator placements for service reliability improvement,” Proc. IEEE Power Engineering Society Summer Meeting, Chicago, USA, pp. 719–724, 21– 25 July 2002. 10. Wang C, Nehrir M Hashem, “Analytical