I
nternationalJ
ournal ofI
nnovativeR
esearch inS
cience,E
ngineering andT
echnologyVolume 3, Special Issue 3, March 2014
2014 International Conference on Innovations in Engineering and Technology (ICIET’14)
On 21st & 22nd March Organized by
K.L.N. College of Engineering, Madurai, Tamil Nadu, India
ABSTRACT - Nowadays power demand is the major problem in the electricity market. Distributed Generation (DG) is becoming more important in the power system because of its high efficiency. This paper is concerned with the Differential Evolution Algorithm for the optimal sizing of Distributed Generation. The objective is minimization of DG cost and maximization of the loadability value. The improvement of voltage profile is also considered. IEEE-14 bus system and 34 bus Radial Distribution System are considered to test the effectiveness of the DE for optimal sizing of DG with maximizing the loadability and minimizing the DG cost.
KEYWORDS:- Distributed Generation (DG), Economic Dispatch (ED), Optimal Power Flow (OPF), Differential Evolution (DE), Maximum Loadability Limit.
I.INTRODUCTION
Distributed Generation is a small power generating unit that is usually connected to the distribution system. It is also known as Embedded Generation (EG) or Dispersed Generation (DG). Distributed Generation (DG) which consists of distributed resources, can be defined as electric Power generation within distribution networks or on the consumer side of the network [1]. DG impacts on distribution system depends on several factors such as DG location, capacity of DG and the mode of DG operation with network [2]. DG is an emerging approach for providing electric power to the power system.
The penetration and viability of DG at a particular location is influenced by technical as well as economic factors. The technical merits of DG implementation include voltage support, energy loss reduction, and release of system capacity and improve utility system reliability[3]. Two methodologies for optimal placement of distributed generation (DG) in an optimal power flow based wholesale electricity market were presented in [3]. The minimization of cost and loss with the maximum potential benefit was suggested in [4]. The formulation of three phase optimal power flow with the control variables (actual active load demand and reactive power outputs of micro generators) was presented in [5].The analytical methods to determine the optimal location of DG in radial distribution networks for loss minimization in the power system is proposed in [6]. Particle Swarm Optimization algorithm (PSO) for the optimal placement and sizing of DG units in order to reduce network congestion was presented in [7] .One of the most powerful evolutionary algorithm is Differential Evolution (DE) because of its excellent convergence characteristics and a few control parameters. The computational algorithm of DE is simple to understand and implement. Only a few parameters are required to be set by the users [9-11].
The maximum loadability limit is the margin between the operating point of the system and the maximum loading point that can be formulated as an optimization problem.
This paper concentrates the voltage profile improvement by placing the DG with the constraint of maximizing the loadability and minimizing the DG cost by using Differential Evolution Algorithm.
Optimal Sizing Of Distributed Generation
For Voltage Profile Improvement
Considering Maximum Loadability Limit
Dr.K.Gnanambal
#1, S.Suriya*
21Professor, Department of Electrical and Electronics Engineering, K.L.N College of Engineering, Sivagangai,
India.
2P.G.Scholar (M.E.Power System Engineering, Department of Electrical and Electronics Engineering, K.L.N
Copyright to IJIRSET www.ijirset.com 305
II. OVERVIEW OF THE PROPOSED IDEA
Fig.1. represents the overview of the paper. Optimal location of DG is determined by using the Differential Evolution algorithm. After the location of DG by changing the DG penetration level the minimization of DG cost and the maximization of the loadability is done by using the DE.
III.PROBLEM FORMULATION
Objective Function
The objective function states that the minimization of the DG cost with the maximization of the loadability. The minimization of the DG cost is expressed in (1):
Min
NL
i
DGi
P
C
K
1
1
*
(
)
(1)The maximization of the loadability is expressed in the (2):
Max
*
(
)
1
2 Di
NL
i
P
K
(2)where
NL=Total Number of Loads
DG DG DG
DG
b
P
c
P
2DG DG
)
a
C(P
DG DG
DG
b
c
a
,
,
are the cost coefficients of DG.K1 and K2 are the Penalty Factors.
Subjected to the Constraints
Change in power
Pi=
)
cos(
1
i j ij ij
N
j j
i
V
Y
V
The change in real power is obtained by the total real power generation minus total load real power demand minus specified ith bus real power.
ΔP=Pgi - Pdi -Pi (3) Where Pdi = Pdo + λ
Pgi = Pgo + Pdg
Qi= ( )
1
j j ij ij
j N
j
i V Y Sin
V
The change in reactive power is obtained by the total reactive power generation minus total load reactive power demand minus specified ith bus reactive power. ΔQ=Qgi - Qdi + Qi (4)
Inequality Constraints
Real power generation limits
The real power at generator bus is maintained with its acceptable limit is expressed as
PGimin ≤ PGi ≤ PGimax (5) where
i =1, 2… NG
PGimax = maximum real power level at bus i PGimin = minimum real power level at bus i NG = Number of Generators
Reactive power generation limits:
The reactive power at generator bus is maintained with its acceptable limit is expressed as
QGi min ≤ Q
Gi ≤ QGi max
(6) where
Start
Read bus data and line data for IEEE 14 bus system, 34 bus radial distribution system and Cost
coefficients for Distributed Generation
Load Flow Analysis for the proposed system using NR method
Changing the penetration level of DG with the constraints of maximizing the loadability using DE
Run load flow analysis using NR method
If Condition
is Satisfied?
Output Improvement of Voltage profile, line loss reduction, cost reduction etc.
Yes No
i =1,2… NG
QGimax = maximum reactive power level at bus i QGi
min
= minimum reactive power level at bus i NG = Number of Generators
Line flow limit
The line flow limit specifies the maximum allowable complex power transfer in the transmission line.
Sij ≤ Sijmax Sji ≤ Sjimax where
Sij= the complex power transfer between the bus i and j. Sji= the complex power transfer between the bus j and i. Sijmax= the maximum complex power transfer capacity of line i to j.
Sji max
= Maximum complex power transfer capacity of line j to i.
Bus voltage limit:
Voltage level at a load bus is maintained with its acceptable limit is expressed as:
Vi min ≤ Vi ≤ Vi max (7)
where i = 1,2,….NL
Vimax = maximum voltage level of bus i. Vimin = minimum voltage level of bus i.
IV. OVERVIEW OF DIFFERENTIAL EVOLUTION
As a relatively new member of EAs, DE is less known outside meta heuristic optimization area. Similar to other EAs, DE relies likewise on the initial population generation, mutation, recombination and selection to probe search space through iterative progress until the terminate criteria are met. [12]
Main operators for DE: The performance of DE is mainly dependent on three operators, mutation, recombination and selection. Detailed discussion of them is presented accordingly in the sequel.
Mutation: The function of mutation in DE is to maintain the diversity of population as well as provide necessary information to steer the optimization. A typical DE mutation formulation is
x
i'G1
x
iG
f
1(
x
Gr1
x
rG2)
(8) Where G represents the Gth generation, r1 ≠ r2 ≠ I, andr1, r2 are randomly selected integers within the population size NP , r1, r2 € {1,2,….,N P }, If G
r
x
2toreplace
x
iG, then)
.(
3 2 21
' G
r G r G
i G
i
x
f
x
x
x
(9) Clearly (5) is a linear combination of two vectors and theresulting mutation becomes an arithmetic crossover process.
Recombination: Recombination or crossover is the main operator for GAs but only a complementary process for DE. The basic recombination process is a discrete recombination, which employs a constant C R € [0, 1] to determinate if the newly generation individual is
to be recombined. Alternatively, the arithmetic crossover formula of (5) can be used to achieve the rotational invariance which is otherwise difficult to be achieved with the discrete recombination. The resulting expression of the mutation and crossover processes are given in (10) as a combination of (8) & (9)
)
.(
)
.(
2 1 22 1
' G
r G r G
i G r G
i G
i
x
f
x
x
F
x
x
x
(10)Where the randomly generated integers r1 ≠ r2 ≠ r3 ≠ i, F is the mutation constant and
f
2controls the crossover constant.
f
2 € [0, 1] and remainsconstant throughout the evolution process .The values of F and
f
2 are commonly determined on the case to case basis.Selection: DE adopts a very simple selection
operator. A newly generated child individual
x
i'G1 iscompared with parent
x
iG and replaces it if)
(
)
(
1 Gi iG
i
f
x
x
f
. It ensures that the cost of the individual and the overall population will not increase throughout the search process.V.RESULTS AND DISCUSSION
The proposed DE algorithm is applied to determine the optimal location and sizing of DG with the constraint of maximizing the loadability have been conducted under MATLAB 12 environment.
The test system used to demonstrate the paper work is, IEEE 14 bus system.
34 bus Radial Distribution System.
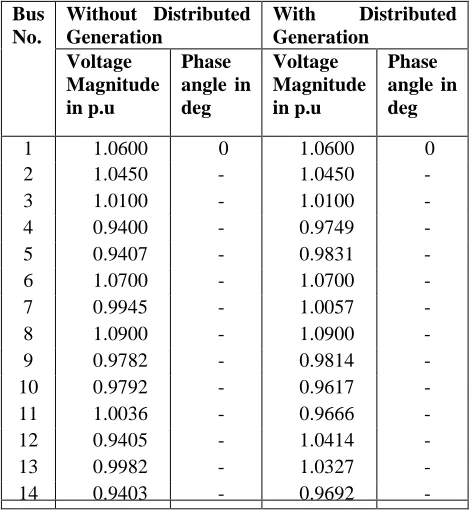
A.IEEE 14 BUS SYSTEM
The standard IEEE-14 bus system consists of 6 generator bus, 9 load buses and 20 transmission lines. The generator buses are 1, 2, 3, 6 and 8 with the slack bus connected to node 1. The other nodes are connected to all other nodes. The optimal location and sizing of DG will takes place at all load buses.
The voltage profile improvement for the IEEE 14 bus system with DG and without DG using
Copyright to IJIRSET www.ijirset.com 307
Table 1. Comparison of Voltage Profile without and with DG using DE
Table 2.Optimal sizing of DG
Bus No.
Optimal size in
MW
Cost in $/MWh
Maximum Loadability in p.u
5 5.575 83.6871 2.24226
Fig.2. Convergence Characteristics for the IEEE 14 bus System
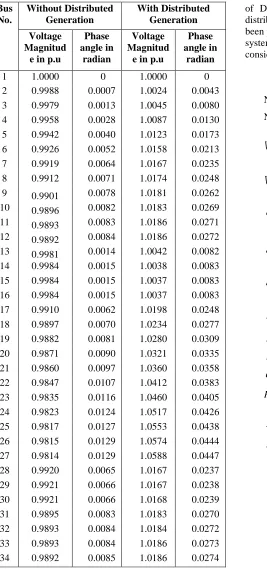
B.34 bus Radial Distribution System
The second test case for the proposed method is a 34 bus radial distribution system.This system consists of main feeder and four laterals. The line and load data are taken from reference.
The voltage profile improvement for the 34 bus system with DG and without DG by using Differential Evolution (DE) is discussed in Table 3.
Optimal Sizing of DG will takes place on minimum voltage buses and determine the best optimal location and DG size with the constraint of maximum loadability and minimizing DG Cost that will be discussed in Table 4.
Fig.3. Convergence Characteristics for 34 bus Radial Distribution System.
Table 3. Comparison of Voltage Profile without and with DG using DE
Bus No.
Without Distributed Generation
With Distributed Generation
Voltage Magnitude in p.u
Phase angle in deg
Voltage Magnitude in p.u
Phase angle in deg
1 1.0600 0 1.0600 0 2 1.0450
-0.1879
1.0450 -0.1196 3 1.0100
-0.3219
1.0100 -0.2092 4 0.9400
-0.4366
0.9749 -0.2914 5 0.9407
-0.4082
0.9831 -0.2683 6 1.0700
-0.8345
1.0700 -0.5558 7 0.9945
-0.6501
1.0057 -0.4818 8 1.0900
-0.6501
1.0900 -0.4818 9 0.9782
-0.7348
0.9814 -0.5586 10 0.9792
-0.7734
0.9617 -0.6207 11 1.0036
-0.8406
0.9666 -0.6747 12 0.9405
-0.9955
1.0414 -0.5846 13 0.9982
-0.9106
1.0327 -0.5819 14 0.9403
-0.8789
0.9692 -0.6182
Bus No.
Optimal size in
MW
Cost in $/MWh
Maximum Loadability in
p.u
Table 4. Optimal sizing of DG VI CONCLUSION
This paper presented a method for optimal sizing of DG to improve maximum allowable load in the distribution system. Differential Evolution algorithm has been proposed for the optimal sizing of DG. IEEE 14 bus system and 34 bus radial distribution system are considered to test the effectiveness of DE.
List of Symbols Bus
No.
Without Distributed Generation
With Distributed Generation
Voltage Magnitud
e in p.u
Phase angle in
radian
Voltage Magnitud
e in p.u
Phase angle in
radian
1 1.0000 0 1.0000 0 2 0.9988 0.0007 1.0024 0.0043
3 0.9979 0.0013 1.0045 0.0080
4 0.9958 0.0028 1.0087 0.0130
5 0.9942 0.0040 1.0123 0.0173 6 0.9926 0.0052 1.0158 0.0213
7 0.9919 0.0064 1.0167 0.0235
8 0.9912 0.0071 1.0174 0.0248
9 0.9901 0.0078 1.0181 0.0262
10 0.9896 0.0082 1.0183 0.0269
11 0.9893 0.0083 1.0186 0.0271
12 0.9892 0.0084 1.0186 0.0272
13 0.9981 0.0014 1.0042 0.0082
14 0.9984 0.0015 1.0038 0.0083
15 0.9984 0.0015 1.0037 0.0083 16 0.9984 0.0015 1.0037 0.0083
17 0.9910 0.0062 1.0198 0.0248
18 0.9897 0.0070 1.0234 0.0277
19 0.9882 0.0081 1.0280 0.0309
20 0.9871 0.0090 1.0321 0.0335
21 0.9860 0.0097 1.0360 0.0358
22 0.9847 0.0107 1.0412 0.0383
23 0.9835 0.0116 1.0460 0.0405
24 0.9823 0.0124 1.0517 0.0426
25 0.9817 0.0127 1.0553 0.0438 26 0.9815 0.0129 1.0574 0.0444
27 0.9814 0.0129 1.0588 0.0447
28 0.9920 0.0065 1.0167 0.0237
29 0.9921 0.0066 1.0167 0.0238
30 0.9921 0.0066 1.0168 0.0239
31 0.9895 0.0083 1.0183 0.0270
32 0.9893 0.0084 1.0184 0.0272
33 0.9893 0.0084 1.0186 0.0273
34 0.9892 0.0085 1.0186 0.0274
NG : Number of generators
NL : Number of Loads
max i
V
: Maximum voltage level at node imin i
V
: Minimum voltage level at node iij
S
: Complex power transfer between the bus i and j.max
ij
S
: Maximum complex power transfer capacity of the line i-jmin ij
S
: Minimum complex powertransfer capacity of the line i-j
Gi
P
: Active power generated through generator i.Di
P
: Demand power of customerDGi
P
: Distributed Generation powerDG DG
DG
b
c
a
,,
: Cost of coefficients forDistributed Generation Pi : The calculated real power for
the ith bus.
max
Gi
P
: Maximum generation at generator i. real powerm in Gi
P
: Minimum real powerCopyright to IJIRSET www.ijirset.com 309
REFERENCE
[1] J.A. Pecas Lopes, N.Hatziagyriou, J.Mutale, “Integrating distributed generation into electric power systems: A review of drivers, challenges and opportunities”, Electric Power System Research 77 (2007), pp.1189-1203.
[2] K.Balamurugan, Dipti Srinivasan, Thomas Reindl, “Impact of Distributed Generation on Power Distribution Systems”, Energy Procedia 25(2012) 93-100.
[3] Durga Gautam and Nadarajah Mithulananthan, “Optimal DG placement in deregulated electricity market”, Electric Power Systems Research 77 (2007) , pp. 1627-1636.
[4] Sudipta Ghosh , S.P.Ghoshal, and Saradindu Ghosh , “Optimal sizing and placement of distributed generation in a network system”, Electrical Power and Energy Systems 32(2010) 849-856.
[5] Sergio Bruno, Silvia Lamonaca, Giuseppe Rotondo, Ugo Stecchi, and Massimo La Scala , “Unbalanced Three-Phase Optimal Power Flow for Smart Grids”, IEEE Transactions on Industrial Electronics, vol.58, No.10, October 2011.
[6] N.Acharya, “An Analytical Approach for DG Allocation in Primary Distribution Network”, Elsevier Journal of Electrical Power and Energy Systems, vol.28, pp.669-678, 2006.
[7] Seon-Ju Ahn, Soon-Ryul Nam, Joon-Ho Choi and Seung-II Moon, “Power Scheduling of Distributed Generators for Economic and Stable Operation of a Microgrid”, IEEE Transactions on Smart Grid, vol. 4, No.1, March 2013.
[8] Monica Alonso, Hortensia Amaris and Carlos Alvarez-Ortega, “Integration of renewable energy sources in smart grid by means of evolutionary optimization algorithms”, Expert Systems with Applications 39(2012), pp. 5513-5522.
[9] Chung-Fu Chang, Ji-Jen Wong, Ji-Pyng Chiou and Ching-Tzong Su, “Robulst searching hybrid differential evolution method for optimal reactive power planning in large scale distribution systems”, Electric Power Systems Research, Vol 77, pp. 430-437, April 2007.
[10] Cai, H.R. Chung, C.Y.Wong, K.P. “Application of Differential Evolution Algorithm for Transient Stability Constrained Optimal Power Flow”, IEEE Transactions on Power System Vol 23, pp 719-728, May 2008.
[11] Xiaohui Yuan, Anjun Su, Hao Nie, Yanbin Yuan and Liang Wang, “Application of enhanced discrete differential evolution approach to unit commitment problem”, Energy Conversion and Management, Vol 50, Issue 9, pp 2449-2456, Sept 2009. [12] Guang Ya Yang, Zhao Yang Dong and Kit Po Wong, “A
Modified Differential Evolution Algorithm with Fitness sharing for Power System Planning”, IEEE Trans. on Power Systems,