University of South Carolina
Scholar Commons
Theses and Dissertations
1-1-2013
Trophic Response to Polycyclic Aromatic
Hydrocarbons and Copper In Tidal Flats of North
Inlet, South Carolina
Leslie Lynn Muggelberg
University of South Carolina
Follow this and additional works at:https://scholarcommons.sc.edu/etd
Part of theLife Sciences Commons,Medicine and Health Sciences Commons, and thePhysical Sciences and Mathematics Commons
This Open Access Thesis is brought to you by Scholar Commons. It has been accepted for inclusion in Theses and Dissertations by an authorized administrator of Scholar Commons. For more information, please [email protected].
Recommended Citation
T
ROPHIC RESPONSE TO POLYCYCLIC AROMATIC HYDROCARBONS AND COPPEREXPOSURE IN TIDAL FLATS OF NORTH INLET
,
S
OUTHC
AROLINAby
Leslie L. Muggelberg Bachelor of Science
Saginaw Valley State University, 2010
Submitted in Partial Fulfillment of the Requirements For the Degree of Master of Science in
Biological Sciences College of Arts and Sciences University of South Carolina
2013 Accepted by:
James Pinckney, Major Professor Blaine Griffen, Committee Member Michele Harmon, Committee Member
ii
iii
D
EDICATIONThis work is dedicated to my parents, Brad and Lorna Muggelberg, without the support of whom I would not be where I am today. They have been extraordinary role models and inspire me every day. Their encouraging words have helped me though many trying times and their praise of my accomplishments have made all sacrifices worthwhile.
iv
A
CKNOWLEDGEMENTSI would like to thank my advisor, Dr. Jay Pinckney, for all of his guidance throughout the past two years. I have learned so much and grown as a scientist under his supervision, for that I cannot even begin to express all of my gratitude. With him helping me stay focused on my goals I was able to complete my “ambitious” project on the proposed time-scale, a feat I take pride in. I would also like to thank my committee members, Dr. Blaine Griffen and Dr. Michele Harmon for all of their advice and support devising and executing my experiments.
I would also like to acknowledge all of the people that helped me while
conducting my research at the Belle W. Baruch Institute for Marine and Coastal Science. Dennis Allen and Paul Kenny worked with me to design an experimental set-up to ensure containment of all contaminants used and advocated approval of my project by the Belle W. Baruch Foundation. Without their support I would not have had the wonderful experience of spending my summer at the field lab, enjoying the beauty of the research reserve. Stephen Forehand was a tremendous help to me throughout the entire execution of my project, aiding with electrical issues, construction of mesocosm components and other set-up details.
v
vi
A
BSTRACTThe trophic link between benthic microalgae (BMA) and fiddler crabs is critical for the ecosystem functioning of estuaries and alterations in this linkage by anthropogenic activities could have cascading impacts on food webs and biogeochemical cycling in these sensitive habitats. Singular and interactive effects of two common pollutants in aquatic ecosystems, polycyclic aromatic hydrocarbons (PAHs) and copper (Cu), were investigated by exposing field collected sediment communities to the contaminants and measuring changes in BMA biomass and community composition in a bioassay design. The consequential impacts on the food web were then explored by examining the effects of PAHs and copper on food preference and feeding rates of sand fiddler crabs (Uca
pugilator). No significant overall change in BMA biomass (as chlorophyll a) after 10
days was observed between treatments. However, the trends in the algal biomass
responses throughout the experiment, as well as the significantly greater change in BMA biomass between 4 and 10 days after exposure in the Cu treatment compared to the controls, suggest a complex sediment community response. The abundance of diatoms relative to cyanobacteria (the fucoxanthin to zeaxanthin ratio) increased significantly in Cu and Mix (PAHs + Cu) treatments compared to controls, possibly due to
vii
alternative food choice was provided. Because fiddler crabs are important bioturbators, a reduction in feeding, (and therefore sediment processing) in contaminated areas could have significant impacts on the chemistry of surficial sediments which subsequently influences sediment communities and marsh grass growth. Reduced feeding would likely also reduce resources for crab growth and reproduction, effect crab health, and eventually could result in a reduction in crab abundance. Sublethal exposure of intertidal
viii
T
ABLE OFC
ONTENTSDEDICATION ... iii
ACKNOWLEDGEMENTS ... iv
ABSTRACT ... vi
LISTOFTABLES ... ix
LISTOFFIGURES ...x
INTRODUCTION ...1
CHAPTER 1: RESPONSE OF BENTHIC MICROALGAE TO POLYCYCLIC AROMATIC HYDROCARBON AND/OR COPPER EXPOSURE ...5
1.1 INTRDUCTION ...5
1.2 METHODS ...9
1.3 RESULTS ...21
1.4 DISCUSSION ...32
CHAPTER2:FIDDLERCRABFEEDINGRESPONSESTOSEDIMENTS CONTAMINATEDWITHPOLYCYCLICAROMATICHYDROCARBONS AND/ORCOPPER ...41
2.1INTRODUCTION...41
2.2METHODS ...46
2.3 RESULTS ...64
2.4 DISCUSSION ...68
CONCLUSION ...79
ix
L
IST OFT
ABLESx
L
IST OFF
IGURESFigure 1.1 Location of research area in Georgetown, SC ...10
Figure 1.2 Collection site photo ...11
Figure 1.3 Diagram of mesocosm set-up ...13
Figure 1.4 Relationship between chl a concentration measured by HPLC and fluorometric methods ...22
Figure 1.5 Change in chl a concentration within dosed sediments from Day 0 to Day 10 ...24
Figure 1.6 Change in chl a concentration within dosed sediments over time ...25
Figure 1.7 Change in chl a concentration within dosed sediments from Day 0 to Day 4 ...26
Figure 1.8 Change in chl a concentration within dosed sediments from Day 4 to Day 10 ...27
Figure 1.9 Change in fucoxanthin concentration within dosed sediment ...28
Figure 1.10 Change in zeaxanthin concentration within dosed sediment ...30
Figure 1.11 Change in Fuco:Zea Ratio within dosed sediments ...31
Figure 2.1 Location of research area in Georgetown, SC ...48
Figure 2.2 Collection site photo ...49
Figure 2.3 Diagram of mesocosm set-up ...52
Figure 2.4 Diagram of food choice experiment set-up ...54
Figure 2.5 Crab food choice experiment photo ...56
Figure 2.6 Crab feeding rate experiment photo ...63
xi
1
INTRODUCTION
In the past several decades, the human population density of coastal South Carolina, and many other coastal areas, has increased dramatically and this trend is expected to continue (Crossett et al., 2004; Wilson and Fischetti, 2010). Between 1980 and 2003, total U.S. coastal population increased by 28% (or 33 million people) (Crossett et al., 2004) andwith this increase in population inevitably comes a great deal of urban expansion, residential development and impervious land cover. Such development poses great threats to estuarine and coastal ecosystems which provide habitats and nurseries for commercially valuable fish and shellfish, as well as many ecologically important species (Courrat et al., 2009). The close proximity of estuarine tidal creeks to urban development and human activities results in both chronic and acute exposure to runoff containing harmful pollutants such as pesticides, heavy metals and polycyclic aromatic
2
PAHs and copper are both routinely introduced into estuarine environments by a variety of sources and higher concentrations of these pollutants have been recorded in tidal creeks associated with urban areas compared to those with less developed
watersheds (Sanger et al., 1999a,b; Van Dolah et al., 2008; Garner et al., 2009). PAHs are a group of organic, hydrophobic compounds characterized by fused aromatic rings. They are components of fossil fuels and are also released upon incomplete combustion of such fuels. PAHs are emitted as a mixture of individual compounds (Zhu et al., 2004;
Tobiszewski and Namieśnik. 2012) and estuarine pollution sources for these
contaminants can include urban runoff, direct fuel spills or leaks and air deposition (Kucklick et al. 1997; Ngabe et al., 2000; Kose et al., 2008; Nikolaou et al., 2009). Due to their hydrophobic nature, PAHs readily adsorb to inorganic and organic particles and so can accumulate within the sediments of estuaries (Nikolaou et al., 2009; Tobiszewski and Namieśnik. 2012). Copper, a heavy metal, also accumulates in the sediments of
estuarine habitats upon introduction by anthropogenic sources due to its adsorption to organic matter and other particles (Helland and Bakke, 2002). The primary source of copper contamination in many marine habitats is boating activity, as many anti-fouling paints used on boats and docks are copper based. Other sources such as sewage
3
anthropogenic activities. For this reason, the potential ecological impacts of these contaminants on estuarine habitats merit experimental study.
Benthic microalgae (BMA) form the foundation of many estuarine food webs (MacIntyre et al., 1996; Miller et al., 1996; Sullivan and Currin, 2000; Consalvey et al., 2004), therefore, changes in this food source due to toxic contaminant effects could have dramatic impacts on higher trophic levels. Fiddler crabs consume organic matter in sediments, including BMA (Miller, 1961; Crane, 1975; Meziane et al., 2002), and so may be directly affected by changes in quantity or quality BMA. These crabs play very
important roles in salt marsh ecosystems as a food source for fish, birds and other crustaceans (Crane, 1975; Montague, 1980; Grimes et al., 1989) and also serve as important bioturbators with their burrowing and feeding activities (Katz, 1980;
Montague, 1980; Hoffman et al., 1984; Bertness, 1985; Grimes et al., 1989; Meziane et al., 2002; Smith et al., 2009; Sayão-Aguiar et al., 2012). Because BMA and fiddler crabs are a trophic link critical for the ecosystem functioning of salt marshes, alterations in this linkage by anthropogenic activities could have significant trophic and energetics impacts on estuarine food webs.
The first objective of this study was to examine the potential effects of PAHs and
copper (singly and in combination) on the biomass and community composition of BMA.
A second objective of this study was to investigate effects of PAHs and copper (singly and
in combination) on the food preference and feeding rates of fiddler crabs through
exposure to contaminated sediments and food source (BMA).
4
5
CHAPTER
1:
RESPONSE
OF
BENTHIC
MICROALGAE
TO
POLYCYCLIC
AROMATIC
HYDROCARBON
AND/OR
COPPER
EXPOSURE
1.1INTRODUCTION
As coastal populations grow (Crossett et al., 2004; Wilson and Fischetti, 2010) and urbanization of coastal areas increases, the introduction of harmful pollutants into the environment will likely also increase. Runoff due to increased impervious ground cover associated with urbanization carries a variety of pollutants, including pesticides,
polycyclic aromatic hydrocarbons (PAHs) and heavy metals, to nearby water systems, particularly tidal creeks due to their close proximity to developed areas (Kucklick eta al., 1997; Sanger et al., 1999 a, b; Holland et al., 2004; Van Dolah et al., 2008; Garner et al., 2009). The contamination of estuarine environments is cause for great concern as these habitats are essential for the survival of a diversity of organisms, serving as nurseries and feeding grounds for many ecologically and economically important fish, crustacean and bird species (Courrat et al., 2009).
6
are directly fed upon by amphipods, gastropods, polychaetes, fish, crustaceans and many meiofauna species (Miller et al., 1996; Sullivan and Currin, 2000). For that reason, effects of pollutants on BMA, such as reduced productivity or contamination of this food source, may have cascading effects on the food web. BMA also function in sediment stabilization, the degree of which is dependent on BMA density and mucilage secretion, thus a significant reduction in BMA biomass resulting from pollutant exposure could potentially affect sediment dynamics as well (Holland et al. 1974; de Brouwer et al., 2005). The various roles that BMA play in estuarine habitats make them key links
between biological compartments as well as biogeochemical cycles, therefore, the effects of anthropogenic influences on these microorganisms merit investigation.
7
particles (Helland and Bakke, 2002; Nikolaou et al., 2009; Tobiszewski and Namieśnik.
2012) and so pose a threat to benthic organisms.
Pollutant effects on BMA can vary greatly. Conflicting results with regards to the effect of PAHs on BMA biomass have been observed in multiple studies and seem to depend on contaminant concentration, medium contaminated (water vs. sediments) and duration of exposure (Carmen et al., 1997; Piehler et al., 2003; Wang and Zheng, 2008; Wang et al., 2008; Petersen et al., 2009). While some experiments have shown indirect stimulation of BMA growth after the introduction of PAHs (Carmen et al., 1997; Petersen et al., 2009), others have demonstrated direct toxic effects of PAHs on phytoplankton and BMA, primarily involving adverse effects on cell membranes and induction of oxidative stress (Piehler et al., 2003; Wang and Zheng, 2008; Wang et al., 2008). Likewise, heavy metals (especially copper) are also known to induce oxidative stress in algae (Pinto et al., 2003; Yu et al., 2007; Sabatini et al., 2009), and copper may reduce photosynthesis as well as inhibit growth at varying concentrations (Cid et al., 1995; Hadjoudja et al., 2009; Levy et al. 2009). Aside from effects individual contaminants can have on BMA,
interaction between multiple contaminants may induce complex biological responses. Synergistic toxic effects on algae and higher plants have been observed upon their exposure to mixtures of copper and organic pollutants (such as PAHs), but such
8
In addition to the potential effects on overall BMA biomass, variation in group (e.g., diatoms vs. cyanobacteria) and species- specific responses to these stressors would promote alterations in community composition (structure) and trophic transfer (function). Cyanobacteria seem to be more sensitive to various pollutants than other algal groups. Exposure to PAHs has greater negative effects, evidenced by greater percent reduction in cell counts, on cyanobacteria compared to diatoms (Piehler et al., 2003). Copper sulfate (a commonly used algaecide) is often added to lakes and ponds to control algal blooms and at levels that result in rapid, dramatic declines in cyanobacteria biomass,
chlorophytes, diatoms and chrysophytes are able to survive, replacing cyanobacteria as dominant algal groups after copper sulfate treatment (Witaker et al., 1978). At a finer scale, the inhibition of some enzymes occurs at lower copper concentration in
cyanobacteria than in chlorophytes, indicating differences between groups with respect to responses to copper exposure (Hadjoudja et al., 2009). The greater sensitivity of
cyanobacteria to chemical pollutants would suggest possible BMA community shifts after contaminant introduction, potentially altering benthic dynamics.
The current study investigated the effects of PAHs and copper, singly and in combination, on BMA biomass and BMA community composition. Based on the numerous reported negative impacts of these two pollutants on BMA, it was
9
evidenced by significant increases in the fucoxanthin to zeaxanthin (biomarker pigments of diatoms and cyanobacteria, respectively) ratio. Due to the roles BMA play in salt marsh ecosystems, results from this study could have implications for higher trophic levels as well as biogeochemical processes.
1.2 METHODS
Study Site
North Inlet (33.3º N, 79.1º W) is a bar-built estuary within the boundaries of the North Inlet – Winyah Bay National Estuarine Research Reserve (NI – WB NERR) in Georgetown, SC. This estuary contains extensive tidal creeks and experiences regular semi-diurnal tides, with a mean tidal amplitude of 1.4 meters. Major contributors to the primary production of North Inlet include Spartina alterniflora (the dominant marsh grass in North Inlet), as well as BMA. North Inlet is considered a relatively pristine with more than 90% of its watershed in a naturally forested state.
Sediment Collection & Set-up
10
Figure 1.1 Location of research area in Georgetown, SC.
11
12
the bank to reduce spatial variability in sediment grain size and organic
content/composition. Four experimental replicates were carried out; Replicate 1 and Replicate 2 were performed June 23 - July 3, 2012, Replicate 3 and Replicate 4 were performed July 13 – 23, 2012.
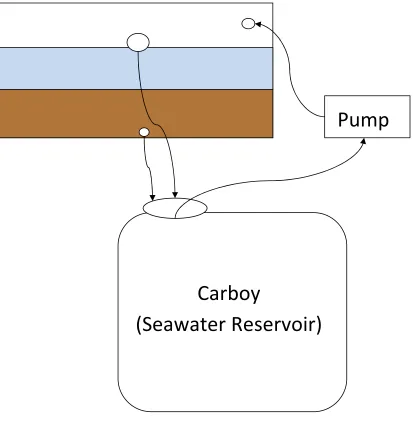
Sediment bricks were transferred to the mesocosm tanks and immediately transported to the experimental study site behind the main research facility at the Belle W. Baruch Institute for Marine and Coastal Science (Figure 1.1). The site was exposed to full sun from 10:00 am - 3:30 pm and experienced ambient temperatures. A closed-loop water system design composed of a seawater reservoir, an Aqua Lifter AW-20 aquarium vacuum pump and a mesocosm tank was utilized for the set-up of this study. Components of each mesocosm were connected by plastic tubing, and pumps were controlled by timers to simulate semi-diurnal tides (Refer to Figure 1.3 for diagram of mesocosm set-up).
Dosing of Mesocosms
Two days after sediment brick collection and mesocosm set-up, surface sediments (0 – 2 cm) were collected from the original collection site during low tide using a flat-edged shovel. The sediments were immediately transported back to the research facility where they were sieved through 2 mm mesh and then homogenized for 2 minutes using a steel mixing paddle attached to a drill.
13
Pump
Carboy
(Seawater Reservoir)
Figure 1.3 Diagram of mesocosm set-up. The large rectangle represents the mesocosm
14
components based on the designated treatment for that mesocosm (See Table 1.1 for dosing details). For those treated with contaminants, dosing consisted of dissolving the contaminants and adding the solution(s) to the sediments, yielding concentrations within the range observed in urbanized coastal areas of South Carolina (4.77 – 37.03 µg total PAHs/g dry sediment and 58.4 – 93.7 µg Cu/g dry sediment) (Sanger et al. 1999 a, b). The target concentrations of dosed sediments were 10 µg total PAHs/g dry sediment (ratio of individual PAH compounds used in the dosing mixture based on Sanger et al., 1999b) and 70 µg Cu/g dry sediment (for the appropriate treatments) (Table 1.1). It was assumed that contaminant concentrations of field collected sediments from the relatively pristine site of North Inlet were almost negligible (0.07 – 0.12 µg total PAHs/g dry sediment and 2.2 – 11.4 µg Cu/g dry sediment (Sanger et al. 1999 a, b)),compared to the target concentrations. All contaminants were purchased from Fisher Scientific (pyrene, 98+%, Cat No.: AC180830250; phenanthrene, 98+%, Cat No.: AC130090050;
anthracene, 99%, Cat No.: AC104861000; copper (II) sulfate, Cat No.: AA1417836). The Acetone treatment was used as a control for the PAHs and Mix treatments (as acetone was used for the solvent of PAHs) and the Water treatment was used as an overall control (i.e. no added contaminants). Fluid volume added was kept constant through all
treatments (Table 1.1).
1
5
Table 1.1 Sediment dosing details.
Treatment Contaminant Added Solvent Used Fluid Volumes Added Concentrations of Pollutants Added
Water None N/A 40 ml deionized water N/A
Acetone None N/A 20 ml 100% acetone
20 ml deionized water
N/A
PAHs Mixture of PAHs
(included pyrene, phenanthrene and anthracene)
100% acetone 20 ml 100% acetone
20 ml deionized water
10 µg total PAHs/g dry sed
(composed of 6 µg pyrene/g dry sed; 3 µg phenanthrene/g dry sed;
1 µg anthracene/g dry sed)
Cu Copper (as 5 H2O ·
CuSO4)
Deionized water 40 ml deionized water 70 µg Cu/g dry sed
Mix Mixture of PAHs
(included pyrene, phenanthrene and anthracene)
Copper (as 5 H2O ·
CuSO4)
100% acetone (for PAHs)
Deionized water
(for 5 H2O ·
CuSO4)
20 ml 100% acetone
20 ml deionized water
10 µg total PAHs/g dry sed
(composed of 6 µg pyrene/g dry sed; 3 µg phenanthrene/g dry sed;
1 µg anthracene/g dry sed)
16
were divided among glass jars which were then covered in foil and stored in a refrigerator until used. This was done to prevent photodegradation and reduce biodegradation of contaminants during storage.
After dosing was complete, one aliquot of each treatment was removed from storage and homogenized by thorough stirring. A stainless steel spatula was used to spread a 2 mm thick layer of the dosed sediments over the sediment brick in the designated mesocosm tank for each treatment during the day-time simulated low tide. Separate spatulas were used for each treatment to avoid cross-contamination.
Three additions of dosed sediments were added in this way; one addition a day on Day 1 (the day of sediment dosing), Day 2 and Day 3. Two millimeter layers were used to dose the mesocosms in order to prevent smothering the existing BMA in the sediment bricks. As BMA are known to migrate in sediments (MacIntyre et al., 1996; Consalvey et al., 2004), it was thought that by applying only thin layers of dosed sediments at a time, the BMA would be able to migrate to the surface of those sediments before the next layer was added. This is a more than reasonable assumption as BMA vertical migration rates have been reported to be 612 – 1008 µm h-1 (Consalvey et al., 2004).
All beakers and utensils used during this process were acid-washed in 10% HCl and thoroughly rinsed with deionized water before the next use.
Sampling and Maintenance
17
exposure period of this experiment (See Table 1.2 for sampling schedule details). On sampling days for fluorometry, five samples were taken from each treatment and
sectioned at 2 mm below surface level (as this is where the majority of photosynthetically active BMA reside (MacIntyre et al., 1996)) using a sectioning tool that pushes the sediment from the bottom of the core at 1 mm intervals with each turn of its handle. Sectioned samples were stored in 20 ml scintillation vials until processing within several hours of sectioning. Five samples from each treatment were also collected for HPLC at the beginning and end of the experiment. These samples were sectioned at a 5 mm depth and stored in 1 ml microcentrifuge tubes at -80ºC until analyzed. A depth of 5 mm was selected for the HPLC samples to determine whether or not BMA community
composition changed over time within the majority of the layer of contaminated sediment (since 6 mm total layer of contaminated sediment was applied to the collected sediment brick).
1
8
Table 1.2 Sampling schedule.
Day 0 Day 4 Day 7 Day 10
Details of Day The day before first
addition of dosed
sediments; initial samples taken
The day following final application of dosed sediments
Final sampling day
Samples taken; Sectioning depth
5 samples taken for fluorometry; sectioned at 2 mm depth
5 samples taken for HPLC; sectioned at 5 mm depth
5 samples taken for fluorometry; sectioned at 2 mm depth
5 samples taken for fluorometry; sectioned at 2 mm depth
5 samples taken for fluorometry; sectioned at 2 mm depth
19
Sample Analysis
Ten milliliters of HPLC-grade 100% acetone was added to samples taken for chl
a concentration analysis by fluorometry. The samples were agitated through vigorous
shaking for 30 seconds and stored at -20ºC for roughly 16 hours during extraction. Fluorescence of the extract was measured with a Turner ™ Trilogy Laboratory Fluorometer (model #: 7200-000) using the non-acidification method (Welschmeyer, 1994).
Once removed from -80ºC storage, samples for biomarker pigment analysis by HPLC were freeze dried overnight. To each sample, 1 ml 90% acetone and 50 µl of synthetic carontenoid β-apo-8’-carotenal (Sigma, cat. no. 10810) (an internal standard) were added. Samples were then sonicated for 30 seconds and stored at -20ºC for 24 hours during extraction. A centrifuge was used to spin down the samples and the supernatant (sample extract) was filtered through a 0.45-µm PTFE filter (Gelman Acrodisc). The filtered extract (450 µl) and an ion-pairing solution (1.00 M ammonium acetate) (113 µl) were dispensed into amber glass autosampler vials which were immediately loaded into the refrigerated (4ºC) autosampler for analysis.
Samples (250 µ L) were injected into a Shimadzu HPLC equipped with a monomeric and polymeric reverse-phase C18 column in series. A nonlinear binary
20
Statistical Analysis
A linear regression was performed on the chl a concentrations within samples from Day 0 and Day 10, measured by HPLC (independent variable) and fluorometric (dependent variable) methods in order to determine if there was linear relationship between values obtained by both methods.
Change in chl a concentration, determined by fluorometry, was compared between treatments for Day 0 – Day 4, Day 4 – Day 10 and Day 0 – Day 10. Separate single-factor ANOVAs were performed for each of the three time intervals to test for differences between treatments. Due to the inherent spatial variability of BMA abundance in sediments (MacIntyre et al., 1996), an average from the five samples taken within each tank on each sampling day was used as the representative value for that tank and day combination (See Equation 1.1). The Ryan-Einot-Gabriel-Welsch F (R-E-G-W-F) post-hoc test was used for multiple comparisons of means when significant treatment effects were observed.
In order to identify any change in benthic algal community composition, changes (as the difference between final and initial values) in fucoxanthin (a biomarker for diatoms) and zeaxanthin (a biomarker for cyanobacteria) concentrations, as well as changes in the fucoxanthin to zeaxanthin ratio (Fuco:Zea Ratio) were compared between treatments. The average concentration (for each pigment), as well as the average
21
zeaxanthin concentration as response variables, were used for statistical analysis of the biomarker pigment concentrations. A single-factor ANOVA using the change in
Fuco:Zea Ratio as a response variable was employed to compare changes in community composition between treatments. The R-E-G-W-F post-hoc test was used for multiple comparisons of means when significant treatment effects were observed.
IBM SPSS Statistics software (Version 21) was used for all analyses in this experiment. Tests were performed to verify that the data met assumptions of normality (K-S test), homogeneity (Levene’s test) and independence of variance (Durbin-Watson statistic) when appropriate.
1.3 RESULTS
Relationship between HPLC and fluorometric measurements
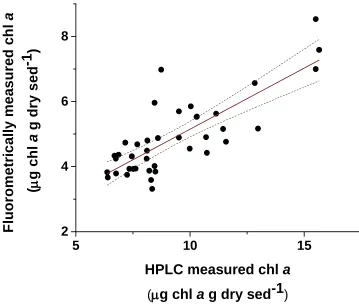
The linear regression analysis determined that there was a significant linear relationship between chl a concentrations measured with HPLC and fluorometric
methods (linear regression, p<0.001, adj. r2 = 0.624) (Figure 1.4). The linear relationship is expressed by Equation 1.1.
y = 0.375x + 1.396 (Equation 1.1) Where y = fluorometric values and x = HPLC values.
BMA biomass
22
5 10 15
2 4 6 8
F
lu
o
ro
m
e
tr
ic
a
ll
y
m
e
a
s
u
re
d
c
h
l
a
(
µµµµ
g
c
h
l
a
g
d
ry
s
e
d
-1
)
HPLC measured chl a
(
µ
µ
µ
µ
g chl a g dry sed-1
)Figure 1.4 Relationship between chl a concentrations measured by HPLC and
23
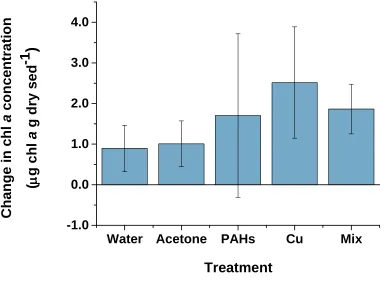
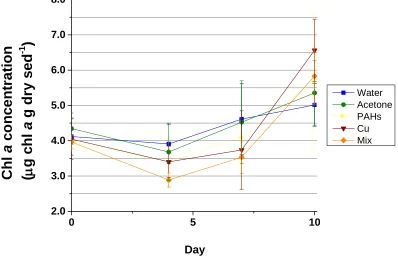
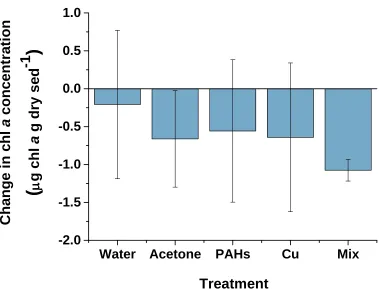
fluorometric methods (ANOVA, p = 0.325) during this 10 day experiment (Figure 1.5). There were, however, notable trends in the chl a concentrations throughout the
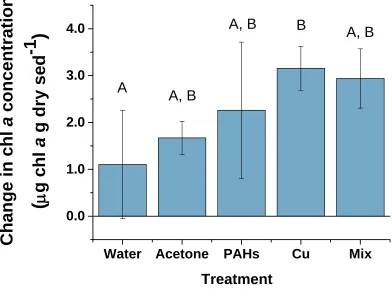
experiment. An initial decrease between Day 0 and Day 4 was observed in all of the treatments. This was then followed by an increase in chl a concentrations until the end of the experiment (Day 4 – Day 10) (Figure 1.6). No significant difference was measured between treatments with respect to the change in chl a concentration during the period of decline (ANOVA, p = 0.673), (Figure 1.7). However, there was a significant treatment effect on the change in chl a concentration between Day 4 and Day 10 (ANOVA, p = 0.032), when concentrations appeared to increase in all treatments (Figure 1.8). The increase in the Cu treatment was significantly greater than the increase in the Water control. Two homogeneous groups were revealed by the R-E-G-W-F post-hoc test: Water, Acetone, PAHs and Mix (p = 0.066); Acetone, PAHs, Mix and Copper (p = 0.133).
BMA community composition
24
Figure 1.5 Change in chl a concentration within dosed sediments from Day 0 to Day 10.
The reported change is the difference between Day 10 and Day 0 chl a concentrations within the top 2 mm of dosed sediments in mesocosm tanks, measured by fluorometric methods. Water and Acetone treatments were used as controls for contaminant (PAHs, Cu and Mix) treatments. The Mix treatment was dosed with both PAHs and Cu. Values represent means ± 1 SD (n = 4).
25
Figure 1.6 Change in chl a concentration within dosed sediments over time. Chl a
concentration values represent those within the top 2 mm of dosed sediments in
mesocosm tanks, measured by fluorometric methods. Water and Acetone treatments were used as controls for contaminant (PAHs, Cu and Mix) treatments. The Mix treatment was dosed with both PAHs and Cu. Values represent means ± 1 SD (n = 4).
0 5 10
26
Figure 1.7 Change in chl a concentration within dosed sediments from Day 0 to Day 4.
The reported change is the difference between Day 4 and Day 0 chl a concentrations within the top 2 mm of dosed sediments in mesocosm tanks, measured by fluorometric methods. Water and Acetone treatments were used as controls for contaminant (PAHs, Cu and Mix) treatments. The Mix treatment was dosed with both PAHs and Cu. Values represent means ± 1 SD (n = 4).
27
Figure 1.8 Change in chl a concentration within dosed sediments from Day 4 to Day 10.
The reported change is the difference between Day 10 and Day 4 chl a concentrations within the top 2 mm of dosed sediments in mesocosm tanks, measured by fluorometric methods. Water and Acetone treatments were used as controls for contaminant (PAHs, Cu and Mix) treatments. The Mix treatment was dosed with both PAHs and Cu. Letters above bars indicate homogeneous groups. Values represent means ± 1 SD (n = 4).
Water
Acetone
PAHs
Cu
Mix
0.0
1.0
2.0
3.0
4.0
A, B
B
A, B
28
Figure 1.9 Change in fucoxanthin concentration within dosed sediments. The reported
change is the difference between Day 10 and Day 0 fucoxanthin concentrations within the top 5 mm of dosed sediments in mesocosm tanks, measured by HPLC. Water and Acetone treatments were used as controls for contaminant (PAHs, Cu and Mix) treatments. The Mix treatment was dosed with both PAHs and Cu. Values represent means ± 1 SD (n = 4).
29
homogeneous groups within the zeaxanthin data: Cu and Mix (p= 0.645); Mix and Acetone (p = 0.068); Acetone and PAHs (p = 0.460); PAHs and Water (p = 0.133). All treatments (except Cu) showed an increase in zeaxanthin concentration over the
experiment (Figure 1.10). As a result, the change in the Cu treatments was significantly lower than that in the Water control, Acetone control and PAHs treatment. Though there was a slight increase in zeaxanthin concentration in the Mix treatment, this change was significantly lower than those observed in the Water control and PAHs treatment. The Water control also showed a significantly greater increase in zeaxanthin concentration that the Acetone control.
Linked to these differences between treatments with respect to pigment
30
Figure 1.10 Change in zeaxanthin concentration within dosed sediments. The reported
change is the difference between Day 10 and Day 0 zeaxanthin concentrations within the top 5 mm of dosed sediments in mesocosm tanks, measured by HPLC. Water and
Acetone treatments were used as controls for contaminant (PAHs, Cu and Mix) treatments. The Mix treatment was dosed with both PAHs and Cu. Letters above bars indicate homogeneous groups. Values represent means ± 1 SD (n = 4).
31
Figure 1.11 Change in Fuco:Zea Ratio within dosed sediments. The reported change is
the difference between Day 10 and Day 0 fucoxanthin to zeaxanthin ratios within the top 5 mm of dosed sediments in mesocosm tanks, measured by HPLC. Water and Acetone treatments were used as controls for contaminant (PAHs, Cu and Mix) treatments. The Mix treatment was dosed with both PAHs and Cu. Letters above bars indicate
homogeneous groups. Values represent means ± 1 SD (n = 4).
Water Acetone PAHs Cu Mix
32
1.4 DISCUSSION
The results from this study investigating the effects of PAHs and/or Cu on BMA biomass and BMA community composition suggest a complex benthic community response. Although HPLC provides a more accurate measurement of chl a concentration than fluorometry (Pinckney et al., 1994), it requires a great deal more processing time. For this reason, fluorometry was used as the primary method of measuring chl a in this study. The linear regression revealed a significant linear relationship between HPLC and fluorometric measurements of chl a concentrations, indicating that the samples analyzed by fluorometric methods can be used to make valid comparisons between treatments, in relative terms. Furthermore, the samples used for pigment analysis by HPLC were sectioned at a 5 mm depth, while those analyzed by fluorometry were sectioned at a 2 mm depth and the difference in sediment sample volume is likely a contributing factor to the higher chl a concentrations obtained by HPLC.
The chl a concentration measurements indicate that there was no significant treatment effect on the overall change in algal biomass during the 10 day experiment (Figure 1.5). This was contrary to my hypothesis that algal biomass in all contaminant treated tanks (PAHs, Cu and Mix) would decline due to the toxic effects of each of the contaminants tested and that there would be a synergistic effect upon exposure to both pollutants. Closer examination of the data throughout the experiment provides some insights into the possible dynamics of the sediment community.
Figure 1.6 shows an initial decreasing trend in chl a concentration in all
33
significant toxic effects of the contaminants on BMA, using BMA biomass as the response variable. Conversely, other work has shown copper to have direct toxic effects on algae such as inducing oxidative stress and ultrastructural impairment of cells likely due to the interference of copper with the cell membrane (Pinto et al., 2003; Wong and Zheng 2008; Sabatini et al., 2009). As a result, primary productivity and overall biomass can greatly be reduced (Cid et al., 1995; Alsterberg et al., 2007; Wong and Zheng 2008; Araújo et al., 2010). The copper concentration used in this study was higher than the EC50
for microalgal growth inhibition demonstrated by Moreno-Garrido et al. (2003) for the benthic pennate diatom, Cylindrotheca closterium, but no such effects were observed here. Microalgal sensitivity to copper is affected by interactions between species, with multispecies assemblages exhibiting higher EC50 values than single-species populations
(Yu et al., 2007; Levy et al., 2009). It is possible, therefore, that the concentration of copper used in the present study was too low to cause dramatic reductions in biomass (as observed in other studies) in the natural, multispecies sediment community utilized here. Furthermore, much of the copper in this experiment was likely adsorbed onto sediment and organic particles (Helland and Bakke, 2002) whereas other studies have exposed algal cultures in aqueous solutions (Cid et al., 1995; Wong and Zheng 2008: Araújo et al., 2010) in which the copper would be more bioavailable and therefore have stronger
34
al., 2008). Individual PAH compounds vary in toxicity and can act synergistically or antagonistically with other PAH compounds, resulting in complex effects dependent on the PAHs involved (Wang et al., 2008). Therefore, the lack of significant PAH toxic effects may be due to the relatively low concentration, the combination of compounds and the mode of exposure used in this experiment. PAHs and copper have the potential to negatively affect BMA biomass, but no such effects were measured in this experiment, possibly due the methods employed.
Alternatively, toxic effects may have been induced by the contaminants but remained undetected due to the sampling schedule used in this experiment. PAHs and copper can induce oxidative stress, inhibit growth or reduce biomass in BMA
communities within 24 hours of exposure (Cid et al., 1995; Wang and Zheng, 2008; González et al., 2009). However, in the present study, sediment samples were not collected until four days after initial contaminant introduction. By that time in the experiment, BMA communities may have begun to recover (in terms of biomass) from initial contaminant effects as they have been shown to be resilient to disturbances (Piehler et al., 2003; Alsterberg et al., 2007; González et al., 2009). Alsterberg et al. (2007) revealed that light utilization efficiency and primary production of benthic microalgae were significantly reduced within 24 hours of exposure to a
35
observed for controls. These results provide support for the hypothesis that in the present study, BMA recovery may have occurred before sampling on Day 4. The trend in Figure 1.6 suggests average chl a concentrations for all contaminant treatments were lower than those of the controls at Day 4, hence, it is possible that there were immediate toxic effects due to contaminant exposure, but rapid BMA recovery diminished the evidence of those effects (relative change in chl a concentration) before the first samples after exposure where taken. Further experimentation implementing more frequent sampling would be needed determine if PAHs and/or copper at the environmentally relevant concentrations used in this study produce any negative impacts on BMA biomass within very short time periods after exposure.
After the period of decline (Day 0 – Day 4), chl a concentrations increased in every treatment until the end of the experiment (Day 4 – Day 10), with final values exceeding initial values (Figure 1.6). The general increase was likely due to the exclusion of large grazers, such as fiddler crabs and gastropods, from the mesocosms. The biomass increase in the Cu treatment from Day 4 to Day 10 was significantly greater than that in the Water control suggesting a contaminant effect (Figure 1.8). A possible explanation is that the greater increase was the result of toxic copper effects on meiofauna, which thereby decreased grazing pressure on BMA. Several studies have found that copper significantly alters the meiofauna community composition and reduces overall meiofauna abundance (Dalto et al., 2006; Alsterberg et al., 2007). More specifically, nematodes (the most predominant meiofauna group found in North Inlet tidal flats (Findlay 1981;
36
Gyedu-Ababio and Baird, 2006) upon copper exposure, but these responses are species specific. In the study by Alsterberg et al. (2007), a significant reduction in meiofauna abundance from exposure to a copper containing antifouling agent was not seen until 9 days after contamination, indicating a somewhat latent effect. The significant
contaminant effect on chl a concentration in the present study was not detected until after Day 4 (more specifically, the greatest increase occurred between Day 7 and Day 10) (Figure 1.6). Therefore, the possibility that a reduction in grazing pressure due to toxic effects on meiofauna allowed for a significant increase in BMA biomass at that point in the experiment within copper treated tanks is supported by the Alsterberg et al. (2007) study. The trends in the data (dramatic alterations in slope and steep slope from Day 7 – 10) suggest the BMA population did not reach steady state by the end of the 10 day experiment. Differences between the Cu treatment and control, therefore, may have reached an even greater magnitude over longer time periods, especially if sufficient time was allowed for the developmental effects of copper on meiofauna to exert an influence. The implications of these results could be of ecological significance in that meiofauna are involved in the breakdown of detritus, the cycling of nutrients and serve as important bioturbators as well as food sources to higher trophic levels (Coull, 1999). Thus a reduction in meiofauna abundance could have impacts on biogeochemical cycles and food webs (through both bottom-up and top-down effects) of estuarine habitats.
37
was not the case (which appears to be due to the high degree of variability in the data from the Water and Mix treatments), the change in chl a from Day 4 – Day 10 in the Mix treatment was very close to and not significantly different than that of the Cu treatment (according to the post-hoc test) (Figure 1.8). This suggests there may have been some degree of a contaminant effect. The significance of that effect in the Mix treatment may have been reduced due to an antagonistic interaction between the two contaminants with respect to meiofauna response. While copper can have toxic effects (Vranken and Heip, 1986; Korthals et al., 1996; Dalto et al., 2006; Gyedu-Ababio and Baird, 2006; Alsterberg et al., 2007), some nematode species show an increase in abundance (Mahmoudi et al., 2005) and grazing rate (Carman et al., 1997) after PAH exposure. Alternatively, as organic compounds can form complexes with copper, interaction between the contaminants affecting bioavailability (and therefore toxicity to meiofauna) may be another explanation for the slightly less stimulatory effect on BMA observed in the Mix treatment (Newell and Sanders, 1986; Meador, 1991; Breault et al., 1996; Wright and Mason, 2000; Renella et al., 2004). This result exemplifies the potential complexity behind multiple stressor interactions and the difficulty in interpretation, and subsequent prediction, of organismal responses.
38
exposed communities to diesel, which is comprised of a suite of many PAHs (Dobbins et al., 2006). The lack of evidence for toxic effects of PAHs on meiofauna in this study contrasts with the findings of other work, but may be attributed to the dosing specifics.
While there was no significant treatment effect on overall change (Day 0 – Day 10) in algal biomass based on chl a concentrations, there was a significant shift in the BMA community composition due to copper exposure. The initial Fuco:Zea Ratios for all treatments were ~ 10:1, but by Day 10 that ratio roughly doubled in the Cu and Mix treatments. These dramatic increases in the Fuco:Zea Ratio suggest an increase in relative diatom to cyanobacteria abundance in those tanks that had been treated with copper (Cu and Mix treatments). The shift in this ratio for those treatments is the product of much smaller changes in the zeaxanthin concentrations (a decrease in the Cu treatment and only a slight increase in the Mix treatment) relative to the increases in fucoxanthin
concentrations in both treatments. The changes in zeaxanthin concentration were significantly less in the Cu and Mix treatments than several other treatments (including the Water control) (Figure 1.10), while the change in fucoxanthin concentration showed no significant difference between treatments (Figure 1.9). At the concentration used in this study, PAHs had no effect on the Fuco:Zea Ratio or the respective pigment
concentrations relative to the control. It appears that exposure to copper solely drove the changes in BMA community composition in this experiment.
39
negative copper effects may be related to their morphology and physiology.
Cyanobacteria are prokaryotes, possessing no membrane-bound organelles and are hence, less structurally complex than eukaryotic algae. Hadjoudja et al. (2009) proposed that this lack of compartmentalization in cyanobacterial cells allows for easier access of copper to the photosystem, contributing to their greater sensitivity to this heavy metal than other algal groups. Nitrogen-fixation, a process essential to the functioning of some
cyanobacteria but not required by other microalgae, is inhibited by copper (Horne and Goldman, 1974) making that physiological process another potential factor adding to the susceptibility of cyanobacteria to copper. The sensitivity of algal groups to copper varies but seems to be greater in the prokaryotic cyanobacteria, possibly due to a combination of structural (morphological) and physiological (biochemical) traits they possess.
The implication that cyanobacteria are significantly affected by copper exposure could be of great importance in coastal areas where they dominate, including regions along the coast of New England, Europe and California (Sullivan and Currin 2000, Currin et al. 2011). Cyanobacteria can not only play important roles in salt marsh
ecosystems as primary producers, but some also have the ability to fix N2, making them a
40
41
CHAPTER 2: FIDDLER CRAB FEEDING RESPONSES TO SEDIMENTS
CONTAMINATED WITH POLYCYCLIC AROMATIC
HYDROCARBONS AND/OR COPPER
2.1 INTRODUCTION
Fiddler crabs (Uca spp.) are ubiquitous salt marsh residents and their biomass is usually the highest of all macro-invertebrates in those habitats (Montague, 1980). These decapods play very important roles in salt marsh ecosystems as a food source for fish, birds, and other crustaceans. Many of these predators are only temporary marsh residents and their consumption of fiddler crabs coupled with subsequent relocation could function as an energy export from marsh habitats (Montague, 1980; Grimes et al., 1989).
Fiddler crabs also serve as bioturbators since some of the most important activities for the survival of a fiddler crab, and for the functioning of the salt marsh ecosystem, involve the manipulation of sediments. Burrowing by these crabs provides refuge and also aerates the sediments, altering the sediment hydrology and chemistry which in turn can stimulate the growth of marsh grasses (Katz, 1980; Montague, 1980; Bertness, 1985; Grimes et al., 1989; Smith et al., 2009). While foraging during low tide, fiddler crabs bring sediments to the buccal cavity with the minor chelae where
42
substrate in small irregular shaped balls (feeding pellets) (Miller, 1961). The deposit feeding of fiddler crabs, therefore, results in additional bioturbation that oxygenates the sediments, altered grain size distribution and decreased organic content of sediments (Hoffman et al., 1984; Meziane et al., 2002; Sayão-Aguiar et al., 2012). These alterations in sediment characteristics can also affect sediment chemistry as well as microbial activity. The bioturbation associated with fiddler crab activity (burrowing and feeding) has both biological and physical impacts important for salt marsh ecosystem health.
Because fiddler crabs are deposit feeders that consume organic matter in sediments, including benthic microalgae (BMA), these decapods could be directly affected by changes in quantity or quality of BMA that result from anthropogenic disturbances. Increased urbanization in coastal areas has been associated with relatively high concentrations of various pollutants in tidal creeks (Sanger et al., 1999 a, b; Holland et al., 2004; Van Dolah et al., 2008; Garner et al., 2009). Polycyclic aromatic
hydrocarbons (PAHs), found in petroleum products and released upon combustion of fossil fuels, and copper are two common contaminants in estuarine habitats that can be introduced by a number of human activities. Urban runoff, oil spills or leaks and air deposition of PAHs released during combustion processes serve as frequent PAH sources to the environment (Kucklick et al. 1997; Ngabe et al., 2000; Kose et al., 2008; Nikolaou et al., 2009). Copper-based biocide paint, commonly used on boats and docks, is one of the main sources of copper in coastal habitats. In addition, urban runoff, sewage
43
contaminants in coastal sediments (Helland and Bakke, 2002; Nikolaou et al., 2009; Tobiszewski and Namieśnik. 2012). As such, there is potential for PAHs and copper to
affect benthic organisms, including fiddler crabs and their food sources. BMA biomass, as well as BMA community composition, can be negatively impacted by PAHs and copper (Cid et al., 1995; Piehler et al., 2003; Wang and Zheng, 2008; Wang et al., 2008). Because these primary producers form the foundation of many estuarine food webs, subsequent effects on trophic energy transfer and on organisms at higher trophic levels due to contaminant exposure of this food source are possible.
The chemosensory system plays a significant role in the behavior of fiddler crabs, and has evolved to be somewhat specialized. The feeding of fiddler crabs is mediated by this system which involves sensory receptors located on the minor chelae and legs of the crab (Robertson et al., 1980). At low tide, fiddler crabs probe the sediments with their appendages, evaluating the organic content based on chemical cues received by the sensory receptors immersed in the sediments (Robertson et al. 1980). Feeding is initiated when the sensory stimulation exceeds a threshold, thus the feeding response is dependent upon food density (Robertson et al. 1980). Aside from the ability to detect differences in food quantity, Robertson et al. (1981) showed sand fiddler crabs (Uca pugilator) can also distinguish between different chemical stimulants. Feeding behavior is elicited by
44
very sensitive to chemical stimuli and these crabs have the ability to detect chemical differences (as quantity and quality of stimuli) in sediments.
Proper functioning of the chemosensory system, therefore, is essential to fiddler crab survival. Chemical contaminants can often interfere with crustacean chemosensory, resulting in altered behavior or a lack of responses to natural chemical stimuli. There has been some evidence that other crustacean groups have the ability to detect various pollutants (including PAHs and copper) and show avoidance of them (McLeese, 1975; Hellou et al., 2005; De Lange et al., 2006). In addition, a reduction in feeding behavior has been observed for lobsters, crayfish and blue crabs due to PAH exposure (Atema and Stein, 1974; Pearson and Olla, 1980; Gauthier 2012) as well as in prawn and lobsters after copper exposure (McLeese, 1975; Santos et al., 2000). Persistent alterations in feeding responses as a result of chronic exposure to these contaminants in natural habitats may have detrimental impacts on the health of crustaceans. In the case of fiddler crabs, impaired health and a decline in bioturbation due to reduced feeding activity could
impact the functioning of the entire ecosystem. The strong influence of the chemosensory system over fiddler crab behavior may lead to avoidance of chemically contaminated habitats if the contaminants are detected or an alteration (perhaps even an inhibitition) in feeding behavior if the contaminants disrupt functioning of the chemosensory system.
45
system, it was hypothesized that fiddler crabs would avoid feeding in contaminated sediments, with higher avoidance of those contaminated with multiple pollutants (PAHs and Cu). Two possible mechanisms leading to this result were postulated and evaluated in this experiment. First, any avoidance of crab feeding in contaminated sediments may have been related to food quantity (BMA biomass) and quality (BMA community composition). Differences in these parameters were expected between treatments (controls and various contaminant treatments) and it was predicted that BMA biomass would be significantly reduced (and BMA community composition would be altered) due to contaminant exposure (Witaker et al., 1978; Cid et al., 1995; Wang and Zheng, 2008; Wang et al., 2008). Since fiddler crab feeding is dependent on food density, it was proposed that this could lead to a reduction or avoidance of crab feeding in those
treatments. The second possible mechanism that could lead to avoidance of contaminant treatments was chemical contaminant interference with proper chemosensory
functioning. Because fiddler crab feeding is mediated by the chemosensory system, a disruption in receiving and/or the processing of natural stimuli (from food sources) could inhibit crab feeding, hence resulting in avoidance of those sediments.
The second objective of this study was to determine if the presence of chemical contaminants (PAHs and/or copper) in sediments would affect the feeding rate of fiddler crabs when no alternative food choice was provided. Based on the chemosensory
46
The crucial roles fiddler crabs and their feeding activities play in salt marsh ecosystems make research centered around the impacts of contaminants on fiddler crab feeding behavior essential for predicting responses at larger scales.
2.2 METHODS
Study Site
North Inlet (33.3º N, 79.1º W) is a bar-built estuary within the boundaries of the North Inlet – Winyah Bay National Estuarine Research Reserve (NI – WB NERR) in Georgetown, SC. This estuary contains extensive tidal creeks and experiences regular semi-diurnal tides, with a mean tidal amplitude of 1.4 meters. Major contributors to the primary production of North Inlet include Spartina alterniflora, as well as BMA. North Inlet is considered a relatively pristine with more than 90% of its watershed in a naturally forested state.
Sediments and sand fiddler crabs (Uca pugilator) used for the crab food choice and crab feeding rate experiments were collected from this site due to its relatively pristine condition, ensuring limited contaminant exposure of the natural benthic community prior to the experiment.
Crab food choice: Sediment collection
47
single replicate were collected within a three meter span of the tidal flat at the same distance away from the bank to reduce spatial variability in sediment grain size and organic content/composition. Sediment bricks were transferred to the mesocosm tanks and immediately transported to the experimental study site behind the main research facility at the Belle W. Baruch Institute for Marine and Coastal Science (Figure 2.1). The site was exposed to full sun from 10:00 am - 3:30 pm and experienced ambient
temperatures.
Crab food choice: Dosing and sediment incubation
To determine if crabs avoid feeding in contaminated sediments, crab food
48
Figure 2.1 Location of research area in Georgetown, South Carolina, USA.
49
5
0
Table 2.1 Sediment dosing details.
Treatment Contaminant Added Solvent Used Fluid Volumes Added Concentrations of Pollutants Added
Water None N/A 40 ml deionized water N/A
Acetone None N/A 20 ml 100% acetone
20 ml deionized water
N/A
PAHs Mixture of PAHs
(included pyrene, phenanthrene and anthracene)
100% acetone 20 ml 100% acetone
20 ml deionized water
10 µg total PAHs/g dry sed
(composed of 6 µg pyrene/g dry sed; 3 µg phenanthrene/g dry sed;
1 µg anthracene/g dry sed)
Cu Copper (as 5 H2O ·
CuSO4)
Deionized water 40 ml deionized water 70 µg Cu/g dry sed
Mix Mixture of PAHs
(included pyrene, phenanthrene and anthracene)
Copper (as 5 H2O ·
CuSO4)
100% acetone (for PAHs)
Deionized water
(for 5 H2O ·
CuSO4)
20 ml 100% acetone
20 ml deionized water
10 µg total PAHs/g dry sed
(composed of 6 µg pyrene/g dry sed; 3 µg phenanthrene/g dry sed;
1 µg anthracene/g dry sed)
51
The sediments were dosed by adding the appropriate components (depending on the designated treatment) directly to an aliquot of field collected surface sediments. After thorough mixing, the dosed sediments were spread over top of the previously collected sediment brick in the designated mesocosm for each treatment. Application of dosed sediments took place over three days, with only a 2mm thick layer being applied at a time.
The dosed sediments were incubated in the mesocosm tanks, which simulated semi-diurnal tides and were exposed to natural sunlight (refer to Figure 2.3 for mesocosm set-up details). On Day 10 of the incubation, core tubes with a 1.0 cm2 interior area were used to take sediment samples for chlorophyll a (chl a) concentration analysis using fluorometry and for biomarker pigment analysis by high performance liquid
chromatography (HPLC). Five samples were taken for fluorometry and sectioned at 2 mm below surface level (as this is where the majority of photosynthetically active BMA reside (MacIntyre et al., 1996)) using a sectioning tool that pushes the sediment from the bottom of the core at 1 mm intervals with each turn of its handle.Sectioned samples were stored in 20 ml scintillation vials until processing, which took place within several hours of sectioning. Five samples were also collected for HPLC. These samples were sectioned at a 5 mm depth and stored in 1 ml microcentrifuge tubes at -80ºC until analyzed.
After the 10 days of incubation, the top 2-3 mm of sediments were scraped off
52
Pump
Carboy
(Seawater Reservoir)
Figure 2.3 Diagram of mesocosm set-up. Pumps were controlled by timers, allowing for
simulation of semidiurnal tides. The large rectangle represents the mesocom tank, containing collected sediments (brown coloration) and several centimeters of water (during a simulated high tide) (blue coloration). Circles represent holes in the tank functioning either as drains or the point of water introduction. Curved lines represent tubing, with arrow heads indicating the direction of water flow. Note the relative size of the holes in the mesocosm tank. The hole corresponding to the point of water
53
Crab food choice: Experiment set-up
Acircular arena was constructed of poster board (attached to a poster board base) for the food choice experiments. Three arenas were used for each of the four replicates. Sediments collected from each mesocosm were homogenized by thorough stirring and used to fill two petri dishes for each of the three arenas corresponding to that specific replicate (for a total of 10 dishes per arena; resulting from 5 treatments x 2 dishes per treatment) (see Figure 2. 4; Figure 2.5). Prior to being filled, each petri dish was labeled on the bottom with the treatment name in order to prevent any observer bias throughout the experiment. All 10 petri dishes were arranged along the border of the arena and spaced 5.5 cm apart. As the label of each dish was not visible during placement, the order of the dishes was random and unknown during the experiment. Dishes were numbered 1-10 on the poster board base for data recording purposes. Four large male fiddler crabs (~ 22 mm carapace width) were then introduced into the center of the arena and allowed to feed for 24 hours. Four petri dishes filled with water were also added to the center of the arena to prevent desiccation of the crabs. These crabs had been captured from the tidal flat collection site previously described (Figure 2.1; Figure 2.2) and starved for 48 hours prior to their introduction into the arena.
Crab food choice: Data collection
Observations about which (if any) dish a crab was occupying were made ten times in every arena throughout the experiment (the number of the dish was noted) as a
5
4
W
A
P
C
M
M M M M M M
M
W W
W W
W W W A A A A A A P P P P P P C C C C C C
M M
M
W
W A
A A P P P P C C C M M W
W A
A A P P C C C
Arena 1
Arena 2
Arena 3
55
Figure 2.4 Diagram of food choice experiment set-up. Letters represent the different
treatments: W = Water; A = Acetone; P = PAHs; Cu = Copper; M = Mix. Rectangles represent the incubation mesocosms dosed sediments were collected from, then
Figure 2.5 Crab food choice experiment photo. Dosed sediments were distributed into petri dishes which were arranged around the perimeter of a circular
fiddler crabs were then introduced into the arena and allowed to feed from the dishes for 24 hours.
56
Figure 2.5 Crab food choice experiment photo. Dosed sediments were distributed into petri dishes which were arranged around the perimeter of a circular arena. Four male fiddler crabs were then introduced into the arena and allowed to feed from the dishes for Figure 2.5 Crab food choice experiment photo. Dosed sediments were distributed into
57
feeding pellets (non-ingested sediment clumps) inside or within a 2 cm radius of each dish was counted. Because fiddler crabs produce these small pellets as they extract and ingest organic matter (Miller, 1961), they were used as a relative measure of the amount of feeding that took place in each dish. Pellets were destroyed after being counted to prevent re-counting. This method of evaluating foraging intensity by counting feeding pellets is similar to that employed by Robertson et al. (1980, 1981).
Crab food choice: Sediment sample analysis
Ten milliliters of HPLC-grade 100% acetone was added to samples taken for chl
a concentration analysis by fluorometry. The samples were agitated through vigorous
shaking for 30 seconds and stored at -20ºC for roughly 16 hours during extraction. Fluorescence of the extract was measured with a Turner ™ Trilogy Laboratory Fluorometer (model #: 7200-000) using the non-acidification method (Welschmeyer, 1994).
Once removed from -80ºC storage, samples for biomarker pigment analysis by HPLC were freeze dried overnight. To each sample, 1 ml 90% acetone and 50 µl of synthetic carontenoid β-apo-8’-carotenal (Sigma, cat. no. 10810) (an internal standard) were added. Samples were then agitated for 30 seconds with a sonifier and stored at -20ºC for 24 hours during extraction. A centrifuge was used to spin down the samples and the supernatant (sample extract) was filtered through a 0.45-µm PTFE filter (Gelman Acrodisc). The filtered extract (450 µl) and an ion-pairing solution (1.00 M ammonium acetate) (113 µl) were dispensed into amber glass autosampler vials which were
58
Samples (250 µ L) were injected into a Shimadzu HPLC equipped with a monomeric and polymeric reverse-phase C18 column in series. A nonlinear binary
gradient consisting of the sovlents 80% methanol:20% 0.50 M ammonium acetate and 80% methanol:20% acetone was used for pigment separations. Absorption spectra and chromatograms (440 ± 4 nm) were acquired using the Shimadzu software and pigment peaks were identified based on retention times and absorption spectra (Pinckney et al. 1996).
Crab food choice: Statistical analysis
Because Replicates 1 and 2 were conducted at the same time and exposed to slightly different environmental conditions than Replicates 3 and 4, there may have been inherent differences with respect to food quantity or quality (BMA biomass or
community composition, respectively) linked to the abiotic factors incubations were subjected to. Additionally, since Replicates 1 and 2 took place several weeks before Replicates 3 and 4, crabs were collected at slightly different points in the summer as well. Due to the potential for effects related to the time at which replicates were conducted, the replicates were identified as belonging to two groups (Replicates 1 and 2 were considered Group 1 and Replicates 3 and 4 were Group 2).
59
Wx,y,1 + Wx,y,2 = Wx,y,Total (Equation 2.1)
Where W = value (# of observations or # of feeding pellets) for a dish, x = replicate number, y = arena number, the third subscript represents the Dish # for that specific treatment and Wx,y,Total = total value (# of observations or # of feeding pellets) for a
treatment of Replicate x in Arena y.
(Wx,1,Total + Wx,2,Total + Wx,3,Total) / 3 = Wx,Avg (Equation 2.2)
Where W = value (# of observations or # of feeding pellets) for an arena that was derived from Equation 2.1, x = replicate number, the second subscript denotes arena number, Wx,Avg = value used in statistical analysis for Replicate x. These equations were used to
derive the values to be statistically analyzed for each treatment in every replicate.
Each data set (number of observations and number of feeding pellets) was analyzed with a two-factor ANOVA using treatment and “replicate group” as the main factors. “Replicate group” was used as a block factor in the ANOVAs to control for any inherent differences due to replicate timing.
60
factor. These measurements were obtained from the sediment samples collected on Day 10 of the incubation, which were subsequently used for the food choice experiment. An analysis of covariance (ANCOVA) was also performed using treatment as the main factor, chl a and Fuco:Zea Ratio as covariates and number of feeding pellets as the response variable.
Due to the inherent spatial variability of BMA in sediments (MacIntyre et al., 1996), an average from the five samples taken within each treatment on each sampling day was used as the representative value (chl a concentration or Fuco:Zea Ratio) for that treatment and day combination in the appropriate statistical analysis.
IBM SPSS Statistics software (Version 21) was used for all analyses in this experiment. Tests were performed to verify that the data met assumptions of normality (K-S test) and homogeneity (Levene’s test). The Ryan-Einot-Gabriel-Welsch F (R-E-G-W-F) post-hoc test was used for multiple comparisons of means when significant treatment effects were observed.
Crab feeding rate: Sediment collection & set-up