Abstract—This paper presents a technique to integrate a
stand-alone weighing indicator with proprietary commands into a monitoring system of industrial production processes. The proposed technique is based on creating a new function block of the programmable logic controller (PLC) used in weighing machine control for converting weighing indicator commands into the Modbus-RTU commands. Creation of the function block operated in the PLC modeled CP1L-M30DR-D for converting commands of the AD-4401 weighing indicator to display on the Panel Master touch-screen monitor is described as an illustrative case study. Based on the proposed method, weighing data at the field site for local readout can be added into process data monitoring at the human machine interface (HMI) station of the PLC-based system. This enables ease of upgrading the weighing machine used, which has weighing indicator with local readout display. Performance of the proposed system integration is verified by experimental results.
Index Terms—Modbus, PLC, system integration, weighting
indicator
I. INTRODUCTION
EIGHING process plays an important role in agriculture industry. Production and packaging processes generally require mechanical scales such as bins, hoppers, silos, and trucks to weigh materials. The weighing equipment could be placed on force sensors like load cells for batching and mixing applications, and the force sensors are usually used for automatic weighing and totalizing [1-4]. However, some indicators with proprietary commands still provide local readout for making manual records by operators [1-2]. Some automatic weighing systems using industrial bus communications are designed to provide real- time monitoring capability [3] or to develop supervision [4].
This paper aims to propose a useful technique for improving the monitoring capability of PLC-based automatic weighting systems from local readout at the field site only to remote monitoring at the HMI station. The
Manuscript received October 1, 2016; revised November 20, 2016. L. Chanka is with Faculty of Engineering, King Mongkut’s Institute of Technology Ladkrabang, Bangkok, Thailand, 10520 (e-mail: [email protected]).
K. Smerpitak is with the Faculty of Engineering, King Mongkut’s Institute of Technology Ladkrabang, Bangkok, Thailand, 10520 (e-mail: [email protected]).
P. Julsereewong is with Faculty of Engineering, King Mongkut’s Institute of Technology Ladkrabang, Bangkok, Thailand, 10520 (e-mail: [email protected]).
A. Julsereewong is with Faculty of Engineering, King Mongkut’s Institute of Technology Ladkrabang, Bangkok, Thailand, 10520 (phone: 662-329-8348; fax: 662-329-8349; e-mail: [email protected]).
proposed technique is an integration of the weighing indicator with proprietary commands into the PLC-based control system. A new function block operated in the PLC is developed for converting the proprietary weighing commands into the Modbus-RTU commands. Experimental results obtained from the case study to demonstrate the performance of the proposed technique are also included.
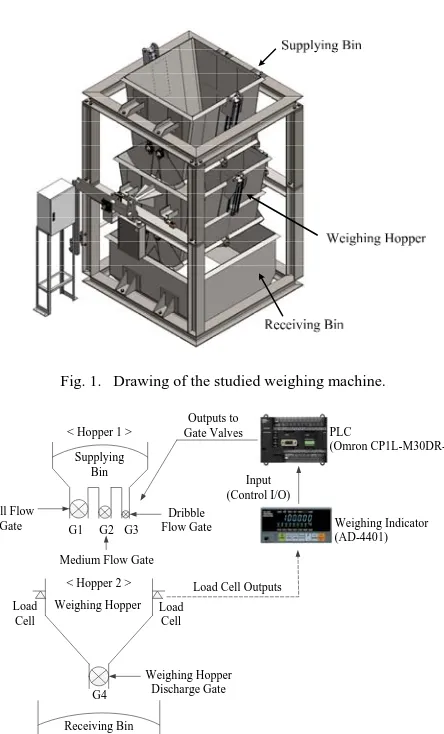
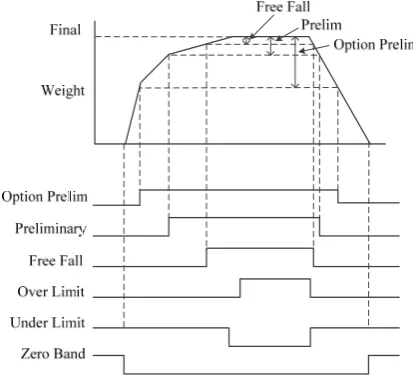
[image:1.595.315.537.401.768.2] [image:1.595.327.529.419.582.2]II. STUDIED WEIGHING SYSTEM FOR IMPROVEMENT Fig. 1 shows a drawing of the studied weighing machine, sometimes called continued dumping scale, which comprises of three main parts; supplying bin, weighing hopper, and receiving bin. Fig. 2 shows a system architecture diagram of the studied weighing machine, which is used to check weighing and totalizing of falling
Fig. 1. Drawing of the studied weighing machine.
G1 G2 G3
Dribble Flow Gate
Medium Flow Gate Full Flow
Gate
< Hopper 1 > Supplying
Bin
< Hopper 2 > Weighing Hopper Load
Cell
Load Cell
G4
Receiving Bin
Outputs to Gate Valves
Load Cell Outputs Input (Control I/O)
Weighing Indicator (AD-4401) PLC
(Omron CP1L-M30DR-D)
[image:1.595.310.544.600.770.2]Weighing Hopper Discharge Gate
Fig. 2. System architecture of the studied weighing machine.
Integration of Weighing Indicator with
Proprietary Commands into PLC-Based System
Using Modbus Protocol
Lerson Chanka, Krit Smerpitak, Prasit Julsereewong, and Amphawan Julsereewong, Member, IAENG
Fig. 3. Sequential operation of the studied weighing machine.
TABLE I. CONDITION PARAMETERS FOR WEIGHING SEQUENCE.
Output Terminal Output Condition
Zero Band Gross ≤ Zero Band
Full Flow Net ≥ Final – Optional Preliminary (Option Prelim.)
Medium Flow Net ≥ Final – Preliminary (Prelim.)
Dribble Flow Net ≥ Final – Free Fall
Over Limit Net > Final + Over Limit
Under Limit Net < Final – Under Limit
materials from the supplying bin. Four load cells are installed in the weighing hopper. The load cell outputs are sent to the weighing indicator with local user interface and readout like AD-4401 to perform weighing sequence. The control input/output (Control I/O) of the weighing indicator is passed to the PLC modeled CP1L-M30DR-D for controlling the pneumatic gate valves (G1-G4) to open or close. Fig. 3 displays a sequence diagram of the target weight (or ‘Final’ weight) required for weighing sequence of the AD-4401, where the condition parameters are given in Table I.
From Fig. 3, the functional description can be briefly explained as follows.
1. Clear the display on the AD-4401 to zero.
2. Open the gate valves G1 (full flow), G2 (medium flow), and G3 (dribble flow), the display on the AD-4401 is incremented, and when it reaches the ‘Option Prelim’, its output is turned on and sent to the PLC for closing the gate valve G1.
3. When the display reaches the ‘Prelim’, its output is turned on and passed to the PLC for closing the gate valve G2. 4. When the display reaches the ‘Free Fall’, its output is
turned on and passed to the PLC for closing the gate valve G3. Now one weighing cycle is completed, and the AD-4401 display shows the ‘Final’ value, indicating the weighing hopper has been loaded with that weight. 5. Use the ‘Over Limit’ and ‘Under Limit’ setting to check
whether the weight value is within these limits.
6. When the gate valve G4 is opened to discharge material into the receiving bin, use the setting of the ‘Zero Band’ to confirm that the material has been completely discharged.
III. PROPOSED SYSTEM INTEGRATION
Fig. 4 shows the proposed system integration by connecting the HMI station and the weighing indicator with proprietary commands to the PLC at Port 1 and Port 2, respectively, using the RS-485 network. In order to transfer the measured data from the weighing indicator with local readout to be monitored at the HMI station in real time, a concept to realize the new function block for being operated in the PLC is depicted Fig. 5. The data communications between the HMI station and the PLC are based on the
Fig. 4. Proposed system integration.
Mo
dbu
s R
equ
es
t
Mod
bus
R
esp
ons
e
C
o
m
m
and R
equ
es
t
C
o
m
ma
n
d
R
es
pon
[image:2.595.378.475.518.769.2]se
Fig. 5. Concept for realizing the new function block of the PLC.
Start
Move @01RW, @01RS, @01RT, @01SS to Arry RW, RS,RT, SS
Send each command to the weighting indicator via Port 2
Receive the data and classify to save in Arry RW_Arry, RS_Arry, RT-Arry
Convert the data from ASCII to Hex, and move to mapped register address
[image:3.595.316.535.49.218.2]Stop
[image:3.595.105.233.53.254.2]Fig. 7. Flowchart diagram for the PLC Port 2.
TABLE II. MAJOR PARAMETERS FOR DATA EXECUTION IN THE
PROPOSED FUNCTION BLOCK OF THE PLC
Parameter Description
Recv_1[256], Send_1[256] Received and sent messages at Port 1
Recv_2[256], Send_2[256] Received and sent messages at Port 2
RW[4], RS[4], RT[4], SS[4]
Saved request-weight commands for sending to the weighting indicator
RW_Arry[30], RS_Arry[30], RT_Arry[30] Received messages from the weighing indicator
Final_Arry[2], Free_Fall_Arry[2], Prelim_Arry[2], Over_Arry[2], Oplim_Arry[2], Under_Arry[2], Zero_Arry[2], Accu_Weigh_Arry[2], Accu_Count_Arry[2], RW_H[2]
Required weighing data for sending to the HMI station
Modbus-RTU master/slave protocol. Flowchart diagrams for representing the sequence of steps to perform data processing at the Port 1 and Port 2 are shown in Figs. 6 and 7, respectively. Table II summarizes the major parameters for data execution in the proposed PLC function block.
IV. APPLYING PROPOSED TECHNIQUE FOR CASE STUDY In order to improve the weighing system as discussed in Section II for providing the real-time monitoring capability, the proposed technique is used to integrate the AD-4401 weighing indicator, the Omron PLC modeled CP1L-M30DR-D, and the Panel Master touch-screen monitor for working together. Fig. 8 shows a wiring diagram for device physical connections. Based on the proposed concept in Fig. 5, the function block is built for being operated in the Omron PLC used and for converting the commands of the AD-4401 weighing indicator to display on the Panel Master touch-screen monitor (or HMI station).
Table III gives examples of request and response messages based on the Modbus-RTU frame structure for data transfers between the master touch-screen monitor and the slave function block located in the PLC at the Port 1. Fig. 9 shows the response message including the AD-4401 weighing data for holding resisters at the Port 2.
HMI Station Panel Master
MODEL : PT070-WST2B-F1R1
OMRON PLC
CP1W-CIF11
RDA - RDB + SDA- SDB+ FG
- +
RS 485 ON BOARD SG PORT 1 Weighing Indicator AD-4401 OMRON PLC CP1W-CIF11
RDA - RDB + SDA- SDB+ FG OP-03 RS-422/-485
PORT 2 1 2 3 4 6 SDA SDB RDA RDB SG
Fig. 8. Wiring diagram for physical connections between devices.
TABLE III. EXAMPLES OF REQUEST AND RESPONSE MESSAGES BASED ON THE MODBUS-RTUFRAME STRUCTURE
Example of Request Message Example of Response Message
Field Data Field Data
Slave Address 01 Slave Address 01
Function Code
(Read Hoding Registers) 03
Function Code
(Read Holding Registers) 03
Start Address (H) 0B Number of Data Bytes 04
Start Address (L) BD Register Value (H) in DM3005 00
Number of Resisters (H) 00 Register Value (L) in DM3005 00
Number of Resisters (L) 02 Register Value (H)
in DM3006 0A
CRC (H) 56 Register Value (L) in DM3006 BE
CRC (L) 0B CRC (H) 7C
[image:3.595.304.549.262.509.2]CRC (L) E3
[image:3.595.302.549.267.508.2]Fig. 9. Response message including the weighing data from the AD4401.
Fig. 10. Created function block using the proposed concept of Fig. 5.
[image:3.595.46.291.304.485.2] [image:3.595.309.544.537.633.2]Fig. 11. Window for setting parametersof the created function block.
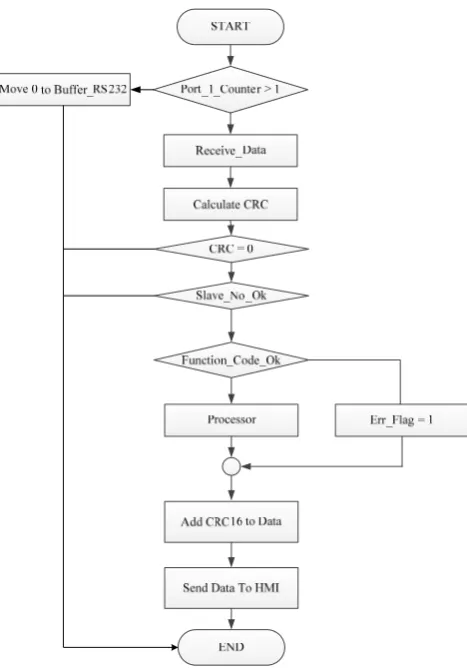
Fig. 12. Flowchart diagram for data transfers between the HMI and PLC.
1.Detect the data transfer at the Port 1.
2.If the data are sent to the Port 1, move the received data to Receive_Data. Otherwise, move 0 to Buffer_RS232, and finish the sequence.
3. Compute the CRC-16, it should be 0.
4.If the computed CRC-16 = 0, then detect the Slave No. 5.Determine the function code, if there is error, then send
Err_Flag.
6.Perform the requested action.
7.Add the computed CRC to the processed data. 8.Send the requested data backward to the master HMI.
From Fig. 13 showing the flowchart diagram for data transfers between the weighing indicator and the PLC, the sequential operations of the created function block can be briefly explained as follows.
1. Move the data using the AD_4401 commands (RW (Request Weight), RS (Request Setpoint), RT (Request Total), and SS (Set Setpoint)) to the resisters.
2. Detect the readiness of the Port 2.
START
Move Data Using Commands (RW, RS, RT, SS) to Registers
Scan Command Port_2_Ready
Send Command To Indicator
Port_2_Counter >1
Receive Data
Address = Slave No
Move Received Data To RW, RS, RT
Convert Data ASCII To Hex
Move Data Hex To Parameter (RW, Final, Free_Fall, Prelim , etc)
END
Timer Delay 2s
Port 2 Error Wait
Fig. 13. Flowchart diagram for data transfers between indicator and PLC.
3. Use the AD_4401 commands for sending the scan data. 4. Send the data to the AD_4401.
5. Detect the data transfer at the Port 2.
6. If the Port 2 has no data received, send Flag_Port2_Error. 7. Otherwise, determine Header Address that is equal to the Slave No.
8. If Header Address = Slave No., then move the received data to save in the resisters RW, RS, and RT.
9. Select only numerical data for converting from ASCII to Hex codes.
10. Move the converted Hex codes to the predefined register for each weighing data.
V. EXPERIMENTAL RESULTS
[image:4.595.52.286.202.537.2]Fig. 14. Experimental setup for overall system.
[image:5.595.64.274.240.401.2]Fig. 15. The Modbus-RTU request in the created function block.
[image:5.595.322.530.247.351.2]Fig. 16. The Modbus-RTU response in the created function block.
Fig. 17. The AD-4401 commands in the PLC registers.
[image:5.595.322.532.385.516.2]Fig. 18. Received data from the AD-4401 indicator.
Fig. 19. Weighing data on local readout of the AD-4401 indicator.
Fig. 20. Weighing data on the HMI station.
From the Modbus-RTU request and response messages as shown in the red frame in Figs. 15 and 16, which are agreed with the fields in Table III, can be classified as follows. The Modbus-RTU Request; (See Fig.15)
Slave Address: 01, Function Code:03, Start Address (H): 0B, Start Address (L): BD, Number of Registers (H): 00, Number of Registers (L): 02, CRC (H): 56, CRC (L): 0B. The Modbus-RTU Response; (See Fig.16)
Slave Address: 01, Function Code:03, Number of Data Bytes: 04, Register Value (H): 6C, Register Value (L): 78, Register Value (H): 00, Register Value (L): 00, CRC (H): 67, CRC (L): 7A.
[image:5.595.64.274.435.588.2] [image:5.595.60.278.614.771.2]Band. From the experimental results shown in Figs. 19 and 20, it is seen that the weighing values on the HMI station are equal to the measured values on the local readout, for example, the weight and accumulated weight values are 4,650 kg and 163,719 kg, respectively.
VI. CONCLUSION
Integration of the weighing indicator with proprietary commands into the PLC-based system for improving real-timemonitoringcapabilityhasbeenproposedinthispaper. The concept to build the new function block located in the PLC for converting commands of the weighing indicator into commands of the Modbus-RTU has been introduced. In order to verify the proposed technique, integrating the AD-4401 weighing indicator, the Omron PLC modeled CP1L0N30DR-D, and the Panel Master touch-screen monitor connected on the RS-485 network has been described. Experimental results confirm that the proposed system functions correctly.
ACKNOWLEDGMENT
The authors would like to thank the S.K. Scale Company Limited, Thailand, for the support in the experimental setup in this research.
REFERENCES
[1] N. Isao and T. Kohashi, “Simplification of structure and improvement of weighing accuracy for multi-hopper,” SICE Annual Conference, pp. 1024-1030, 2008.
[2] B. Nimsiriwangso, S. Kummool, A. Julsereewong, and P. Ukakimaparn, “Automatic weighing machine for improving competitiveness of Thai SMEs in seafood cold storage business,”
IEEE/SICE International Symposium on System Integration, pp. 749-754, 2015.
[3] X. Dong, K. Wang, and K. Zhao, “Design and implementation of an automatic weighing system based on CAN bus,” IEEE/ASME International Conference on Advanced Intelligent Mechatronics, pp.1260-1265, 2008.