provisions of the Copyright Act 1968.
Reproduction of material protected by copyright may be an infringement of copyright and
copyright owners may be entitled to take legal action against persons who infringe their copyright.
Section 51 (2) of the Copyright Act permits an authorized officer of a university library or archives to provide a copy (by communication or otherwise) of an unpublished thesis kept in the library or archives, to a person who satisfies the authorized officer that he or she requires the reproduction for the purposes of research or study.
The Copyright Act grants the creator of a work a number of moral rights, specifically the right of attribution, the right against false attribution and the right of integrity.
You may infringe the author’s moral rights if you: - fail to acknowledge the author of this thesis if
you quote sections from the work - attribute this thesis to another author - subject this thesis to derogatory treatment
which may prejudice the author’s reputation For further information contact the University’s Director of Copyright Services
DATA MINING FOR STUDYING THE IMPACT
OF REFLECTION ON LEARNING
RAJIBUSSALIM, MInfoTech
A thesis submitted in fulfilment of the requirements for the degree of Master of Science
Faculty of Science
University of Sydney
Australia
May 2014
Statement of Originality
This thesis contains no material that has been accepted for the award of any other degree in any university or other institution. To the best of my knowledge, this thesis contains no material previously published or written by another person except where due reference is made in the text of the thesis
Rajibussalim 21 May 2014
Abstract
On-line Web-based education learning systems generate a large amount of students' log data and proles that could be useful for educators and students. Hence, data mining techniques that enable the extraction of hidden and potentially useful information in educational databases have been employed to explore educational data. A new promising area of research called educational data mining (EDM) has emerged.
Reect is a Web-based learning system that supports learning by reection. Re-ection is a process in which individuals explore their experiences in order to gain new understanding and appreciation, and research suggests that reection improves learning. The Reect system has been used at the University of Sydney's School of Information Technology for several years as a source of learning and practice in addi-tion to the classroom teaching. Using the data from a system that promotes reecaddi-tion for learning (such as the Reect system), this thesis focuses on the investigation of how reection helps students in their learning. The main objective is to study stu-dents' learning behaviour associated with positive and negative outcomes (in exams) by utilising data mining techniques to search for previously unknown, potentially useful hidden information in the database.
The approach in this study was, rst, to explore the data by means of statisti-cal analyses. Then, popular data mining algorithms such as the K-means and J48 algorithms were utilised to cluster and classify students according to their learning be-haviours in using Reect. The Apriori algorithm was also employed to nd associations among the data attributes that lead to success. We were able to group and classify students according to their activities in the Reect system, and we identied some activities associated with student performance and learning outcomes (high, moderate or low exam marks). We concluded that the approach resulted in the identication of some learning behaviours that have important impacts on student performance.
I would like to rst acknowledge and thank my wife Indah Sriwindhari and our daugh-ters Aisha Fathiya Izzati and Nazia Hazhatul Husna for their unconditional love, continuous support and encouragement. My special thank goes to my parent, who I can not thank enough for their unlimited support and pray with love for me and family. I greatly appreaciate and thank to my supervisor Dr. Kalina Yacef for all invaluable guidance and support during my candidature. I would also like to thank my associate supervisor Professor Judy Kay who provides me with her insightful comments and advices.
Finally thanks to Dr. William Niu and Anindito Aditomo who gave valuable feed-back in the completion of this thesis and to Greg Darke, Rauddin Palinrungi and Sardad Mohammad Farhad for helping me with the proof reading.
I gratefully acknowledge the Australian Government for providing nancial support for my study.
Contents
Acknowledgements vi
Contents ix
List of Tables x
List of Figures xii
1 Introduction 1
1.1 Background . . . 1
1.2 Motivation and Study Objectives . . . 2
1.3 Research Question . . . 3
1.4 Research Contributions . . . 4
1.5 Thesis Outline . . . 4
2 Educational Data Mining Research 6 2.1 Introduction . . . 6
2.2 Purpose of EDM Research . . . 8
2.3 Overview of EDM Research . . . 8
2.3.1 Types of Data Usedin EDM Research . . . 8
2.3.2 Applications of EDM Methods . . . 10
2.4 Students' Learning Behaviour . . . 20
2.4.1 Factors that May Interfere with Learning Progress . . . 21
2.4.2 Methods to Study Students Learning Behaviour . . . 22
2.5 Extracting Pedagogical Information from EDM Research . . . 23
2.6 Data Mining Techniques Commonly Used in EDM . . . 24
2.6.1 Clustering . . . 25 vii
2.7 Research Gaps . . . 28
2.7.1 Self-Assessment Concept . . . 28
2.7.2 System and Data . . . 29
2.7.3 Methodology . . . 30
2.8 Conclusion . . . 30
3 Learning by Reection in the Reect system 32 3.1 Introduction . . . 32
3.2 Overview of the Reect System . . . 33
3.3 Procedures of Self Assessment in Reect . . . 33
3.3.1 First Stage . . . 34
3.3.2 Second Stage . . . 37
3.3.3 Third Stage . . . 38
3.4 Types of Evidence Recorded in Reect . . . 39
3.4.1 Student Submission (RFLT evidence) . . . 39
3.4.2 Example Solution Evidence . . . 40
3.5 Conclusion . . . 41
4 Research Approach and Methodology 42 4.1 Research Questions and Hypotheses . . . 42
4.2 Subjects and the Data . . . 46
4.2.1 Subjects and Course Context . . . 46
4.2.2 Data Source . . . 46
4.3 Preparing Data for Mining . . . 49
4.3.1 Data Pre-Processing . . . 50
4.3.2 Constructing the Datasets for Experiments . . . 53
4.4 Application of EDM Methods . . . 56
4.4.1 Exploring Data by Statistical Analysis . . . 56
4.4.2 Educational Data Mining Methods . . . 57
4.5 Conclusion . . . 66
5 Results and Discussion 67 5.1 Exploration of the Reect Dataset . . . 67
5.1.1 Statistical Analysis . . . 67
5.1.2 Clustering Analysis . . . 75
5.1.3 Classication Analysis . . . 79
5.1.4 Association Rules Analysis . . . 82
5.2 Exploration of Student Assessment Dataset . . . 86
5.2.1 Statistical Analysis . . . 87
5.2.2 Classication Analysis . . . 88
5.3 Exploration of Combined Dataset . . . 90
5.3.1 Classication Analysis . . . 90
5.3.2 Association Rules Analysis . . . 95
5.4 Conclusion . . . 97
6 Conclusion and Future Work 99 6.1 Conclusions . . . 99
6.2 Study Limitations and Future Work . . . 103
Bibliography 105
2.1 Group clustering results (from [65]) . . . 18
2.2 Group clustering with modied attribute (from [65]) . . . 19
2.3 Students distribution from each cluster (from [65]) . . . 20
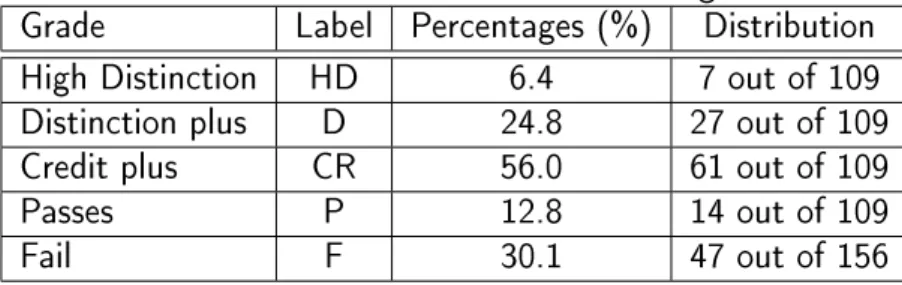
4.1 Distribution of student nal grade . . . 46
4.2 List of attributes in Reect dataset . . . 49
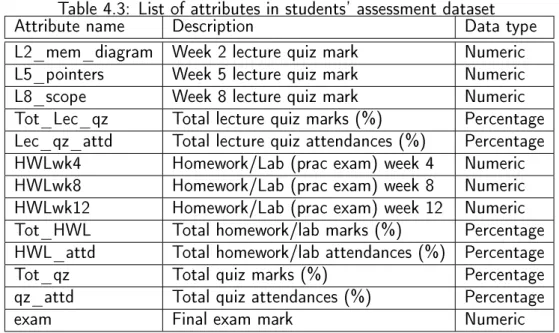
4.3 List of attributes in students' assessment dataset . . . 49
4.4 Source of errors in the Reect data . . . 52
4.5 List of all attributes in the summary dataset . . . 53
4.6 An example of data attributes in numerical form . . . 54
4.7 An example of a numerical dataset with a categorical attribute . . . . 55
4.8 An example of data attributes in categorical form . . . 56
4.9 Set of attributes used in the K-means clustering . . . 59
4.10 List of all attributes used for building a model . . . 64
4.11 Discretised the Reect data attributes . . . 65
4.12 Discretised the students' assessment data attributes . . . 65
5.1 Correlation between the Rt_evd and the exam . . . 71
5.2 Correlation between total self-assessment and exam mark . . . 74
5.3 Summary of cluster variance . . . 77
5.4 The ANOVA test . . . 77
5.5 Groups of students distinguished by example solutions . . . 78
5.6 Descriptive statistics of the attributes . . . 87
5.7 A comparison of various accuracy measurements . . . 94
List of Figures
2.1 K-means algorithm executed in Weka (from [75]) . . . 13
2.2 C.45 algorithm executed in Keel (from [75]) . . . 15
2.3 Apriori algorithm executed in Weka (from [75]) . . . 16
3.1 Features in the Reect system . . . 34
3.2 List of tasks presentation in the Reect system . . . 35
3.3 Student self-assess page in the Reect system . . . 36
3.4 Student self-assess page in the Reect system . . . 36
3.5 Self-assess marking scheme page . . . 38
3.6 Discrepancy page in the Reect system . . . 39
3.7 Example solution page in the Reect System . . . 40
4.1 A screen shot of Reect data in XML format . . . 47
4.2 Diagram of the process of data mining . . . 51
4.3 Ranking of the Reect data attributes in the Gain Ratio . . . 60
4.4 Ranking of the students' assessment data attribute in the Gain Ratio . 62 4.5 Ranking of the combined data attributes in the Gain Ratio . . . 63
5.1 Normal distribution graph of exam . . . 69
5.2 Normal distribution graph of Rt_evd . . . 69
5.3 Scatter plot of Rt_evd . . . 70
5.4 Cumulative percentages of Rt_evd . . . 71
5.5 Normal distribution graph of Tot_selfAssess . . . 73
5.6 Scatter plot of Tot_SelfAssess and the exam . . . 73
5.7 Clustering analysis related to students' submissions . . . 76
5.8 The J48 tree analysis . . . 80
5.9 Visualisation of the tree model . . . 81 xi
0.9 . . . 84
5.12 Association rules with lift correlation analysis . . . 85
5.13 Decision tree built from the students' assessment data . . . 90
5.14 The screen shoot of the best classication model . . . 93
5.15 The best accuracy for the J48 decision tree model . . . 94
5.16 The trend of J48 accuracy per number of attributes selected . . . 95
5.17 Association rules using combined dataset . . . 96
Chapter 1
Introduction
1.1 Background
Learning by reection is considered to be important since learning eectiveness can increase when learners adapt to their learning experiences by reecting on their learning processes and the state of their knowledge [14, 77, 78]. In this thesis, we dene reection as the process in which individuals engage to explore their experiences in order to lead to a new understanding and appreciation [14]. There are many dierent ways that people learn by reection; one of these ways is self-assessment. Boud [13] dened self-assessment as the involvement of students in identifying standards and/or criteria to apply to their work, and making judgment about the extent to which they have met these criteria and standards. Self-assessment is important because it can help students to develop the ability to identify their strengths and weaknesses and focus their study eorts on the particular area they believe needs improvement.
The present study focuses on how the data gathered from an online system that supports learner reection, namely, the Reect system at the University of Sydney, can be explored using educational data mining (EDM) methods. EDM is dened as an emerging discipline, concerned with developing methods for exploring the unique types of data that come from educational settings, and using those methods to better understand students, and the settings which they learn in 1. The study aims to provide
new insights into students' learning behaviours and information that can be useful for teachers and their students. This information is important because unlike teaching in
1http://www.educationaldatamining.org
classroom environments, where educators are able to give and receive direct feedback from students regarding their performance and learning experience, it is dicult for educators to gain this type of information from an online teaching environment. It is even more dicult for educators to continuously evaluate the students' progress and performance. Hence, the application of EDM methods to educational data as demonstrated in this study also represents an attempt to address these issues. The information and knowledge resulting from this study can be useful for teachers to better understand their students' learning behaviours and to inform students if their current behaviour is associated with negative or positive outcomes. The information can also be benecial if presented to students as it enables them to consider how eective their learning habits are against their current performance.
1.2 Motivation and Study Objectives
The objective of EDM research is to provide a deeper understanding of the key factors that impact on learning. One way to achieve this is by investigating students' learning behaviours; in particular, how students perform self-assessment and reect on their learning behaviours in ways that aect the learning outcomes. There is considerable research on students' learning behaviours but there has been little research on the use of EDM techniques to investigate the relationships between reection and learning outcomes. This concern has motivated the undertaking of the present research. In particular, the present research focuses on the identication of students' behaviours related to the use of the Reect system for reective learning that resulted in positive learning outcomes for the students. At the same time, the research investigates how students' performances can be evaluated based on these criteria so that educators can identify students at risk of poor learning outcomes.
This thesis focuses on the use of EDM methods to extract information about how reection helps students in learning by studying data from the Reect system. In particular, the main objective is to evaluate the eectiveness of EDM methods for: (1) gaining knowledge about students' learning behaviours; (2) identifying which be-havioural patterns lead to positive or negative outcomes; and (3) extracting knowledge about the impacts of reection on learning.
1.3. RESEARCH QUESTION 3 including clustering, classication, and association rules mining. The importance of this study is indicated by the conclusion made in a large number of previous studies that reection improves learning.
1.3 Research Question
Based on the study objectives that highlight the importance of reection for learning, the primary research question is dened as follows:
Can mining educational data help to better understand the impact of reection on learning?
Addressing this research question requires theoretical and analytical studies of the applications of EDM methods on the Reect data. The analysis requires the examina-tion of the behaviour of students when learning, in particular when learning by using a system that supports learner reection (i.e., the Reect system) and its impact on their performance.
The primary research question forms the framework for this study. However, this main research question can be restructured to be more specic and focused. Therefore, the research question is translated into more specic subsidiary research question as follows:
Do students learn better by using the Reect system?
In order to address this subsidiary research question, a number of hypotheses are developed as discussed in Chapter 4. The main reason for translating the subsidiary research question into the hypotheses is because a hypothesis can be directly tested; hence, its results can be measured and proved or unproved. The main hypotheses (H1 - H3) are related directly to the use of the Reect system as a means of reection and are tested by using the dataset from the Reect system, while another two hypotheses (H4 and H5) are developed and tested by using the student assessment data from the relevant course coordinator. In order to test these hypotheses, a series of experiments was conducted. The results of the experiments provide answers to the primary research question and its subsidiary research question.
1.4 Research Contributions
Within the scope of the research goals, the contributions of this thesis are as follows:
• The study provides insights and valuable information about how EDM methods
can be used to extract information from the data gathered from a system that supports learner reection.
• The study includes a detailed analysis of the results that lead to the identication
of students' learning behaviours related to the use of the Reect system (three discrete groups of users are identied).
• The study identies the students' learning behaviours in the Reect data that
lead to positive and negative outcomes.
• The study provides analysis about the correlation between the diverse
self-assessments tasks (reective learning) performed in the Reect and the students' performance.
• The results of the study provide some pedagogical knowledge that can be useful
for teachers regarding the learning behaviours associated with positive and neg-ative outcomes; this knowledge can be used by teachers and students to improve study performance.
1.5 Thesis Outline
This thesis is organised in six chapters.Chapter 1 introduced the key concepts of learning by reection, the motivation behind this study and the research objectives. The research question was dened and an overview of the research contributions was presented.
Chapter 2 presents the review of the literature in the area of educational data min-ing. It discusses the issues related to the use of EDM methods to explore educational data.
Chapter 3 discusses the issues related to learning by reection. It presents an overview of the Reect system including how it supports learner reection and its procedures of self-assessment.
1.5. THESIS OUTLINE 5 Chapter 4 describes the research approach and methodology, including the research question and hypotheses, the subject and the data used in the study, the process of data mining and the application of EDM methods to the data.
Chapter 5 presents the results of the empirical studies set up in Chapter 4, fol-lowed by a discussion about the results. Useful information about students' learning behaviours in using the Reect system is presented.
Chapter 6 provides the conclusion of the thesis. The limitations of this study are discussed, and potential areas for future work are recommended.
Educational Data Mining
Research
This chapter provides an overview of educational data mining through a review of prominent work in the EDM research community that is related to and provides a guideline for the work in this thesis. This chapter highlights the positive aspects of the previously published work and identies potential problems that can be addressed in the present research and in future work. This chapter also describes the purpose of EDM research, the types of data used in EDM research (including typical educational systems that generate this data) and the extraction of pedagogical aspects (EDM for studying learning behaviour). The chapter is concluded by a review of the most popular EDM methods and techniques currently in use.
2.1 Introduction
The emergence of computing technology provides educational institutions with new alternatives for the delivery of learning materials to students, reducing the reliance on face-to-face teaching in classrooms. There is a current trend towards the management of teaching and learning activities through the use of online web-based learning systems that are delivered through the Internet [75].
One advantage of online web-based learning systems is their ability to record data about most of the activities done by the students in the system; hence providing detailed learning proles [69] that can be mined. Many institutions that utilise these
2.1. INTRODUCTION 7 systems are able to automatically collect large volumes of students' interaction data. Within the last two decades, researchers have realised that this data can be useful to both educators and students. Thus, data mining techniques that enable the extraction of hidden and potentially useful information in the data have been used on educational data. Popular data mining techniques such as clustering, classication, association rules mining and sequential pattern mining have been applied to the educational data with promising results.
The term of data mining is dened as a step in the overall process of knowledge dis-covery in databases that consists of pre-processing, data mining, and post-processing [89]. Data mining also encompasses the Knowledge Discovery in Database (KDD) technique which is dened as extracting or mining knowledge from large amounts of data [32]. The use of data mining techniques to analyse educational data is a growing area of research as it supports the analysis of learners' behaviours using data acquired from online web-based learning environments [16, 25, 31, 44, 45, 62, 73, 79]. This emerging research area is known as Educational Data Mining (EDM) [33, 52, 69, 75]. As a new research area, the main focus of EDM is exploring the unique types of data that come from educational systems and tools. This is done by developing methods to support students and the educational settings they use1.
The abundance of data but lack of powerful data analysis tools has been described as a data rich but information poor situation. As a result, important decisions are often made based not on the rich information retrieved from a database but on intu-ition of a decision maker. This is because the decision maker does not have or is not capable of extracting rich information or knowledge from the data[33]. Currently, EDM research integrates the interdisciplinary research elds of Statistics and Visualisation, Psychological Education, Knowledge Discovery and Database, Machine Learning, In-formation Science, and Articial Intelligent [38, 69, 75]. The main reason behind the rapid development of EDM research in recent years is due to the availability of enorm-ous amounts of educational data, mostly generated by web-based educational systems, and the urgency for converting such data into useful information and knowledge for decision making [33].
EDM researchers consider this phenomenon as an opportunity to explore data mining models that can predict the future behaviours of learners. This information
can be used to enhance the decision-making process.
2.2 Purpose of EDM Research
Researchers have recently begun to explore the possibilities of applying data mining techniques to educational data. This research has mostly been intended to help edu-cators and tutors to better understand their students' learning behaviour by allowing them to assess the students' performance and track their learning progress [26].
Another goal of EDM research has been to provide insight into the parts of a course structure that need to be revised in order to improve learning. Research of this type is primarily intended to help educators [16, 51, 52, 54, 65, 75]. Other EDM research has been oriented towards the provision of benets for both teachers and their students [38, 36, 70, 69].
The following sections present a review of the research in EDM that serves all of the above purposes.
2.3 Overview of EDM Research
Research in EDM can be categorised according to the types of educational data used for mining and the data mining techniques used to mine the information within these data. This section discusses the types of data that can be used in EDM research and followed by an overview of EDM methods used to mine information from various web-based educational systems.
2.3.1 Types of Data Usedin EDM Research
The data gathered from online web-based educational learning systems and tools comes in dierent formats that are specic to that particular tool. It is certainly possible that the data generated from an educational system is also stored into a database. But the types of data it stored depend on the setting on the database itself because modern databases are capable of storing multiple formats including .dat, .mdl, .text, or log le itself. For example, an educational system may generate data in one of the following forms: a text format, web server log le, or LMS log les [11]. Each of these data formats used in EDM research is briey discussed as follow.
2.3. OVERVIEW OF EDM RESEARCH 9 Text Data
This type of data is characterised by its rich and high-level information.This data is dicult to use for data mining as it requires a considerable amount of time to hand code [11]. Several researchers [21, 43, 49] have employed data mining on this type of data in both LMS and Computer Supported Collaborative Learning (CSCL).
Web Server Log Files
Web server log les contain vast collections of data that are produced when users' access specic web pages [33]. The characteristic of this low-level data that is collected in the server logs is a high level of noise. This noise makes the date dicult to organise and often require intensive coding before the data can be used for mining [11].Various data mining techniques have been employed on this type of data in order to extract useful information from it [39, 41, 57, 90, 91].
LMS Log Files
Learning Management System (LMS) log les require the least amount of hand coding as they keep track of users' login and sessions and also store high level data such as students' grades and messages they have posted in the system [48]. Data from LMS log les has been used by many researchers for data mining [28, 63, 75, 74, 87]. Data from User Models
A user model (UM) or learner model represents the characteristics of a user in the system so the system is able to distinguish each user in the system. To build a UM, a system requires data about the user. This data can be obtained when the user logs into the system or when directly requested of the user. There are dierent types of user data commonly used to build a UM, including the users' characteristics (such as gender, age, marital status and location), users' preferences and interests, the users' knowledge and skills, and the users' behavioural patterns [40].
The present research employs data mining techniques on the data collected by the Reect system. The Reect system uses a user model to capture information about the user. All of the infomation about a user is recorded into his or her user model,
thus enabling the system to monitor the state of the knowledge of the users and their learning progress [36].
This leads to the proposal of the following questions Can the Reect data be mined? and, if so, How dicult is it to do? Previous work has reported that mining the data generated by an online educational system such as LMS or ITS (Intelligent Tutoring System) is challenging [63] and requiring dierent data mining tools and tech-niques depending on the types and granularity of the data. This is made more dicult as the Reect system was not designed to accomodate the data mining applications.
2.3.2 Applications of EDM Methods
Nowadays, enormous amounts of educational data are generated from online web-based educational and e-learning systems. These systems are either used as a supplement to normal classroom teaching methods or as a sole teaching and learning medium for courses such as in distance learning programs. Most EDM researchers have used this data by applying EDM methods to the data generated by an online web-based educational system.
A number of current EDM methods were reviewed by Baker and Yacef [6] in the rst issue of Journal of Educational Data Mining (JEDM) 20092. They identied the two most predominant categories of EDM methods as follows: a category of methods based on viewpoint of Romero and Ventura [69] which consist of:
• Statistics and visualisation
• Web mining, that can be further categorised into:
Clustering, classication, and outlier detection
Association rule mining and sequential pattern mining and Text mining
According to Baker and Yacef [6] the web mining methods listed by Romero and Ventura are quite prominent in contemporary EDM research.
The second predominant category of EDM methods was proposed by Baker [3] as follows:
2.3. OVERVIEW OF EDM RESEARCH 11 • Prediction Classication Regression Density estimation • Clustering • Relationship mining
Association rule mining Correlation mining
Sequential pattern mining Causal data mining
• Distillation of data for human judgement • Discovery with models
Prediction, clustering and relationship mining are quite popular among EDM research-ers while the fourth and the fth categories according to Baker and Yacef [6] are justied by having a prominent place in published EDM research. Examples of re-search into distillation of data for human judgement are [37] and [85]. Examples of discovery with models are [9], [19] and [34].
The EDM methods listed in the rst two categories discussed above have been the most prominent EDM methods used by researchers within the last decade. For example, these EDM methods have been widely applied to educational data gathered from learning management systems, intelligent tutoring system, and online collabor-ation tools. To understand about how these methods have been utilised in EDM research, the key application of the most popular EDM methods is discussed in the following sections.
EDM Methods Applied to LMS Data
A Learning Management System (LMS) is a web-based learning system that oers great exibility in terms of time and space for information exchange in learning and
teaching. There are many types of LMS currently used at educational institutions. One of the most popular and widely accepted LMS is Moodle (Modular Object Oriented Developmental Learning Environment). Moodle has been used by many organisations to produce web-based courses and web sites [58]. Moodle also helps to facilitate information sharing and communication between members of a course and its teachers. The main benet of the Moodle system is that it allows teachers to perform many tasks such as preparing lecture materials and tutorial questions, preparing for assignments, quizzes and exams, and also can be used to set up online collaboration media such as chat rooms, discussion forums and online feedback [58].
Moodle can generate a vast amount of data related to the various activities done by users such as accessing lecture materials or assignments, taking a test, reading questions, browsing the web, writing solutions and many other tasks including com-municating with teachers or other users through a chat room. This kind of information is considered very valuable in the study of how students behave when interacting with the system and to discover the possible relationships between the various tasks carried out in Moodle and the students' nal mark. The right data mining algorithms may be used to discover these relationships as suggested by Mostow [60].
A number of researchers in the EDM eld have utilised the data generated from the Moodle system [7, 68, 75]. Romero et al in [68] and [75] have applied various data mining techniques to mine the data generated by the Moodle system. In [75], data was collected from 438 students across seven courses that used Moodle as an alternative learning source to face-to-face teaching at the University of Cordoba, Spain. These students were chosen because they were among the most active students using Moodle; for example, they used the system to do assignments and quizzes and to communicate in chat rooms and forums. The activity data and the students' exam marks were summarised in a table. This table also summarised the total time each student had spent on each task. To increase interpretation and comprehensibility, a discretisation table was also created. The discretisation table was used to represent the numerical data into separate categories that were easier to understand. For example, the numerical marks and attributes were classied into four intervals, namely, FAIL if the value is < 5, PASS if the value is >5 and <7, GOOD if the value is >7 and <9, and EXCELLENT if the value is >9. All the other attributes were transformed to three equal-width intervals labelled as LOW, MEDIUM and HIGH. The nal data pre-processing step was to convert the data into a suitable format to be used with
2.3. OVERVIEW OF EDM RESEARCH 13 data mining tools. Since this research used Weka, the data was transformed into the attribute relation le format (ARFF). This is an ASCII text le suitable to be used in Weka [89].
Next, the K-means algorithm was used to cluster students from a particular course into dierent groups depending on their activities in Moodle and their nal marks. The course that was chosen to be data mined was 218 (Technical Oce). The K-means algorithm was performed with the value of k (number of clusters) equal to 3. As a result, students were grouped into three clusters in which each group had a dierent characteristic as summarised in Figure 2.1. The clusters of students were named very active students (Cluster 1), active students (cluster 2) and non-active students (cluster 0).
Figure 2.1: K-means algorithm executed in Weka (from [75])
The very active students were characterised by very active involvement with the Moodle system such as a high number of quizzes done and passed (7.1 and 6.4), a low number of failed quizzes (0.7), and a high total number of time spent on assignments, quizzes and forums. Non-active students behaved in the opposite way to the very active students, such as no assignments done (0), very low number of messages read (0.045), very few quizzes done and passed, a high number of failed quizzes (1.54, 1.16 and 0.37 respectively) and low total time spent on assignments, quizzes and forums. The active students' behaviours were in between those two groups.
The researchers argued that this information can be used by teachers or instructors of the course to form study groups for collaborative activities with the students from
dierent behavioural groups or to group new students into the clusters depending on their characteristics [69].
The literature has also reported that classication and association rules mining have been applied to analyse the student data generated by the Moodle system. The classication algorithm (the C4.5 algorithm) [67] was used for classifying students into several groups with equal nal marks depending on their Moodle activities while an Apriori algorithm was implemented to search for association rules over the discretised summarisation table for the course 110 (Projects). As a result, a decision tree was generated (Figure 2.2) with a summary of the number of nodes and the number of leaves on the tree, and the number and the percentage of correctly and incorrectly classied instances. The decision tree revealed the rules that classied students into three categories, namely, FAIL, EXCELLENT and MEDIUM (FAIL, PASS or GOOD). Students were labelled FAIL if they had a low number of passed quizzes, while students who had a high number of passed quizzes were directly labelled EXCELLENT. The rest of the students who earned a medium number of passed quizzes were classied as FAIL, PASS or GOOD depending on other values such as total time spent on assignments, numbers of quizzes, number of quizzes failed, number of assignments, and number of courses .
Researchers concluded that by using the information discovered by these rules, educators can make decisions about Moodle course activities and use the rules for classifying new students.
Meanwhile, the Apriori algorithm that was rst introduced by Agrawal et al. [1, 82] was used to generate association rules mining. The algorithm that is build-in and freely available in Weka was executed with a minimum support of 0.3 and a minimum condence of 0.9 as parameters. As a result, a number of interesting rules were discovered as shown in Figure 2.3. However, several similar rules were also discovered (the rules with the same element in antecedent and consequent but interchanged). Some interesting facts are that some rules revealed relevant information for educational purpose but others formed unexpected relationships. The authors argued that this information can be very useful for educators in making correct decisions about the current students' activities and for monitoring students with learning problems.
Although the Reect system is not a learning management system and does not provide the functionalities for information sharing and communication that an LMS such as Moodle does, it does collect data about the users' interactions that is partially
2.3. OVERVIEW OF EDM RESEARCH 15
Figure 2.2: C.45 algorithm executed in Keel (from [75])
similar to the data collected by the Moodle system. For example, it collects data about students' proles and students' task submissions. In addition, some degree of similarity is found in the approach adopted in the present study and the LMS data pre -processing techniques.
EDM Methods Applied to ITS Data
Nowadays, Intelligent Tutoring Systems (ITSs) are widely employed by many educa-tional institutions such as universities, colleges and schools. This popularity is due to the facts that an ITS can record almost every single click of a user's interaction with the system. The data commonly recorded by an ITS is in the form of log les. This is because the log le is easy to record and oers exibilities in terms of the type of information it can capture . A number of EDM researchers have utilised the data generated from an ITS to conduct their experiments. For example, Feng et al [26] used
Figure 2.3: Apriori algorithm executed in Weka (from [75])
data generated from an ITS system called ASSISTments to evaluate and predict stu-dents' Math prociency compared to a state standardised test. Matthews and Mitrovic [47] also used data generated by an SQL tutor to determine the relationships between the number of constraints seen in an ITS and the number of constraints learnt. Other ITSs that generated educational data and have been used in EDM include: Geometry cognitive tutor ShihKS08 [81], Project LISTEN's reading tutor [59]and [61] and Logic ITA [51] and [52].
However, not all the data gathered from an ITS is mineable. Some data is unable to be mined because the ITS was not designed for data mining purposes in the rst place. ITS log les can be successive in the number of instants (users) and sessions. They can also be very rich in the level of detail . The attributes that make an ITS mineable are multiple grain size, reifying tasks, and timeable [59]. Multiple grain size data supports multiple types of analyses. For example, the duration and frequency of student sessions are among the attributes required to measure the usage of an ITS while the data at individual read word is useful for much ner-grained analyses. Reifying the task means that the data produced by an ITS must be machine-understandable that
2.3. OVERVIEW OF EDM RESEARCH 17 is the data is able to be processed and computed by machines. Timeable means that the data is observable over an interval of time. This is because not all activities are observable in terms of time; for example, a student's reading comprehension process is mental and therefore it is dicult to be observed accurately in terms of the time spent.
The Reect system oers tutoring functionalities that are similar to an ITS. It teaches students programming and provides a number of solutions which students can use to compare their own work. From the Reect system, a student might learn the requirements for being a good programmer, such as what are the better indentation styles, how to write better comments and other similar concepts. However, the more important aspect of ITS research is that it provides insights into how educational data gathered from an ITS is mined.
EDM Methods Applied to Online Web-Based Collaboration Data
The increased use of online collaboration tools and Computer Supported Collaborative Learning (CSCL) within educational institutions has resulted in the availability of a large amount of educational data. Researchers see this as an opportunity to mine the data in search for useful information and knowledge. For example, Perera et al. [65] applied various data mining algorithms such as the K-means, EM clustering and sequential pattern mining algorithm to the data collected by Trac, an online collaboration tool used for a senior software development project course, to distinguish strong students from the weak ones and to search for patterns of leaderships and collaborative work among the team members.
The K-means clustering with the number of clusters set at 3 (k=3) was applied to the students' data both as a group and as individuals. From clustering the groups of students, it was revealed that many attributes had a high correlation. As a result, the manual composite attributes were created. One preferred attribute was chosen over another; for example, how Trac was used and when it was used were favoured over the total activity. The end result, after the new attribute selection, is presented in Table 2.1.
The results suggest that Group 1 behaved very dierently to Groups 2, 3, 4 and 6, consisting of students who frequently used Trac. It indicated that high level activities in Trac such as ticketing and SVN activities, and high events per wiki pages set these
Table 2.1: Group clustering results (from [65]) Clustered groups Distinguishing characteristics
Groups 2, 3, 4 & 6 Moderate events per ticket, Infrequent Trac activity (tickets and SVN), Moderate % of ticket update events, Moderate number of lines added/deleted per Wiki edit Groups 5 & 7 Moderately frequent Trac activity (tickets and SVN), High
edits per Wiki page, Low number of lines added/deleted per Wiki edit, Low number of events per ticket, Low % of ticket update events
Group 1 Very frequent Trac activity (tickets and SVN), High events per Wiki page and per ticket, High Wiki page usage span, High % of ticket update events, High % of ticket accepting events
students apart from the students in the other groups.
In the next analyses, the researchers performed clustering analyses on the students individually. By clustering students individually, more interesting facts were discovered from the data as shown in Table 2.2 and 2.3.
As shown in Table 2.2, the researchers were able to label individual students ac-cording to their activities in the Trac system. For example, a very active student was labelled as a 'Manager' while a less active student was labelled as 'Majority'. In Table 2.3, the researchers demonstrated that some groups could be dierentiated from oth-ers by the absence of a manager, explaining the leadoth-ership problems these group had encountered.
The research also tried to explore more information from the Trac data regarding the timing of an action (event) in relation to other actions (events). The researchers believed that certain sequences of events characterised the better groups from the weaker ones. This information was obtained through the application of sequence pattern mining algorithms to the data from Trac.
According to the authors, some new ndings were discovered through the applica-tions of sequential pattern mining. For example, it was revealed that among the top groups, tickets were used more frequently than the Wiki; while in the weakest group it was the opposite. This might have suggested that the use of the ticketing system referred to the actual work being done as it was more task-oriented than the Wiki. The authors argued that the result was consistent when compared to the behaviour of the strong group leaders who used more tickets than the leaders of the weaker groups.
2.3. OVERVIEW OF EDM RESEARCH 19
Table 2.2: Group clustering with modied attribute (from [65]) Clustered size Distinguishing characteristics Cluster label 8 students High ticketing activity,
Involved in many tickets, High Wiki activity, Involved in many Wiki pages,
Moderate SVN activity
`Managers'
9 students Moderately high ticketing activity, Ticketing occurring on many dierent days, Moderate Wiki activity, Very high SVN activity
`Trac-Oriented Developers'
11 students Low ticketing activity, Low Wiki activity, Low SVN activity
`Loafers' 15 students Moderately low ticketing
activity, Moderately low Wiki activity, Many Wiki events on days which Wiki events occurred, Many SVN events on days which SVN events occurred
`Majority'
The authors also suggested that the top group leaders were less involved in technical work and delegated the tasks properly to other group members, while the leaders of the weaker groups tended to either be involved in a lot of technical work or they used the Wiki more than the tickets.
This work by Perera et al. is directly related to the present thesis in two ways. Firstly, as in this thesis, their subject is the behaviour of the learners (students) in an online web-based learning environment. Secondly, the EDM methods and approach used in the present study have some degree of similarity with the work by Perera et al.; for example, the K-means and decision tree algorithm are also used here to separate a strong group of students from the weak ones.
Table 2.3: Students distribution from each cluster (from [65])
Clustered size Managers Trac-Oriented Developers Loafers Majority
Group 1 *1 3 1 1 Group 2 *1 0 1 3 Group 3 0 1 2 **3 Group 4 *1 3 2 0 Group 5 3 *1 0 3 Group 6 *1 1 3 1 Group 7 *1 0 2 4
2.4 Students' Learning Behaviour
The identication of students learning behaviours, in particular those behaviours that distinguish or characterise students, is important and can reveal important information about the students. This information can be used for monitoring the students' learning progress [79, 34], predicting the learning outcomes and students performances [42, 26] and identifying successful learners [50, 47] and students at risk [8, 20]. Therefore, many EDM studies have focused on this area. One important aspect of students' learning behaviours that recently began to attract more attention is self-regulated learning (SRL). Some recent studies have focused on this area of students' learning behaviours [12, 76, 42, 50]. A number of studies have related SLR to self-assessment [50, 76]. Self-assessment is an importance learning behaviour that can be used to improve students' understanding of concepts and results in the increased chance to achieve a better learning outcome. In the current research, the concept of self-assessment is seen as how students interact and participate in an LMS or ITS. The amount of interaction performed by the students in an educational system (for example viewing concepts, reading and replying to the forum, posting messages, or interacting with other students) is calculated in order to determine the level of self-assessment the students had performed.
The present study views the concept of self-assessment dierently from the existing research. In this study, assessment is viewed as a direct action by students to self-assess their understanding of a learning task directly in the educational system. The students can rate their understanding of a programming concept based on certain criteria set up by the course coordinator such as Very Well, Well Ok or Not at
2.4. STUDENTS' LEARNING BEHAVIOUR 21 all. Hence, the students' self-assessment participation that is used to measure how much self-assessment has been performed by the students (the total self-assessment) is calculated from the number of times the students have rated themselves in the learning educational system. This self-assessment procedure is possible because the present study uses the data from the Reect educational system that supports learner reection. In this regard, the concept of self-assessment in the present study is dierent to the concept of self-assessment of the extant research in EDM. A more detailed discussion about the self-assessment procedures in the Reect system is presented in Chapter 3.
2.4.1 Factors that May Interfere with Learning Progress
A number of studies have indicated that several factors may interfere with learning progress. These factors include but are not limited to: (1) previous background know-ledge of the topic, (2) lack of motivation and engagement in the learning processes, and (3) possible misuse of the system.
Background Knowledge
A number of studies reported that there is a signicant advantage for students who have prior knowledge in a programming language to be successful in their rst year programming courses [29] [15]. One of those studies [15] indicated a positive relation-ship between prior knowledge in Mathematics or Science to the success in computer programming studies. The researchers believed that there is a degree of similarity between the concepts for learning Mathematics and learning a programming language. As a result, a student who had learnt those concepts previously might nd them easier to comprehend and make a better progress in learning other concepts. In contrast, a student who had not learnt the concepts beforehand will require more time to grasp similar concepts.
Lack of Motivation and Engagement
Motivation is the most important component in learning (Bandura, 1986 as in [18]). There is a large body of literature devoted to this topic. In general, motivation is related to the questions about why students engaged, performed and completed certain tasks.
Other researchers [56] have reviewed the six motivational constructs in a traditional face to face classroom. These constructs have not been investigated in an online environment. These six motivational constructs are (a) self-ecacy, (b) locus of control, (c) attributions, (d) goal orientation, (e) intrinsic versus extrinsic motivation, and (f) self-regulation. Researchers have concluded that motivation is considered the most important factor in learning because: it increases individual's energy and activity levels [46], it can direct an individual toward certain goals and achievements [23], it promotes the initiation of certain activities and persistence in those activities [83], and it aects the learning strategies and cognitive processes that individuals employ [24]. Misuse of the System
The progress of learning may also be aected when students misuse the system. The phrase of misuse the system or gaming the system is associated with the behaviour aimed at obtaining correct answers by systematically misusing the software's help and feedback without having to know why the answer was correct [5].
Baker et al. in [5] and [4] indicated that students who frequently misused the system learnt only two thirds as much as other students who did not engage in such behaviour. In their research, Baker at al. also discovered that students who gamed the system had low knowledge in the pre-test and had low overall academic achievement.
2.4.2 Methods to Study Students Learning Behaviour
Common methods to study students' learning behaviour include case studies, surveys and interviews.
Case Study
A case study is an examination of a specic behaviour such as an events, activities, institutions or group of person [55]. Research using case studies allows the researcher to study and evaluate the behaviour and phenomena in its natural environment. A case study can employ multiple sources of evidence gained from various sources including a person, groups or institutions.
Case studies have been used in EDM research to study students' learning behaviour. For example, Pechenizkiy [63] used data mining techniques to study eectiveness
2.5. EXTRACTING PEDAGOGICAL INFORMATION FROM EDM RESEARCH 23 of immediate tailored and elaborated feedback (EF) for students taking an online exam. In that study, the researcher used a small number of participants (73 students). The results suggested that it was dicult for researchers to obtain meaningful results with a set of traditional data mining techniques including clustering, classication and association rules mining even with a small amount of data.
Survey and Interview
The survey approach is a type of research that collects data which aims to capture snapshots of practices and situations at a particular point in time [27]. The advantage of this type of research is its ability to utilise and observe a large number of variables in the target population [27]. Some researchers have utilised this technique to study learning behaviour. For example, Sheard et al conducted a survey to study the impact of web-based learning environments on learning experiences and learning behaviour [80].
2.5 Extracting Pedagogical Information from EDM
Research
One purpose of EDM research is to discover pedagogical aspects of educational data to help educators in decision making [57, 69, 86]. Previous work by Merceron and Yacef [51, 52] utilised various tools and data mining techniques including K-means clustering, hierarchical clustering and association rules mining with a modied version of the Apriori algorithm. The objective of their work was to search for interesting pedagogical information in data generated by Logic-ITA, an ITS used to help students practise logic formal proofs and to inform the teacher of the class progress. This tool was used to collect the interaction data of around 860 students' for a period of four years.
First, association rules mining was used to identify mistakes that often occurred together when students were trying to solve problems. The researchers built a mod-ied version of the Apriori algorithms available in TADA-Ed, a platform that allows visualisation and mining of the educational data [10, 53], in order to nd the rela-tionships in the data. From the students' interactions data in 2004, the researchers discovered that the rst rules indicated if students made the mistake of Rule can be
applied but deduction incorrect while solving an exercise. The authors claimed that this nding was quite similar across the other years (2001 to 2003) and suggested that the information can be used by teachers to review the course materials and ensure certain subtleties in the concepts are explained to students.
Furthermore, the researchers applied two distinct clustering algorithms namely K-means and Hierarchical clustering to identify students with diculties from the inter-action data in Logic-ITA. The K-means algorithm was implemented in TADA-Ed while the Hierarchical clustering for data mining was implemented in the SPSS Clementine system. The clustering analyses generated three clusters of students with diculties: cluster 0 consisted of students who made many mistakes per exercise and did not nish the exercise, cluster 1 contained students who made only a few mistakes and the students who made medium number of mistakes were grouped into cluster 4.
Finally, the researchers used a decision tree algorithm to predict students' exam marks using the dataset from the previous year as a training dataset. The attributes that were chosen were the number of mistakes, number of exercises, diculty of the exercise, number of concepts, and nal marks. A decision tree was built from these attributes. The tree was then used to predict the students' exam marks according to its attributes. The model was then used in the following year to predict the grades obtained by new students in that year. The authors claimed that they had successfully extracted useful pedagogical information that can be used for decision-making by educators. For example, a student needs to do at least two exercises to encourage them to do more and be able to complete the exercises. By successfully completing the two exercise barrier, they were assumed to have grasped important concepts of the topic and were likely to be able to answer the questions related to those concepts in the nal exam. The pedagogical knowledge extracted from that study can be used by teachers to help students improve their performance. The approach taken in that study can be adapted or used as a guideline for the present study.
2.6 Data Mining Techniques Commonly Used in
EDM
The most commonly used data mining techniques in EDM are clustering, classication and association rule mining. By employing these data mining techniques in the area
2.6. DATA MINING TECHNIQUES COMMONLY USED IN EDM 25 of educational data, it is expected that some useful information and knowledge can be extracted from the data. Data mining techniques used for mining educational data can discover information that can be used in formative evaluation, that is, to assist educators to establish a pedagogical basis for making a decision when designing or modifying a course or teaching methodology [69]. Data mining techniques may also be used to predict or trace a student's performance from the data gathered from either a traditional classroom or a web-based educational system. This section presents a general overview of the data mining techniques commonly used in EDM research. The data mining algorithms used in EDM experiments are briey introduced, namely, the K-means algorithm for clustering, the J48 algorithm for classication, and the Apriori algorithm for association rules mining experiments. A more detailed discussion of the algorithms and how they are implemented in the experiments is presented in Chapter 4 regarding the research approach.
2.6.1 Clustering
Clustering, also known as an unsupervised classication, is a process of grouping ob-jects into classes of similar obob-jects so that the obob-jects within a cluster have high similarity but are very dissimilar to the objects in other clusters [22]. In EDM, clus-tering has been used in a number of ways, including: grouping students involved in an online collaboration tool called Trac, in order to identify leadership patterns among students working as a team and to classify students' behaviour associated with positive and negative outcomes [65]; grouping students according to the mistakes they made [53]; discovering and grouping students with diculties [52]; clustering students ac-cording to their response correctness [63]; nding groups of students who have similar learning characteristics; and encouraging group-based collaborative learning to provide incremental learner diagnosis [84].
The present study uses a standard implementation of the K-means algorithm avail-able in the Weka data mining package called SimpleKMeans [30]. The algorithm is chosen for two reasons: it is a well-known and reliable clustering algorithm that is easy to use, and it is freely available in the Weka data mining package. The K-means clustering algorithm works based on a partitioning algorithm that organises the objects of a dataset into a number of specic groups or clusters. It uses a centroid-based technique to create clusters of the objects. The centroid is a central point that can be
dened in various ways such as by the mean or by the medoid. The dierence between two clusters is measured by the distance (Euclidean distance) of its centre points.
The objective in using clustering in the present study is to be able to identify the group of students who used the Reect system the most. In this regard, the nal objective is to investigate whether there are any relationships between the number of activities performed in Reect and the students' nal exam marks. The experiments use the numeric dataset related to student activities in Reect. The dataset is pre-processed and a summary table consisting of four data attributes related to students' activities in Reect is created. The chosen attributes contain information about how students used the Reect system for enhancing their learning experiences; for example, how many times students submitted the tasks or examined the learning objectives set by the tutor in the system, how many times students performed self-assessments, and how many times students submitted correct evidence (called the results from local test evidence). Section 4.4.2 presents the research methodology and discusses the data used for the experiments and the clustering experiments in more detail. The results of the clustering experiments are presented in Section 5.1.2.
2.6.2 Classication
Along with clustering, classication is one of the most frequently studied problems in the area of data mining and machine learning [17, 74]. It involves predicting the value of a (categorical) attribute (the class) by using a model or a classier. A model can be built by using a training dataset and veried by using a test dataset. Within the model, there is a class attribute that will be used to label a newly encountered, still unlabelled pattern (class). A classication technique works in a two-step process, namely, the learning step and the classication itself. In the learning step, a classication model is constructed by using a training dataset, while in the classication step, the model is used to predict the class label for a given dataset [32].
Classication techniques have been widely used in EDM, including: classifying students into dierent groups with equal nal marks depending on their activities carried out in a learning system [75]. In this case the classication task is to classify or group students into three classes (of exam mark) that are high, moderate, and low; discovering that students who read elaborated feedback for a particular question increased their chances of correctly answering related questions and thus increased
2.6. DATA MINING TECHNIQUES COMMONLY USED IN EDM 27 their chance of success in the whole test [63]; and predicting students' exam marks by using a decision tree [52].
The present research uses the decision tree, which is a popular classication tech-nique. A decision tree induction algorithm consists of a greedy algorithm based on the divide and conquer philosophy that constructs a decision tree in a top-down recursive approach. Some of the qualities that create particular decision tree algorithms, such as the widely-used C4.5 algorithm, include the superior stability between precision, speed and interpretability of results. The C4.5 algorithm was invented by J. Ross Quinlan, who had previously invented the ID3 algorithm, the C4.5 predecessor, during the late 1970s and early 1980s. Since the invention of the C4.5 algorithm, it has been considered as a benchmark for many newer classication algorithms [32].
The present study uses the J48 decision tree algorithm that is an Open Source Java implementation of the C4.5 algorithm available in the Weka data mining package. The objective in using the algorithm is to build a model that can be used to predict the exam marks of new students. To build the model, a summary table generated from both the Reect system and the student assessment dataset is used. A further discussion of the J48 implementation and the dataset is presented in Section 4.4.2.
2.6.3 Association Rules Mining
The purpose of association rule mining applied to educational data is to reveal rela-tionships among the attributes in the data. These relarela-tionships among attributes and values are often represented by if-then relationships. An association rule mining al-gorithm is usually intended to nd a combination of items that typically occur together in the data and/or a sequence of items that occur frequently in the database.
Although the application of association rules in e-learning posses a number of draw-backs [28] and measuring its interestingness is dicult and challenging [54, 87], there is a relatively large amount of research in EDM that employs association rules to tackle a number of tasks including: nding interesting association rules so that teachers may improve the performance of a Web-based Educational Adaptive Hypermedia System [72]; helping to measure the interestingness of association rules by using the cosine and added value measures [54]; discovering prediction rules in the AHA! course [71]; nding students' mistakes that often occur together [51, 53, 52]; and searching for important aspects of students' behaviour when working in a group [65].
In order to nd any interesting relationships in the dataset used in the present study, a standard Apriori algorithm available in the Weka data mining package is implemented. Apriori is an algorithm that in a rst step builds frequent item-sets and extract association rules from these frequent item-sets. The algorithm was rst introduced by Agrawal and Srikant in 1994 [1] and since then has become a benchmark for association rule mining research. One of the advantages of the association rules mining technique is that it can predict any attribute, not just the class attribute. It also has the capability to predict the combination of attributes [89].
The Apriori algorithm can generate a lot of rules in the form of IF-THEN relation-ships. However, not all the rules generated by the algorithm are useful or interesting. Therefore, there are certain requirements that can be used to measure which rules are interesting. The commonly used tools to extract the rules are support and condence. The support (coverage) is the number of instances that the algorithm predicted cor-rectly, while the condence (accuracy) is the number of instances that the algorithm predicted correctly as the proportion of the whole instances of the predicted attribute [89]. In this study, these two measurements of the rules interestingness are used to select the rules that were considered interesting. The main objective is to nd any interesting relationships in the dataset that may be useful for teachers and students. A more detailed discussion of the dataset and how the Apriori algorithm was used is presented in Section 4.4.2.
2.7 Research Gaps
After reviewing a number of studies related to the use of data mining techniques to explore educational data, we were able to identify some gaps that can be explored and some dierences that can be compared to our research. This section discusses the dierences and gaps between the extant literature and the present study.
2.7.1 Self-Assessment Concept
Based on the review of the literature presented in Chapter 2, it seen that most EDM research that discussed students' self-assessment dened self-assessment from the number of student activities in either a learning management system (LMS), intelli-gent tutorial system (ITS) or online collaborative tool; for example, how many times
2.7. RESEARCH GAPS 29 students have done quizzes and assignments, sent messages to the forums, and used chat facilities. Self-assessment is rarely dened in the literature as a direct act by students in evaluating themselves, for example by rating themselves as Well, OK or NOT OK in an LMS, ITS or collaborative tool.
In the Reect system, the students are able to assess themselves by rating their understanding of a concept as Very Well, Well, OK or Not at all (more detailed information about this self-assessment is provided in Section 3.3). Each time students rate themselves in the Reect system, a self-assessment task is recorded in the system. The total self-assessment is the sum of the students' self-assessment tasks performed in the Reect system.
In regard to this process, we argue that the self-assessment concept in the Re-ect system is dierent from the self-assessment concept adopted in the current EDM research (as discussed in Section 2.4). The self-assessment performed in Reect is direct, which means the students rate themselves directly in the system, while the current research concept of assessment is indirect. In most research, the self-assessments were calculated and interpreted by researchers from the number of activ-ities done in an educational system such as Moodle.
In this research, direct self-assessment data is used along with other student activity data gathered from the Reect system. Therefore it is more closely aligned with students' perception rather than with system-inferred assessment of student learning.
2.7.2 System and Data
The majority of the current research in EDM utilised data from an LMS such as Moo-dle [42, 74, 87], an ITS such as SQL-Tutor [47] and ASSISTments [88] or an online collaboration tool such as Trac [64, 65]. These systems can record the activities per-formed by students through the system such as submitting quizzes and assignments, viewing tasks, joining discussions and posting messages into forums, but are not specif-ically designed for students to perform self-assessment tasks in which they can rate their understanding of a subject. As a result, past data mining experiments have been performed utilising the students' activity data and not the students' self-assessment data.
The Reect system is dierent from the majority of learning management or in-telligent tutoring systems. The Reect system is dierent because it was designed
to promote learner reection and student self-assessment through a scrutable learner model. For example, in the Reect system, students are able to compare their self-assessment in example solutions with the tutors' self-assessment. They can also view their progress on a graph that shows how close they are getting to the tutors' assessment. The students are also able to submit their solutions to the task that would be recorded as evidence. These facilities are usually not found in the majority of learning manage-ment or intelligent tutoring systems. In this regard, the present research uses complete data attributes that utilise not only the students' activity data but also the real stu-dents' self-assessment data. Indeed, although LMS can be setup so that students self-evaluate their skills, this functionality is embedded at the core of the Reect sys-tem: it enables students to perform their self-assessment directly through the system, linking these to the tasks and learning objectives.
2.7.3 Methodology
Our research approach presented in Chapter 4 follows some of the methods proposed in the literature. For example, the present research follows a pre-processing process introduced in [75] to convert the class label into nominal attributes that can be used for the decision tree classication with the J48 algorithm. However, we then performed the attribute selection process using the Gain Ratio attribute evaluator function from the Weka data mining package. The attribute selection process is intended to select the most useful attributes used in the classication analyses. The classication analyses are then executed in Weka instead of Keel as in the previous research. The nal step conducted in the experiments is to measure the accuracy of the model. The accuracy measurement for each experiment is presented in this thesis. This step was not presented in [75]; hence, there is no information about the accuracy of the model reported in that paper. As a result, the model can not be validated.
2.8 Conclusion
This chapter reviewed the relevant existing work in the educational data mining area. It reviewed some prominent related work in EDM research area. The literature review provided guidelines for the work carried out in this thesis. It identied the positive aspects of the previously published works that can be followed and potential problems
2.8. CONCLUSION 31 that may be addressed in this thesis. For example, the steps in data pre-processing and discretisation are adapted from the previous work by Romero et al. [75]]. The chapter concluded with a discussion of the research gaps that are explored in the present study.
Learning by Reection in the
Reect system
Since the data used in the experiments comes from the Reect system, we briey present an overview of the system and its features. In this chapter, we also describe the process that students follow to do self-assessment in the Reect system. The goal of the discussion in this chapter is to demonstrate and verify that the Reect system supports students to learn by reecting on their learning habits and experiences.
3.1 Introduction
As discussed in chapter 1, self-assessment helps learners to recognise their strengths and weaknesses, hence enabling them to focus on the areas that need improvement. This statement has been support by a large number of studies (i.e. [14, 77, 78]). Furthermore, Kay et al. [36] suggested that there are two key elements of student self-assessment: (1) identication of criteria and standards to be applied to their own work, and (2) evaluation of their work compared to the criteria and standards that have been identied in point 1. In the Reect system, the two key elements of self-assessment are performed by the students through the following tasks:
1
![Figure 2.1: K-means algorithm executed in Weka (from [75])](https://thumb-us.123doks.com/thumbv2/123dok_us/626524.2575348/26.892.170.778.514.788/figure-k-means-algorithm-executed-in-weka-from.webp)
![Figure 2.2: C.45 algorithm executed in Keel (from [75])](https://thumb-us.123doks.com/thumbv2/123dok_us/626524.2575348/28.892.183.766.183.681/figure-c-algorithm-executed-keel.webp)
![Figure 2.3: Apriori algorithm executed in Weka (from [75])](https://thumb-us.123doks.com/thumbv2/123dok_us/626524.2575348/29.892.126.715.185.598/figure-apriori-algorithm-executed-weka.webp)

![Table 2.3: Students distribution from each cluster (from [65])](https://thumb-us.123doks.com/thumbv2/123dok_us/626524.2575348/33.892.133.712.199.397/table-students-distribution-cluster.webp)