IRT-based Aggregation Model of Crowdsourced Pairwise Comparisons
for Evaluating Machine Translations
Naoki Otani1 Toshiaki Nakazawa2 Daisuke Kawahara1 Sadao Kurohashi1 1Graduate School of Informatics, Kyoto University, Yoshida-honmachi, Sakyo-ku, Kyoto, Japan
2Japan Science and Technology Agency, Kawaguchi-shi, Saitama, Japan
[email protected] [email protected] {dk,kuro}@i.kyoto-u.ac.jp
Abstract
Recent work on machine translation has used crowdsourcing to reduce costs of manual eval-uations. However, crowdsourced judgments are often biased and inaccurate. In this pa-per, we present a statistical model that ag-gregates many manual pairwise comparisons to robustly measure a machine translation system’s performance. Our method applies graded response model from item response theory (IRT), which was originally developed for academic tests. We conducted experi-ments on a public dataset from the Workshop on Statistical Machine Translation 2013, and found that our approach resulted in highly in-terpretable estimates and was less affected by noisy judges than previously proposed meth-ods.
1 Introduction
Manual evaluation is a primary means of interpret-ing the performance of machine translation (MT) systems and evaluating the accuracy of automatic evaluation metrics. It is also essential for natural lan-guage processing tasks such as summarization and dialogue systems, where (1) the number of correct outputs is unlimited, and (2) na¨ıve text matching cannot judge the correctness, that is, an evaluator must consider syntactic and semantic information.
Recent work has used crowdsourcing to reduce costs of manual evaluations. However, the judg-ments of crowd workers are often noisy and unre-liable because they are not experts.
To maintain quality, evaluation tasks imple-mented using crowdsourcing should be simple.
Thus, many previous studies focused on pairwise comparisons instead of absolute evaluations. The same task is given to multiple workers, and their re-sponses are aggregated to obtain a reliable answer.
We must, therefore, develop methods that ro-bustly estimate the MT performance based on many pairwise comparisons.
Some aggregation methods have been proposed for MT competitions hosted by the Workshop on Statistical Machine Translation (WMT) (Bojar et al., 2013; Hopkins and May, 2013; Sakaguchi et al., 2014), where a ranking of the submitted systems is produced by aggregating many manual judgments of pairwise comparisons of system outputs.
However, existing methods do not consider the following important issues.
Interpretability of the estimates: For the purpose
of evaluation, their results must be interpretable so that we could use the results to improve MT systems and the next MT evaluation campaigns. Existing methods, however, only yield system-level scores.
Judge sensitivity: Some judges can examine the
quality of translations with consistent standards, but others cannot (Graham et al., 2015). Sensitivities to the translation quality and judges’ own standards are important factors.
Evaluation of a newly submitted system:
Pre-vious approaches considered all pairwise combina-tions of systems and must compare a newly sub-mitted system with all the subsub-mitted systems. This made it difficult to allow participants to submit their systems after starting the evaluation step.
To address these issues, we use a model from
item response theory (IRT). This theory was origi-nally developed for psychometrics, and has applica-tions to academic tests. IRT models are highly in-terpretable and are supported by theoretical and em-pirical studies. For example, we can estimate the informativeness of a question in a test based on the responses of examinees.
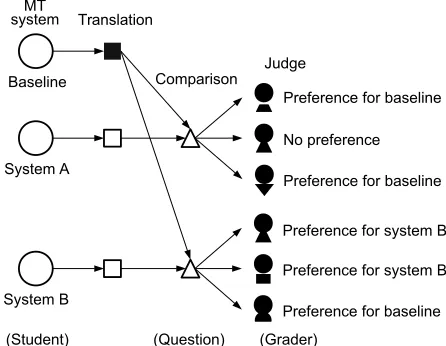
We focused on aggregating many pairwise com-parisons with a baseline translation so that we could use the analogy of standard academic tests. Figure 1 shows our problem setting. Each system of inter-est yields translations, and the translations are com-pared with a baseline translation by multiple human judges. Each judge produces a preference judgment. The pairwise comparisons correspond to ques-tions in academic tests, a judge’s sensitivity to the translation quality is mapped to discrimination of questions, and the relative difficulty of winning the pairwise comparison is mapped to the difficulty of questions. MT systems correspond to students that take academic tests, and IRT models can be naturally applied to estimate the latent performance (ability) of MT systems (students).
Additionally, our approach, fixing baseline trans-lations, can easily evaluate a newly submitted sys-tem. We only need to compare the new system with the baseline instead of testing all pairwise combina-tions of the submitted systems.
Our contributions are summarized as follows.1 1. We propose an IRT-based aggregation model of
pairwise comparisons with highly interpretable parameters.
2. We simulated noisy judges on the WMT13 dataset and demonstrated that our model is less affected by the noisy judges than previously proposed methods.
2 Related Work
The WMT shared tasks have collected many manual judgments of segment-level pairwise comparisons and used them to produce system-level rankings for MT tasks. Various methods has been proposed to ag-gregate the judgments to produce reliable rankings.
1We also show that our method accurately replicated the
[image:2.612.314.537.58.231.2]WMT13 official system scores using a few comparisons. How-ever, this is not the main focus of this paper.
Figure 1:Illustration of manual pairwise comparison.
Each system yields translations. Judges compare them with a baseline translation and report their preferences. Our goal is to aggregate the judgments to determine the performance of each system.
Frequency based approaches were used to pro-duce the WMT13 official rankings (Bojar et al., 2013), considering statistical significance of the re-sults (Koehn, 2012).
Hopkins and May (2013) noted that we should consider the relative matchup difficulty, and pro-posed a statistical aggregation model. Their model assumes that the quality of each system can be rep-resented by a Gaussian distribution.
Sakaguchi et al. (2014) applied TrueSkill (Her-brich et al., 2006) to reduce the number of compar-isons to reach the final estimate based on an active learning strategy. The same model was recently used for grammatical error correction (Grundkiewicz et al., 2015; Napoles et al., 2015).
These methods acquire the final system-level scores, whereas our model also estimates segment specific and judge specific parameters.
The Bradley–Terry (BT) model was the result of a seminal study on aggregating pairwise compar-isons (Bradley and Terry, 1952; Chen et al., 2013; Dras, 2015). Recently, Chen et al. (2013) explic-itly incorporated the quality of judges into the BT model, and applied it to quality control in crowd-sourcing.
Our approach, however, only uses comparisons with a fixed baseline. This approach enables to apply IRT models for academic tests and makes it easy to eval-uate a newly submitted system.
The work most relevant to our model is the IRT-based crowdsourcing model proposed by Baba and Kashima (2013). Their goal was to estimate the true quality of artifacts such as design works based on ratings assigned by reviewers. They also applied a graded response model to incorporate the authors’ latent abilities and the reviewers’ biases.
Yet their setting differs from ours in that they fo-cused on the quality of the artifacts, whereas we are interested in the authors. Additionally, their model maps task difficulty and review bias to a difficulty parameter in IRT. However, we naturally extended the model so that standard analysis approaches can be applied to maintain interpretability.
Some studies have focused on absolute evalua-tions (Goto et al., 2014; Graham et al., 2015). Gra-ham et al. (2015) gathered continuous scale evalu-ations in terms of adequacy and fluency for many segments, and filtered out noisy judgments based on their consistency. The proposed pipeline results in very accurate evaluations, but 40-50% of all the judgments were filtered out due to inconsistencies. This explains the difficulties of developing absolute evaluation methods in crowdsourcing.
3 Problem Setting
We first describe the problem setting, as shown in Figure 1.
Assume that there are a group of systems I
in-dexed byi, a set of segmentsJ indexed byj, and a
set of judgesKindexed byk.
Before a manual evaluation, we fix an arbitrary baseline system and use it to translate the segments
J. Then, each system i ∈ I produces a transla-tion on segment j ∈ J. One of the judgesk ∈ K
compares it with the baseline translation. The judge produces a preference judgment.
Letui,j,k be the observed judgment that judgek
assigns to a translation by system i on segmentj, that is,
ui,j,k =
1 (preference for baseline) 2 (no preference)
3 (preference for systemi)
,
3 2 1 0 1 2 3
Latent performance of systems 0.0
0.2 0.4 0.6 0.8 1.0
Generative probability of judgment
[image:3.612.318.535.63.185.2]lose tie win
Figure 2:ICC of graded response model for(b1, b2) = (−0.5,0.5)anda= 1.7
and letc∈ {1,2,3}be the judgment label.
Each systemihas its own latent performanceθi ∈ R. Our goal is to estimateθby using the observed
judgmentsU ={ui,j,k}i∈I,j∈J,k∈K. 4 Generative Judgment Model
We describe a statistical model for pairwise compar-isons based on an IRT model.
4.1 Modified Graded Response Model
Based on the graded response model (GRM) pro-posed by Samejima (1968), we define a generative model of judgments. GRM deals with responses on ordered categories including ratings such as A+, A, B+ and B, and partial credits in tests. In our prob-lem setting, judgments can be seen as partial credits. When a system beats a baseline translation, the sys-tem receivesc = 3credit. In the case of a tie, the
system receivesc = 2credit. The system receives
c= 1credit when it lose to the baseline. Let P∗
jkc(θi) be the probability that judge k
as-signs judgmentπ > cto a comparison on segmentj
between systemiand a baseline.
P∗
jkc(θi) =
1
1 +exp(−ak(θi−bjc)),
where P∗
jk0(θi) = 1,Pjk∗ 3(θi) = 0. Parametersaand
bare calleddiscriminationanddifficultyparameters,
respectively.arepresents the discriminablity or
sen-sitivity of the judge, and b represents a
segment-specific difficulty parameter. The discrimination pa-rameter (a) is positive, and the difficulty parameter
corresponds to the difficulty of beating the baseline (c >2).
The generative probability of judgment ui,j,k is
defined as the difference in the probabilities defined above, that is,
Pjkc(θi) =P(ui,j,k =c|θi, bj, ak)
=P∗jkc−1(θi)−P∗jkc(θi).
This function is called item characteristic curve
(ICC). Figure 2 illustrates the ICC in the GRM. The horizontal axis represents the latent performance of systems, and the vertical axis represents the genera-tive probability of the judgments. This figure shows, for example, that the probability of the system with
θ= 0beating the baseline is 0.3, whereas the system
withθ = 1.0is much more likely to win. The
dis-crimination parameter controls slope of the curves. If a is small, the probability drops a little when θ
decreased.
The model described above is different from the original GRM, which assumed that the values of a
are independent from question to question, and that each abelongs to exactly one question. However,
in our problem setting, the judges evaluate multiple segments, and discrimination parameter a is
inde-pendent from segmentj. This modification means
that the GRM can capture the judge’s sensitivity.
4.2 Priors
We assign prior distributions to the parameters to obtain estimates stably. We assume Gaussian dis-tributions on θ and b, that is, θ ∼ N(0, τ2) and
bc ∼ N(µbc, σ2bc) (c = 1,2). The discrimination
parameter is positive, so we assume a log Gaussian distribution on a, i.e., log(a) ∼ N(µa, σ2a). Note
thatτ, µ, andσare hyper parameters.
5 Parameter Estimation
We find the values of the parameters to maximize the log likelihood based on obtained judgmentsU:
L(θ, ξ) =logP(U, θ, ξ).
We denote the parameters a = {ak}k∈K andb =
{bj1, bj2}j∈J to beξin this section.
5.1 Marginal Likelihood Maximization of Judge Sensitivity and Matchup Difficulty
Estimates are known to be inaccurate when all the parameters are optimized at once, so we first esti-mate the parametersξto maximize the marginal log
likelihood w.r.t. the system performanceθ.
mL(ξ) =logP(U, ξ) =X
i∈I log
Z ∞
−∞
P(θ)P(Ui|θ, ξ)dθ+logP(ξ),
whereUiis the set of judgments given to systemi
The equation above can be approximated using Gauss-Hermite quadrature, i.e.,
mL(ξ)≈X
i∈I
log
T
X
t=1
1
√πwtP(Ui|τ xt, ξ) +logP(ξ)
wt= 2
T−1T!√π
T2(H(x
t))2
H(xt) =
2xt−
d dxt
T−1
·1,
where a practically good approximation is obtained by takingT ≈20.2
We solve the optimization problem using the gra-dient descent methods to maximize the approxi-mated marginal likelihood. The inequality con-straints on the parameters are handled by adding log barrier functions to the objective function.
5.2 Maximum A Posteriori (MAP) Estimation of System Performance
Given the estimates ofξ, we estimate the system
per-formanceθ={θi}i∈I by using MAP estimation. We maximize the objective function,
L(θ) =logP(U, θ;ξ) =X
i∈I
logP(θi) +
X
i∈I
logP(Ui|θi;ξ).
The estimates ofθare obtained using the gradient
descent method.
5.3 Discussion
So far we have assumed that the estimate is based on batch learning. However, it is known that active
learning can reduce the costs (i.e., the total number of comparisons) (Sakaguchi et al., 2014).
To extend our model to the active learning frame-work, one approach is to optimize the objective function online and actively select the next system to be compared based on criteria such as the uncer-tainty of the system’s performance. We can apply stochastic gradient descent to the online optimiza-tion, which updates the estimates of the parame-ters using the gradients calculated based on a single comparison. This modification was left for future work.
6 Experiments
We conducted experiments on the WMT13 man-ual evaluation dataset for 10 language pairs.3 For details of the evaluation data, see the overview of WMT13 (Bojar et al., 2013).
6.1 Setup
Models: Our method(GRM)was initialized using
a = 1.7, b = (−0.5,0.5), and a θ value derived
by summing up the judgments for each system and scalingθ to fit the prior distribution. For the hyper
parameters, we set τ = √2, µa = log(1.7), σa =
1.0, µb = (−0.5,0.5), σb = 2.0.
To compare with our method, we trained Ex-pectedWins (EW) (Bojar et al., 2013), the model by Hopkins and May (2013), (HM) and the two-stage crowdsourcing model proposed by Baba and Kashima (2013) (TSt). We also trained TrueSkill
(TS) (Sakaguchi et al., 2014), which was used to produce the gold score on this experiment.
We followed Sakaguchi et al. (2014), who also used the WMT13 datasets in their experiments, and initialized the HM and TS parameters. For TSt, we followed Baba and Kashima (2013).
Pairwise comparisons: The WMT dataset
con-tains five-way partial rankings, so we converted the five-way partial rankings into pairwise comparisons. For example, given a five-way partial ranking A>
B >C > D> E, we obtain ten pairwise compar-isons A>B, A>C, A>D,· · ·, and D >E. We
randomly sampled 800, 1,600, 3,200 and 6,400 pair-wise comparisons from the whole dataset.
3http://statmt.org/wmt13/results.html
The training data differs between the models. For GRM and TSt, we first sampled five-way rankings that contained a baseline translation for each base-line system and obtained pairwise comparisons. For EW and HM, we first converted five-way rankings into pairwise comparisons and selected them at ran-dom.4 TS first receives all the pairwise compar-isons and selects the training data based on the active learning strategy, whereas we sampled the compar-isons before running the other methods.
Gold scores: We followed the official evaluation
procedure of the WMT14-15 (Bojar et al., 2014; Bo-jar et al., 2015) and made gold scores with TS. We produced 1,000 bootstrap-resampled datasets over all of the available comparisons. We then ran TS and collected the system scores. The gold score is the mean of the scores.
Evaluation metrics: We evaluated the models
us-ing the Pearson correlation coefficient and the nor-malized discounted cumulative gain (nDCG), com-paring the estimated scores and gold scores. We used nDCG because we are often interested in ranks and scores, especially in MT competitions such as the WMT translation task.5 These metrics were also used for experiments in Baba and Kashima (2013).
6.2 Results
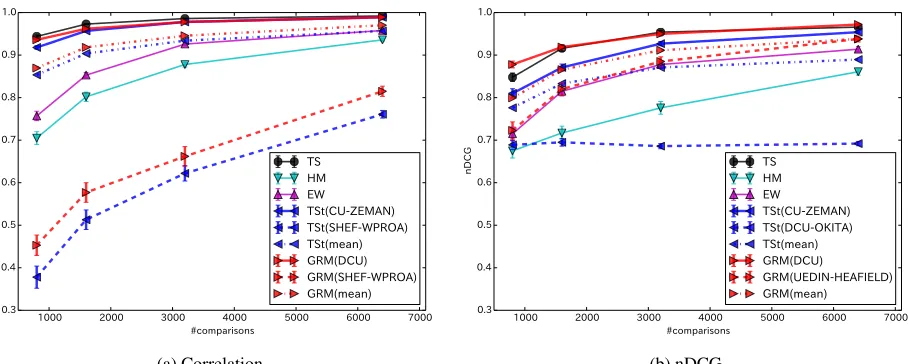
Figure 3 shows the correlation and nDCG between the estimated system performance and the gold scores for the WMT13 Spanish–English task. For the GRM and TSt, the baselines used in the eval-uation are shown in parentheses in the labels. The other language pairs showed similar tendencies. The complete results for all language pairs can be found in the supplementary data files.
Note that the main contribution of our method is not to perform better than other methods in terms of correlation and nDCG to the gold scores, but to re-sult in highly interpretable and robust estimates dis-cussed later.
TS resulted in the highest correlation and nDCG. It is reasonable because the gold scores themselves were produced by TS, and because it estimates the
4We also applied the sampling procedure of GRM and TSt
to EW and HM, but it made their estimation inaccurate.
5We did not use Spearman’s rank correlation coefficient
1000 2000 3000 4000 5000 6000 7000 #comparisons
0.3 0.4 0.5 0.6 0.7 0.8 0.9 1.0
Corr. TS
HM EW
TSt(CU-ZEMAN) TSt(SHEF-WPROA) TSt(mean) GRM(DCU) GRM(SHEF-WPROA) GRM(mean)
(a) Correlation
1000 2000 3000 4000 5000 6000 7000 #comparisons
0.3 0.4 0.5 0.6 0.7 0.8 0.9 1.0
nDCG TS
HM EW
TSt(CU-ZEMAN) TSt(DCU-OKITA) TSt(mean) GRM(DCU)
GRM(UEDIN-HEAFIELD) GRM(mean)
(b) nDCG
Figure 3:Correlation and nDCG comparing the estimated system performance and gold scores with the number
of comparisons for the WMT13 Spanish–English task. The baseline system is shown in parenthesis for TSt and
GRM.
parameters using active learning, unlike the other models.
The GRM with the best baseline system (DCU) achieved almost the same scores as the TS, in terms of correlation and nDCG. Although the TSt with the best baseline resulted in accurate estimates in terms of correlation, it did not in terms of nDCG. With the worst baselines, the GRM and TSt both failed to replicate the gold scores, but the GRM was sur-prisingly accurate in terms of nDCG (even in the worst case). This implies that the GRM can effec-tively predict the top ranked systems.
6.3 Baseline Selection
It is likely that single pairwise comparisons do not work well if the baseline is very strong or weak. As shown in Figure 3, the baseline system influences the final result. When we used SHEF-WPROA as baseline, the estimated system performance was not accurate. This is because SHEF-WPROA loses 69.4% of the pairwise comparisons and fails to dis-criminate between the other systems. In contrast, DCU loses 34.5% and win 34.8% of the compar-isons and discriminate the other systems success-fully. Thus, when we used DCU as baseline, the best correlation and nDCG were achieved. Therefore, we must determine the appropriate baseline system be-fore the comparisons.
One possible solution is to consider the
system-Noise(%) 0 10 20 30 40 50
Correlation
GRM .929 .917 .900 .879 .849 .807
HM +.002 -.005 -.009 -.015 -.025 -.038
EW -.025 -.028 -.035 -.038 -.040 -.046
nDCG
GRM .883 .867 .847 .822 .793 .752
HM -.024 -.130 -.137 -.144 -.152 -.168
[image:6.612.86.540.69.251.2]EW -.035 -.054 -.064 -.060 -.060 -.069
Table 1:Correlation and nDCG between the estimated system performance and gold scores for the WMT13
Spanish–English task, based on noisy judges.The
val-ues were averaged over all the datasets. The GRM scores were averaged over all baselines. The differences from the GRM are reported for the HM and EW.
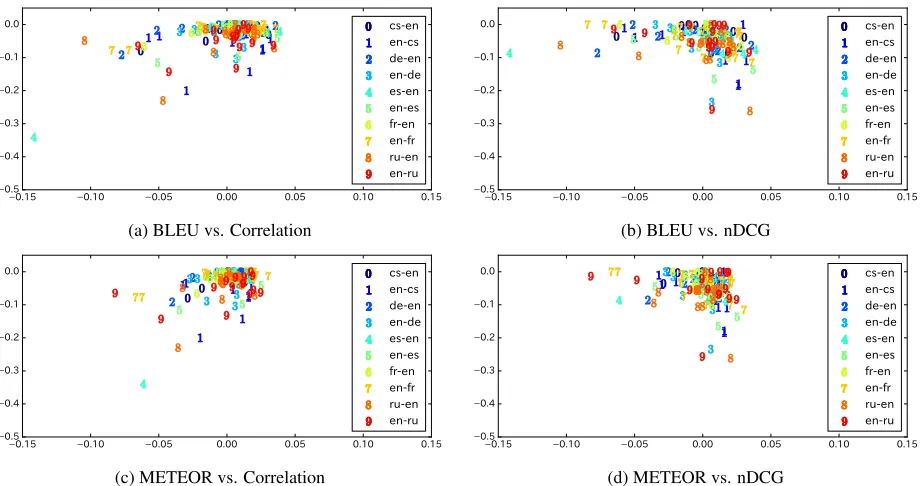
level scores yielded by automatic evaluation metrics such as BLEU and METEOR. Figure 4 shows that we obtained relatively good results when we used a system whose system-level BLEU score and ME-TEOR score6were close to the mean of all the sys-tems.7
6.4 Analysis of Judge Sensitivity
To investigate the robustness of the GRM, we sim-ulated “noisy” judges. We selected a subset of
6BLEU and METEOR scores were given by the WMT13
organizers.
7The system-level scores can be found in the WMT13
0.15 0.10 0.05 0.00 0.05 0.10 0.15 0.5 0.4 0.3 0.2 0.1 0.0 cs-en en-cs de-en en-de es-en en-es fr-en en-fr ru-en en-ru
(a) BLEU vs. Correlation
0.15 0.10 0.05 0.00 0.05 0.10 0.15
0.5 0.4 0.3 0.2 0.1 0.0 cs-en en-cs de-en en-de es-en en-es fr-en en-fr ru-en en-ru
(b) BLEU vs. nDCG
0.15 0.10 0.05 0.00 0.05 0.10 0.15
0.5 0.4 0.3 0.2 0.1 0.0 cs-en en-cs de-en en-de es-en en-es fr-en en-fr ru-en en-ru
(c) METEOR vs. Correlation
0.15 0.10 0.05 0.00 0.05 0.10 0.15
0.5 0.4 0.3 0.2 0.1 0.0 cs-en en-cs de-en en-de es-en en-es fr-en en-fr ru-en en-ru
[image:7.612.81.541.69.312.2](d) METEOR vs. nDCG
Figure 4:Relationship between system-level BLEU/METEOR scores (horizontal) and correlation/nDCG scores
(vertical).The mean BLEU/METEOR was set to zero, and the best score was set to zero for each language pair.
judges and randomly changed their decisions based on a uniform distribution. The percentage of noisy judges varied between 10% and 50% (in increments of 10%).
We trained HM and EW on the simulated datasets. We excluded TS because it assumes that we can ac-tively request more comparisons from judges when their decisions are ambiguous.
As shown in Table 1, the accuracy of the GRM was less affected by the noisy judges than HM and EW. This is because our model estimates judge-specific sensitivities and automatically reduces the influence of the noisy judges.
6.5 Analysis of the Interpretability of the Estimated Matchup Difficulty
Our model is a natural extension of the GRM Same-jima (1968), so we can apply standard analyses for IRT models. Item information is one of the standard analysis methods and corresponds to sensitivity to a latent parameter of interest. Based on the item infor-mation, we can find which segment was difficult to be translated better than a baseline translation.
The item information is calculated using the
esti-1.0 0.5 0.0 0.5 1.0
[image:7.612.320.536.355.468.2]θ 0.50 0.55 0.60 0.65 0.70 0.75 0.80 0.85 0.90 Item information 0.13 -0.11 1858 1818
Figure 5: Item information for the WMT13 Spanish–
English task.The DCU was used as a baseline. We used
the averaged estimates ofbon 100 sampled datasets with 6,400 comparisons to calculate the item information for all segments.
mated parametersξ(Samejima, 1968), that is,
Ij(θ) =−E
∂2L(θ;ξ)
∂θ2 = 3 X c=1 " −∂ 2logP
jkc(θ)
∂θ2 # Pjkc = 3 X c=1
[P∗jkc0 −1(θ)−P∗jkc0 (θ)]2
P∗
jkc−1(θ)−P∗jkc(θ) ,
where P∗0 =∂P∗/∂θ.
Segment 1858: Difficult to beat the baseline translation.
Source Hasta 2007 los dos telescopios Keck situados en el volc´an hawaiano de Mauna Kea eran considerados los m´as grandes del mundo.
Reference Until 2007, the two Keck telescopes at the Hawaiian volcano, Mauna Kea, were the largest in the world.
DCU[baseline] Until 2007, the two Keck telescopes located on the Hawaiian volcano Mauna of KEA were considered the largest in the world.
ONLINE-B (θ=)0.24 Until 2007 the two Keck telescopes located on the Hawaiian volcano Mauna Kea were considered the largest in the world.
UEDIN 0.12 Until 2007, the two Keck telescopes located on the Hawaiian volcano of Mauna Kea were considered the largest in the world.
LIMSI-NCODE-SOUL 0.10 Until 2007 the two Keck telescopes in the Hawaiian Mauna Kea volcano were consid-ered the largest in the world.
CU-ZEMAN -0.10 Until 2007, the two Keck telescope located in the volcano Mauna Kea hawaiano of were regarded as the world’s largest.
JHU -0.12 Until 2007, the two Telescope Keck located in the Kea volcano hawaiano of Mauna were considered the world’s largest.
SHEF-WPROA -0.92 Until 2007 the two telescope Keck located volcano hawaiano of Mauna KEA were re-garded larger of world.
Segment 1818: Easy to beat the baseline translation.
Source Dependiendo de las tonalidades, algunas im´agenes de galaxias espirales se convierten en verdaderas obras de arte.
Reference Depending on the colouring, photographs of spiral galaxies can become genuine works of art.
DCU[baseline] Depending on the drink, some images of galaxias galaxies become true works of art. ONLINE-B 0.24 Depending on the shades, some images of spiral galaxies become true works of art.
UEDIN 0.12 (Same as ONLINE-B)
[image:8.612.77.539.72.280.2]LIMSI-NCODE-SOUL 0.10 Depending on the color, some images of galaxies spirals become real works of art. CU-ZEMAN -0.10 Depending on the tonalidades, some images of spirals galaxies become true works of art. JHU -0.12 Depending on the tonalidades, some images of galaxies spirals become true works of art. SHEF-WPROA -0.92 Depending on the tonalidades, some images of galaxies spirals become real artwork. Table 2: Translation examples for the WMT13 Spanish–English task.The reference is a correct translation given by the WMT organizers and was shown to human judges. Estimates ofθ(averaged over 100 sampled datasets with 6,400 comparisons) are also reported in the table.
by segments and is independent of the judges, we set
ak= 1 (k∈ K).
Figure 5 gives two examples of the item infor-mation. The horizontal axis corresponds to the sys-tem performanceθ, and the vertical axis represents
the informativeness of a segment. This figure in-dicates that segment 1858 (red line) can effectively discriminate systems with θ ≈ 0.13, whereas
seg-ment 1818 (blue dashed line) is sensitive to those withθ≈ −0.11. This means that systems with low
θ tend to lose to a baseline translation on segment
1858, and the segment does not tell meaningful in-formation on performance of the systems. However, they sometimes beat a baseline translation on seg-ment 1818, and the segseg-ment can measure their per-formance accurately.
Table 2 shows translations for segments 1858 and 1818. We found that the baseline translation on seg-ment 1818 was relatively good, whereas the baseline translation on segment 1858 contained wrong words such as “drink” and “galaxias”. Consequently, sys-tems with low θ tended to lose to the baseline on
segment 1858 due to their wrong translation (see the translation of “hawaiano de Mauna Kea”). In con-trast, some of the low-ranked systems beat the base-line on segment 1818, and the segment contributed to discriminate them.
7 Conclusion
We have addressed the task of manual judgment ag-gregation for MT evaluations. Our motivation was three folded: (1) to incorporate a judge’s sensitivity to robustly measure a system’s performance, (2) to maintain highly interpretable estimates, and (3) to handle with a newly submitted system.
To tackle these problems, we focused on pairwise comparisons with a fixed baseline translation so that we could apply the GRM model in IRT by using the analogy of standard academic tests. Unlike testing all pairwise combinations of systems, fixing base-line translations makes it easy to evaluate a newly submitted system. We demonstrated that our model gave robust and highly interpretable estimates on the WMT13 datasets.
In the future work, we will incorporate active learning to the proposed method so that we could reduce the total number of comparisons to obtain fi-nal results. Although we evaluated the correlation between the estimated system performance scores and the WMT official scores, other evaluation pro-cedures might also be considered. For example, Hopkins and May (2013) considered model perplex-ity and Sakaguchi et al. (2014) compared accuracy. However, we cannot directly compare other meth-ods to our method in terms of perplexity or accuracy because our method focuses on comparisons with a baseline translation, whereas they do not. It will be required to investigate correlation between the esti-mates and expert decisions.
Acknowledgments
We would like to thank Yukino Baba and Hisashi Kashima for providing an implementation of their method. We are also thankful for the useful com-ments from the anonymous reviewers.
References
Yukino Baba and Hisashi Kashima. 2013. Statistical quality estimation for general crowdsourcing tasks. In
Proceedings of the 19th ACM SIGKDD International Conference on Knowledge Discovery and Data Min-ing (KDD), pages 554–562, New York, USA, August. ACM Press.
Ondˇrej Bojar, Christian Buck, Chris Callison-Burch, Christian Federmann, Barry Haddow, Philipp Koehn,
Christof Monz, Matt Post, Radu Soricut, and Lucia Specia. 2013. Findings of the 2013 workshop on statistical machine translation. InProceedings of the Eighth Workshop on Statistical Machine Translation (WMT), pages 1–44, Sofia, Bulgaria, August. Associ-ation for ComputAssoci-ational Linguistics.
Ondˇrej Bojar, Christian Buck, Christian Federmann, Barry Haddow, Philipp Koehn, Johannes Leveling, Christof Monz, Pavel Pecina, Matt Post, Herve Saint-Amand, Radu Soricut, Lucia Specia, and Aleˇs Tam-chyna. 2014. Findings of the 2014 workshop on statis-tical machine translation. InProceedings of the Ninth Workshop on Statistical Machine Translation (WMT), pages 12–58, Baltimore, Maryland, USA, June. Asso-ciation for Computational Linguistics.
Ondˇrej Bojar, Rajen Chatterjee, Christian Federmann, Barry Haddow, Matthias Huck, Chris Hokamp, Philipp Koehn, Varvara Logacheva, Christof Monz, Matteo Negri, Matt Post, Carolina Scarton, Lucia Specia, and Marco Turchi. 2015. Findings of the 2015 workshop on statistical machine translation. InProceedings of the Tenth Workshop on Statistical Machine Translation (WMT), pages 1–46, Lisbon, Portugal, September. As-sociation for Computational Linguistics.
Ralph Allan Bradley and Milton E Terry. 1952. Rank analysis of incomplete block designs: I. the method of paired comparisons. Biometrika, 39(3-4):324–345. Xi Chen, Paul N. Bennett, Kevyn Collins-Thompson,
and Eric Horvitz. 2013. Pairwise ranking aggrega-tion in a crowdsourced setting. InProceedings of the Sixth ACM International Conference on Web Search and Data Mining (WSDM), pages 193–202, New York, New York, USA, February. ACM Press.
Mark Dras. 2015. Evaluating human pairwise preference judgments. Computational Linguistics, 41(2):337– 345.
Shinsuke Goto, Donghui Lin, and Toru Ishida. 2014. Crowdsourcing for evaluating machine translation quality. In Proceedings of the Ninth International Conference on Language Resources and Evaluation (LREC), Reykjavik, Iceland, May. European Language Resources Association.
Yvette Graham, Timothy Baldwin, Alistair Moffat, and Justin Zobel. 2015. Can machine translation systems be evaluated by the crowd alone. Natural Language Engineering, FirstView:1–28.
Ralf Herbrich, Tom Minka, and Thore Graepel. 2006. TrueSkillTM: A bayesian skill rating system. In
Ad-vances in Neural Information Processing Systems 20 (NIPS), pages 569–576, Vancouver, British Columbia, Canada, Demeber. MIT Press.
Mark Hopkins and Jonathan May. 2013. Models of translation competitions. In Proceedings of the 51st Annual Meeting of the Association for Computational Linguistics (ACL), pages 1416–1424, Sofia, Bulgaria, August. Association for Computational Linguistics.
Philipp Koehn. 2012. Simulating human
judg-ment in machine translation evaluation campaigns. In Proceedings of International Workshop on Spo-ken Language Translation (IWSLT), pages 179–184, Hongkong, China, December. International Speech Communication Association.
Courtney Napoles, Keisuke Sakaguchi, Matt Post, and
Joel Tetreault. 2015. Ground truth for grammatical error correction metrics. InProceedings of the 53rd Annual Meeting of the Association for Computational Linguistics and the 7th International Joint Confer-ence on Natural Language Processing (ACL-IJCNLP), pages 588–593, Beijing, China, July. Association for Computational Linguistics.
Keisuke Sakaguchi, Matt Post, and Benjamin Van Durme. 2014. Efficient elicitation of annotations for human evaluation of machine translation. In Pro-ceedings of the Ninth Workshop on Statistical Machine Translation (WMT), pages 1–11, Baltimore, Maryland, USA, June. Association for Computational Linguis-tics.