University of South Carolina
Scholar Commons
Theses and Dissertations
1-1-2013
Fabrication and Characterization of Surrogate Fuel
Particles Using the Spark Erosion Method
Kathryn Elizabeth Metzger University of South Carolina
Follow this and additional works at:https://scholarcommons.sc.edu/etd
Part of theNuclear Engineering Commons
This Open Access Thesis is brought to you by Scholar Commons. It has been accepted for inclusion in Theses and Dissertations by an authorized administrator of Scholar Commons. For more information, please [email protected].
Recommended Citation
Fabrication and Characterization of Surrogate Fuel Particles Using the Spark Erosion Method
by
Kathryn E. Metzger
Bachelor of Science
University of South Carolina, 2009
Submitted in Partial Fulfillment of the Requirements
For the Degree of Master of Science in
Nuclear Engineering
College of Engineering and Computing
University of South Carolina
2013
Accepted by:
Travis W. Knight, Major Professor
Elwyn Roberts, Committee Member
ii
iii
A
CKNOWLEDGEMENTSThis research was performed using funding received from the DOE Office of
Nuclear Energy's Nuclear Energy University Programs (NEUP) in the form of a graduate
fellowship.
Special thanks go to my advisor Dr. Travis W. Knight for the opportunity to join
the University of South Carolina’s Nuclear Engineering program and his research group.
His support has been invaluable. I would also like to thank Dr. Elwyn Roberts for his
review and meaningful suggestions during the process. Thanks to Dr. Kaoumi and my
other professors for their education and guidance during my time thus far in the NE
program at USC. I would also like to thank the other graduate students in my research
group: Luke Hallman, Ian Porter, Seung Min Lee, Bo Shiuan Li, and Kyle Hrutkay for
their aid in the completion of this work. Thanks also to Misty, Lalitha, and Renee for
their smiles and words of encouragement.
Finally, I would like to express my heartfelt gratitude to my mother, father, nana,
brother, and boyfriend for their love and support. I could not have accomplished this
iv
A
BSTRACTIn light of the disaster at the Fukushima Daiichi Nuclear Plant, the Department of
Energy’s Advanced Fuels Program has shifted its interest from enhanced performance
fuels to enhanced accident tolerance fuels. Dispersion fuels possess higher thermal
conductivities than traditional light water reactor fuel and as a result, offer improved
safety margins. The benefits of a dispersion fuel are due to the presence of the secondary
non-fissile phase (matrix), which serves as a barrier to fission products and improves the
overall thermal performance of the fuel. However, the presence of a matrix material
reduces the fuel volume, which lowers the fissile content of dispersion. This issue can be
remedied through the development of higher density fuel phases or through an
optimization of fuel particle size and volume loading. The latter requirement necessitates
the development of fabrication methods to produce small, micron-order fuel particles.
This research examines the capabilities of the spark erosion process to fabricate particles
on the order of 10 μm. A custom-built spark erosion device by CT Electromechanica was
used to produce stainless steel surrogate fuel particles in a deionized water dielectric.
Three arc intensities were evaluated to determine the effect on particle size. Particles
were filtered from the dielectric using a polycarbonate membrane filter and vacuum
filtration system. Fabricated particles were characterized via field emission scanning
electron microscopy (FESEM), laser light particle size analysis, energy-dispersive
v
FESEM images reveal that the spark erosion process produces highly spherical particles
on the order of 10 microns. These findings are substantiated by the results of particle size
analysis. Additionally, EDS and XRD results indicate the presence of oxide phases,
vi
T
ABLE OFC
ONTENTSACKNOWLEDGEMENTS ... iii
ABSTRACT ... iv
LIST OF TABLES ... viii
LIST OF FIGURES ... ix
LIST OF ABBREVIATIONS ... xii
I. INTRODUCTION AND MOTIVATION ... 1
II. DISPERSION FUELS ... 6
2.1HISTORY AND BACKGROUND ... 7
2.2OVERVIEW AND BENEFITS ... 10
2.3FABRICATION ... 16
III. REVIEW OF SPARK EROSION MACHINING ... 20
3.1HISTORY AND USE OF SPARK EROSION IN INDUSTRY ... 20
3.2SPARK EROSION:EXPLANATION AND UNDERLYING PRINCIPLES ... 23
3.3SPARK EROSION FOR PARTICLE PRODUCTION:PARAMETERS WHICH INFLUENCE PARTICLE SIZE ... 32
IV. FABRICATION OF SURROGATE FUEL PARTICLES ... 36
4.1EXPERIMENT CONDITIONS: ... 36
vii
4.3PARTICLE FILTRATION ... 44
V. RESULTS AND CHARACTERIZATION ... 49
5.1PARTICLE YIELD ... 49
5.2PARTICLE LOSSES ... 50
5.3PARTICLE SIZE ANALYSIS ... 52
5.4PARTICLE IMAGING ... 60
5.5ENERGY-DISPERSIVE SPECTROSCOPY ... 66
5.6X-RAY DIFFRACTION PATTERN ANALYSIS ... 68
5.7DENSITY MEASUREMENTS ... 72
VI. CONCLUSIONS AND FUTURE WORK ... 74
6.1GENERAL CONCLUSIONS ... 74
6.2RECOMMENDATIONS FOR FUTURE WORK ... 77
REFERENCES ... 80
viii
L
IST OFT
ABLESTable 2.1: The following is a list of proposed fuel particle phases examined during the
RERTR program. [9] ... 9
Table 2.2: This table, reproduced from McGeary, illustrates the increase in TD with each additional component (particle size) [2]. ... 15
Table 4.1: Experimental parameters used in particle production research and resulting particle sizes ... 39
Table 5.1: Mass of particles retained in system for a 2hr run conducted at 16 A. ... 52
Table 5.2: Sample concentration and beam obscuration for each sample ... 55
Table 5.3: Summary report for each 25 A sample Test ... 56
Table 5.4: Summary report for each 16 A sample Test ... 57
Table 5.5: Summary report for each 10 A sample Test ... 58
Table 5.6: Summary report for each 25 A sample Test ... 68
Table 5.7: Composition of matched phases for figure 5.14. ... 70
Table A1: Peak Summary Report for 25A Sample ... 85
Table A2: Peak Summary Report for 16 A Sample ... 86
ix
L
IST OFF
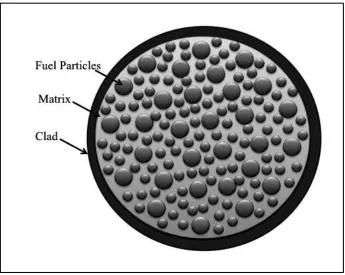
IGURESFigure 1.1: Cross section of a dispersion fuel. Fuel particles constitute the fissile phase and are embedded in a nonfissionable matrix material. ... 2
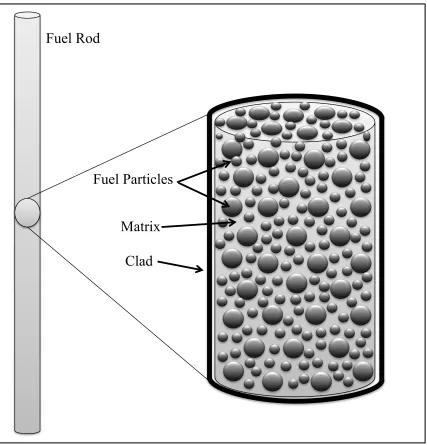
Figure 2.1: Example of a rod shaped dispersion fuel. Fissile particles are embedded within a nonfissionable matrix. ... 7
Figure 2.2: Fission fragment damaged is localized in a small ring around the fuel particle. This allows the supporting matrix material to remain interconnected and thus maintain its dimensional stability and strength. [6] ... 12
Figure 2.3: Binary packing of spheres. The fraction of theoretical density is shown for 20, 30, 40, 60, 80, and 100 mesh particles mixed with 7 mesh spheres. The theoretical density is a function of the fraction of coarse spheres (7 mesh) in the mixture. [2] ... 14
Figure 3.1: Shows how the molten debris flung from the rotating electrode can form a tail under high centrifugal forces.This tail will collapse into smaller debris spheres. [23] .... 22
Figure 3.2: Plasma temperature at gap center during and after discharge as measured by spectroscopy [26] ... 24
Figure 3.3: Example of Electric Discharge Machine. The tool electrode has a complex form in order to erode the workpiece into a desired shape. As the workpiece is eroded, the tool electrode is fed downward to maintain a constant gap width. [19] ... 25
Figure 3.4: Discharge phenomena in the gap and the expulsion of debris [19] ... 26
Figure 3.5: The variation in debris shape between air and liquid dielectric [31] ... 28
Figure 3.6: Image taken from Cabanillas [42]. Reveals oxidized internal structure of U-Mo particle produced in deionized water. [42] ... 29
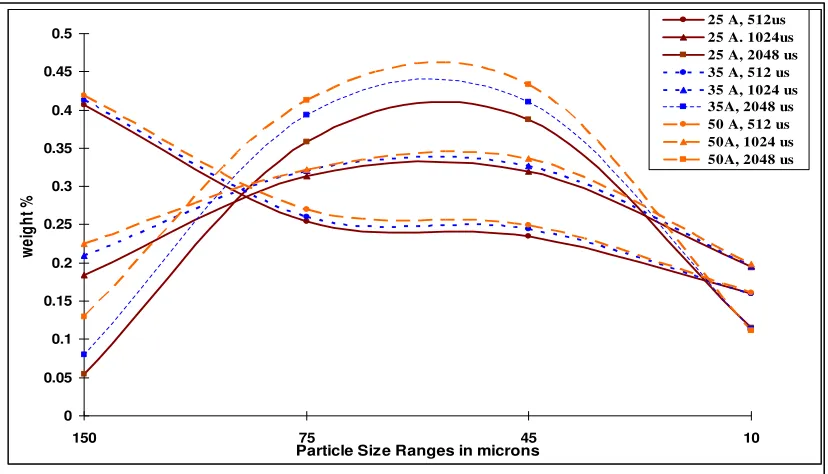
Figure 3.7: Size distribution of steel particles produced in a water dielectric. Data sets are a function of the applied current and the pulse width (frequency). Short pulse widths resulted in a narrower size distribution. [43] ... 34
x
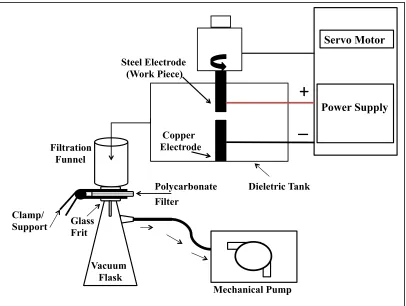
Figure 4.2: Electric discharge setup. The steel work-piece rotates while the copper tool electrode is anchored to tank base. ... 41
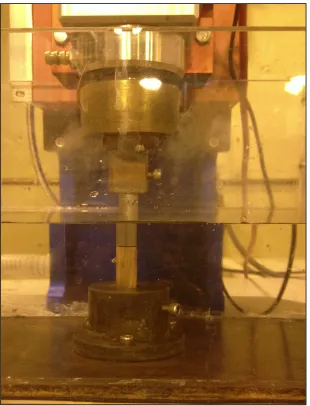
Figure 4.3: A spark is shown between the steel workpiece and copper tool electrode. .... 42
Figure 4.4: Copper electrodes. a) Polished electrode prior to experiment b) Surface of copper electrode after experiment; the electrode does not reveal any material loss. ... 43
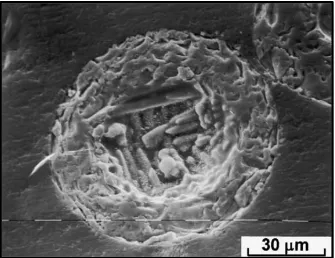
Figure 4.5: Steel Electrode a) Polished electrode prior to experiment b) Surface of the steel electrode after experiment reveals numerous micron-sized craters. ... 44
Figure 4.6: Vacuum filtration setup. ... 47
Figure 4.7: Polycarbonate filter a) Polycarbonate filter prior to filtration b) Wet particles are shown following filtration. c) Post filtration, particles have completely dried on the filter. d) Particles are removed from the flexible filter by a rolling motion stored in a sample dish. ... 48
Figure 5.1: Particle yield as a function of experiment duration. (Experiment conditions were identical between tests, 16 A, 512 µs pulse length and 64 µs pulse width.) ... 49
Figure 5.2: Background B shows an acceptable and well-defined background
measurement. Background A has higher intensities and less detail. This indicates the presence of contaminants, which cause the light to scatter smoothly and continuously. . 54
Figure 5.3: Results of 3 particle size measurements are graphed as a function of volume frequency for the 25 A sample. A summary of particle size data for each test is
provided in table 5.3. ... 56
Figure 5.4: Results of 3 particle size measurements are graphed as a function of volume frequency for the 16 A sample. A summary of particle size data for each test is provided in table 5.4. ... 57
Figure 5.5: Results of 3 particle size measurements are graphed as a function of volume frequency for the 10 A sample. A summary of particle size data for each test is
provided in table 5.5. ... 58
Figure 5.6: Average particle size distribution of each sample (25 A, 16 A, and 10 A) .... 59
Figure 5.7: Samples prepared for imaging. ... 61
Figure 5.8: Microsphere fabricated at 25 A, with 512 µs pulse duration, and 64 µs pulse off-time. Scale indicated is 2 µm. ... 61
xi
Figure 5.10: Microspheres fabricated at 16 A, with 512 µs pulse duration, and 64 µs pulse off-time. Scale indicated is 2 µm. ... 63
Figure 5.11: Microspheres fabricated at 10 A, with 512 µs pulse duration, and 64 µs pulse off-time. Scale indicated is 2 µm. ... 64
Figure 5.12: Microsphere shows high surface porosity. Scale indicated is 100nm. ... 65
Figure 5.13: EDS spectrum of 16 A particle sample. The counts are shown as a function of energy (keV). ... 67
Figure 5.14: Diffraction pattern of sample particles with iron oxide phases indicated. ... 69
Figure 5.15: Diffraction pattern of sample particles with peaks labeled for observed chromium and nickel phases. ... 71
xii
L
IST OFA
BBREVIATIONSADUN ... Acid-Deficient Uranyl Nitrate
CCD ... Charge-Coupled Device
CER-MET ... Ceramic-Metallic
Cr2FeO4 ... Chromium Iron Oxide (Chromite)
Cr2NiO4 ... Chromium Nickel Oxide
CVD ... Chemical Vapor Deposition
DC ... Direct Current
DOE ... Department of Energy
EDM ... Electric Discharge Machining
EDS ... Energy Dispersive Spectroscopy
EMC ... Electron Microscopy Center
Fe3O4 ... Iron (II, III) Oxide
Fe2O3 ... Iron (III) Oxide
FeO ... Iron (II) Oxide
FESEM ... Field Emission Scanning Electron Microscope
HEU ... Highly-Enriched Uranium
HMTA ... Hexamethylenetetramine
HP ... Horse Power
xiii
LWR ... Light Water Reactor
MET-MET ... Metallic-Metallic
ORNL ... Oak Ridge National Lab
PMEDM ... Powder Mixed Electric Discharge Machining
R&D ... Research and Development
REP ... Rotating Electrode Process
RERTR ... Reduced Enrichment Research and Test Reactor
RPM ... Rotations Per Minute
ThO2 ... Thorium Dioxide
TD ... Theoretical Density
UO2 ... Uranium Dioxide
(U,Pu)O2 ... Uranium-Plutonium Dioxide
1 1
CHAPTER 1
I
NTRODUCTION ANDM
OTIVATIONThe sustainability of the current Light Water Reactor (LWR) fleet is dictated by
the ability to maintain safe and economic operation beyond the initially licensed reactor
lifetime. The Department of Energy (DOE) Light Water Sustainability Program has a
roadmap for the life extension of these reactors. Among the research and development
(R&D) tasks identified, is the need to investigate advanced LWR fuels capable of
achieving higher burnups [1]. In addition to reaching higher burnups, a candidate fuel
must also guarantee a safety margin more competitive than existing UO2 fuel forms.
In March 2011, the events at Fukushima reinforced the need for fuels designed
with increased accident tolerance. As a result, the interest of the DOE Advanced Fuels
Program shifted from enhanced performance fuels to enhanced accident tolerance fuels.
The DOE defines enhanced accident tolerance fuels as fuels that “in comparison with the
standard UO2-Zircalloy system currently used by the nuclear industry, can tolerate loss
of active cooling in the reactor core for a considerably longer time period (depending on
the LWR system and accident scenario) while maintaining or improving the fuel
performance during normal operations, operational transients, as well as design-basis and
2 2
Dispersion fuels are attractive because their higher melting temperatures and
thermal conductivities offer improved safety margins. The presence of matrix materials,
regardless of whether they are metallic or ceramic in nature tends to reduce fuel operating
temperatures and fission gas release. A matrix is also a proven barrier to fission
products. Therefore, a dispersion fuel in which fuel particles are embedded in a matrix
material is an inherently safer fuel design. Among the fuel types being investigated are
Ceramic fuel-metallic matrix (Cer-Met), Metallic fuel-metallic matrix (Met-Met), and
Metallic Fuels.
Figure 1.1: Cross section of a dispersion fuel. Fuel particles constitute the fissile phase and are embedded in a nonfissionable matrix material.
By suspending fuel particles within an inert matrix, the volume of fuel and overall
fissile content is significantly decreased. This is one of the greatest challenges presented
3 3
uranium density or by increasing the enrichment of the fuel. Enrichment of the fuel
beyond regulatory limits is not a viable option if fuels are intended for use in current
LWRs. Instead, the need for increased enrichment can be overcome through the selection
of a new fuel phase with high uranium content. Another means of increasing the fissile
content in the dispersion is by increasing the fuel-loading fraction within the matrix. This
is accomplished through an optimization of fuel and matrix particle size distributions.
The packing fraction is governed by the size distribution of the constituent particles and
the greatest volume loading is achieved when multiple particle sizes are employed.
The loading fraction increases with the ratio of large to small particle diameters.
McGeary investigated the idealized packing of mechanical spheres in single component,
binary, ternary, and quaternary systems [2]. For binary systems, it was determined that
the maximum or limit for void efficiency occurred when the ratio of large particle
diameter to small particle diameter was 10. For example, a combination of 100-micron
and 10-micron particles would produce a highly dense dispersion. Any further increases
in this ratio did not substantially increase the packing density. For ternary component
systems, McGeary found that the maximum density was achieved for particles with a size
ratio 77:7:1 in a volume percentage of 66:25:9, respectively. Subtle shifts in the size
ratio and the particle size distribution will provide increased voids, which can be
beneficial should an initial degree of fuel porosity be desired. Thus, the development of
dispersion fuels will require a formal understanding of mechanical particle loading as
well as size-specific particle fabrication methods.
Traditional fuel particle production techniques like ball milling may be an
4 4
The Sol-gel method is an alternative fabrication process that produces highly spherical
particles of consistent size. This would be an ideal choice for particle production;
however, the process generates a large quantity of mixed waste and more importantly,
cannot be used to produce particles below 50 µm [3]. Therefore, an alternative
fabrication route must be used to achieve smaller-sized particles.
Spark erosion can be used to produce highly spherical particles ranging in size
from a few nanometers to a several hundred micrometers [4]. The term spark erosion
encompasses all machining processes in which a spark is generated between two
electrodes submerged in a dielectric medium. Electric discharge machining is the most
common form of spark erosion and has been used for decades to machine hard and brittle
materials into complex shapes and dies. Spark erosion is also a very versatile process
that can be used to produce particles of varying sizes from any moderately conductive
workpiece.
This research seeks to evaluate the spark erosion process for the fabrication of
particles smaller than achievable through the sol-gel processes. Specifically, it was
desired to determine the parameters necessary to generate microspheres on the order of
10 µm. To accomplish this, a custom-built spark erosion device by CT Electromechanica
of Argentina was used to fabricate surrogate fuel microspheres. The chosen diameter of
10 µm is a nominal value intended only to validate the use of spark erosion for
micron-order particle applications. Additionally, by isolating a specific particle diameter, it was
possible to evaluate the difficulty of producing a narrow and reproducible size
distribution. A literature review was conducted to guide in the selection of the starting
5 5
electron microscopy, energy dispersive X-ray spectroscopy, X-Ray diffraction analysis,
particle yield analysis, laser light particle size analysis, and helium gas pycnometry.
The results of the research reveal that the spark erosion process is an effective
means of producing highly spherical particles on the order of 10 µm. The size
distribution of particles produced using the spark erosion method is dominated by a large
particle size but also shows the presence of much smaller particles. Repeated filtrations
of the spark eroded particles in the dielectric medium would allow for a greater degree of
particle separation and could isolate the 10 µm, larger particles, if desired.
Compositional analysis using X-ray diffraction and energy dispersive x-ray
spectroscopy revealed high oxygen levels in the fabricated particles. The presence of
oxide phases in the surrogate particles is due to the interaction of the molten debris with
dielectric during solidification. Because deionized water was used as the dielectric, oxide
phases were formed. The selection of a different dielectric, like a hydrocarbon would
change the phases identified. Gas pycnometry measurements show that the particles have
a density less than both the starting 304SS workpiece and the identified XRD phases.
This suggests that the particles have a porous structure, which could be confirmed
6 6
CHAPTER 2
D
ISPERSIONF
UELSA dispersion fuel is a nuclear fuel that consists of fissionable fuel particles
dispersed in non-fissionable metallic, ceramic, or graphite medium [5]. The host material
surrounding the fuel particles is referred to as the matrix. The motivation behind a
dispersion fuel is that it combines the beneficial properties of the matrix material with the
fissile characteristics of the particle fuel. A chosen matrix will support carbide, oxide,
mixed oxide, nitride, ceramic, or even alloy fuel particles. One of the advantages of a
dispersion fuel is the ability to optimize mechanical properties and performance by
selecting an appropriate fuel composition. The performance and power density can be
influenced by fuel particle size, geometry, and volume fraction. Thus, a dispersion fuel
can effectively be designed for the needs of any specific application.
The use of dispersion fuels dates back to the 1950's. At the time, dispersion fuels
were seen as an ideal candidate for research and test reactors. Due to their robust
performance capabilities, dispersion fuels have also been investigated for use in space
nuclear power systems, advanced reactor systems capable of waste transmutation, and
7 7
Figure 2.1: Example of a rod shaped dispersion fuel. Fissile particles are embedded within a nonfissionable matrix.
2.1HISTORY AND BACKGROUND
The development of dispersion fuels gained traction in the 1950s and 1960s with
the design of Aluminum-based dispersion fuels for research reactors. Fuel forms
investigated included UAl3, U3O8, and U3Si2 [5]. Such Aluminum based dispersion fuels
are common in most research and test reactors in use today. The U.S. reduced
!!
Fuel Particles
Matrix
8 8
enrichment research and test reactor (RERTR) program, which began in 1978, saw a
renewed interested in dispersion fuels. The motivation for the RERTR program was to
address a nonproliferation goal and quell concerns about certain fuels providing an easy
route to the acquisition of nuclear weapons. The RERTR program examined the
feasibility of a transition from the use of highly enriched uranium (HEU) to low enriched
uranium (LEU) fuels in research and test reactors. Enrichment to less than 20% U235 is
internationally recognized as a complete barrier to weapons usability [7]. A simple
substitution across the board for LEU in existing fuel designs would reduce the core
performance. An LEU replacement in existing fuel designs would reduce the core
reactivity, increase fuel costs, decrease U235 burnup capability, and decrease the
flux-per-unit-power in the reactor [7]. Therefore, the challenge presented was to pack the same
amount of U235 formerly in HEU fuel into fuel utilizing LEU without changing the
dimensions of the fuel element, and while maintaining the same power density [8]. In
order to accomplish such a task, new fuels were developed that maintained approximately
the same amount of U235, despite the decreased enrichment. There are three ways to
increase the uranium loading in the fuel element: increase the enrichment of the uranium
in the fuel, increasing the actual uranium density in the fissile phase, or increase the
volume of the fissile material relative to the matrix. The first option, increased
enrichment, is not feasible for LWR applications. The development of fuels with higher
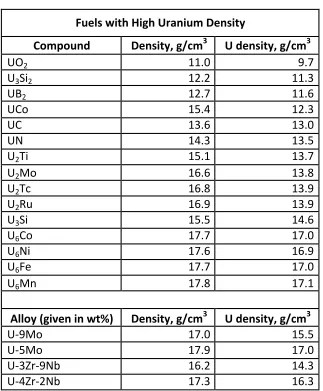
uranium density will benefit many applications. Table 2.1 shows a list of proposed fuel
9 9
Table 2.1: The following is a list of proposed fuel particle phases examined during the RERTR program. [9]
In addition to exploring fissile materials or alloys with higher uranium densities, it
is also possible to increase the fuel particle volume fraction within the matrix. This can
be accomplished by selecting an ideal fuel particle size distribution.
More recently, dispersion fuels have been revisited by the Department of
Energy’s Light Water Reactor Sustainability program in an attempt to study the possible
use of dispersion fuels with enhanced accident tolerance capabilities for deployment in
the current light water reactor fleet. The goal of enhanced accident tolerance was born
Fuels&with&High&Uranium&Density&
Compound& Density,&g/cm3& U&density,&g/cm3&
UO2$ 11.0$ 9.7$
U3Si2$ 12.2$ 11.3$
UB2$ 12.7$ 11.6$
UCo$ 15.4$ 12.3$
UC$ 13.6$ 13.0$
UN$ 14.3$ 13.5$
U2Ti$ 15.1$ 13.7$
U2Mo$ 16.6$ 13.8$
U2Tc$ 16.8$ 13.9$
U2Ru$ 16.9$ 13.9$
U3Si$ 15.5$ 14.6$
U6Co$ 17.7$ 17.0$
U6Ni$ 17.6$ 16.9$
U6Fe$ 17.7$ 17.0$
U6Mn$ 17.8$ 17.1$
$$
$ $$
Alloy&(given&in&wt%)& Density,&g/cm3& U&density,&g/cm3&
U=9Mo$ 17.0$ 15.5$
U=5Mo$ 17.9$ 17.0$
U=3Zr=9Nb$ 16.2$ 14.3$
10 10
out of the accident at Fukushima and recognition that future fuel designs must perform as
well if not better than the current industry standard in the event of beyond-design basis
accidents. Dispersion fuel is an attractive candidate for the enhanced accident tolerance
fuels program because its higher melting temperatures and thermal conductivities offer
improved safety margins. Historically, dispersion fuels have often taken the form of fuel
plates. However, it is possible to use dispersion fuels in the form of traditional pellets so
that they can be used in current LWRs. Whether they feature a ceramic or metallic fuel
phase, a dispersion that utilizes a metallic matrix, so-called CER-METs and MET-METs,
are viable fuel candidates for use in fast reactors as well as current LWRs [10]. The use
of a Zirconium or Aluminum metallic matrix ensures low centerline operating
temperatures and provides better safety margins under power ramp and accident
conditions.
2.2OVERVIEW AND BENEFITS
The matrix material can be selected such that it offers improved strength,
increased radiation stability, and high thermal conductivity [11]. The matrix is usually a
metal or an alloy. This allows for high power densities and low failure consequences [6].
By isolating the fuel particles, a substantial volume of the matrix remains undamaged by
fission products [5]. This allows the fuel to reach higher burnups than would be possible
in traditional ceramic fuel. Of course, fuel particle, matrix, and cladding materials should
be selected bearing in mind the potential interaction between the phases in high
temperature and accident scenarios.
Because traditional Uranium Dioxide (UO2) fuel has poor thermal conductivity, a
11 11
linear heating rates and is pronounced during thermal excursions like startup. This
temperature gradient causes the center of the fuel to expand more rapidly than the pellet’s
periphery. Such thermal stresses deform the pellet until the fuel fracture stress is
exceeded. When the fracture stress is exceeded, the brittle UO2 pellet cracks. Cracking
of the fuel pellet further reduces the effective thermal conductivity of the fuel. This
translates to the fuel’s centerline being unable to transfer heat. This leads to an increased
centerline temperature. Additionally, cracks allow for the migration of fission gases to
migrate to the pellet-clad gap. Fission gases, like Krypton and Xenon, have lower
thermal conductivities than the helium fill gas and reduce heat transfer across the gap.
Solid fission fragments as well as fission gases cause fuel swelling. Solid fragments can
cause expansion of the fuel matrix while the fission gas atoms that are released into the
fuel-clad gap, exert additional pressure on the cladding. In extreme operating conditions,
or accident scenarios, stressed cladding may rupture.
In contrast, metallic-matrix dispersion fuels feature fuel particles surrounded by a
highly conductive metal. The high thermal conductivity of the metal reduces the
temperature gradient across the fuel pellet, thereby improving the heat transfer and
performance of the fuel. A lower operating temperature and temperature gradient means
the robust fuel will have improved safety margins in the event of an accident.
Additionally, by containing the fuel to spheres dispersed in the matrix, fission fragment
damage is localized to the microspheres. While this does result in a small ring of damage
around the spheres, a large portion of the matrix remains interconnected and undamaged.
12 12
Figure 2.2: Fission fragment damaged is localized in a small ring around the fuel particle. This allows the supporting matrix material to remain interconnected and thus maintain its dimensional stability and strength. [6]
Matrix materials can be selected based on desired mechanical properties and ease
of fabrication. Metallic matrix materials like aluminum and zirconium, offer high thermal
conductivities, which lower the operating fuel temperature. Fuel particle composition
can be selected based on the requirements of a given application. By substituting
monolithic UO2 pellet fuel for a dispersion of UO2 particles in a zirconium matrix, a
burnup equivalent to 85GWd/t in UO2 pellet fuel can be achieved [6]. Thus, a dispersion
fuel form can increase accident tolerance and enhance performance if used in current
LWRs.
2.2.1FUEL VOLUME FRACTION
Volume loading is dependent upon the size of the fuel particles as well as the
matrix particles. By utilizing binary, ternary, or even quaternary packing, it is possible to
design a dispersion fuel with optimum matrix, void, and fuel phase fractions for a
specified task. The ratio of diameters of matrix and fuel particles will influence the void
volume in the fuel. In cases where fuel swelling is prone, it is desirable to fabricate the
fuel with an initial porosity capable of offsetting the swelling. Particle size ratio is also
important in maximizing the fuel phase loading in a dispersion fuel. Dispersions
naturally have a smaller fissile phase volume than traditional monolithic fuels.
16
Dispersion Fuel
The volume of undamaged matrix
depends on fuel volume fraction (V
f), fuel
particle size (D), and fission fragment
range in the matrix (
m).
Fuel particle
Matrix
Fission fragment
damage zone
Small particle
size leads to
overlapping
damage zones
13 13
Therefore, in order to achieve a competitive fissile content, the fissile density must be
maximized. The particle size of the fuel relative to the matrix, for the case of binary
packing, will determine the possible fuel densities. In other cases, it is desirable to use
two or more particle sizes for the fuel phase.
McGeary’s research [2] on the mechanical packing of spherical particles followed
the 1931 work of Furnas [12]. Furnas initiated the study of idealized packing of spheres
of different sizes. McGeary’s research substantiated Furnas’ theories with experimental
results. Specifically, the maximum density possible for a single-component, binary,
ternary, and quaternary system was addressed. In the case of single component packing,
particle size has no bearing on the packed density. The density of a single component
packing is usually between 60% and 64% volume. However, the container size relative
to particle diameter has a pronounced effect on packing density. McGeary found that the
maximum density, a value of 62.5% theoretical density (TD), can be achieved when the
ratio of the container diameter to that of the particle is greater than 200 [2]. However,
the onset of the 62.5% TD value occurs at a much smaller ratio. Values of 61% and 62%
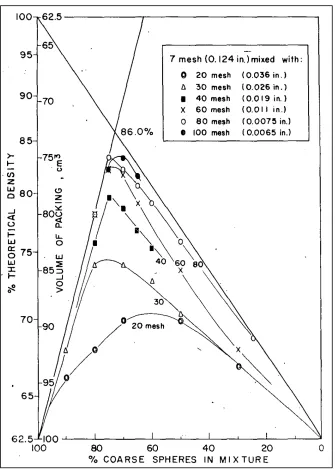
TD can be seen as early as a container to particle diameter ratio of 10. For binary
systems, it is obvious that the smaller the diameter of the fine spheres, the greater the
density of the packing. The maximum achievable packing begins when the ratio of larger
spheres to smaller spheres is approximately 10. Below 7, the density falls off rapidly. As
the fraction of each sphere size in the mixture changes, the maximum achievable
percentage of the theoretical density will also change. However, there are instances in
14 14
mixture density. Thus, it is important to know the desired properties of the mixture so
that both mixture density and phase fraction can be optimized.
Figure 2.3: Binary packing of spheres. The fraction of theoretical density is shown for 20, 30, 40, 60, 80, and 100 mesh particles mixed with 7 mesh spheres. The theoretical density is a function of the fraction of coarse spheres (7 mesh) in the mixture. [2]
For ternary loadings, McGeary found that the maximum density occurred at
15 15
ratio 77:7:1. Experimental results confirmed that this packing resulting in a density of
90% TD. Packing systems with four or more particle sizes increase the options for
heterogeneous component loading. However, in terms of the overall mixture density, the
benefit of each additional size was found to be only one-half that of the proceeding
component.
Table 2.2: This table, reproduced from McGeary, illustrates the increase in TD with each additional component (particle size) [2].
While a higher fuel volume fraction does increase the fissile content in the matrix,
it can also increase the amount of irradiation swelling that the fuel pellet experiences
[13]. Finlay et al. noted that this phenomenon was not pronounced in stable fuels with
low swelling rates such as U3Si2. However, for less stable fuels like U3Si, U3SiAl, and
U6Fe, a larger fuel volume fraction increases the amount of swelling that occurs in the
pellet. In order to optimize the performance of a dispersion fuel, it is necessary that
appropriate fuel particle size(s) and matrix particle size be selected such that void volume
and fissile phase density are guaranteed in terms of the desired composition.
2.2.2PARTICLE SIZE
Fuel particle size also impacts a dispersion fuel’s thermomechanical performance.
Ding et al. performed a series of three-dimensional finite element simulations on a UO
2-Zirconium dispersion fuel plate in order to examine the interaction between the fuel
particle and matrix [14]. More specifically, the thermo-elastic performance of the fuel Component Mesh d d+ratio X1 X2 X3 X4
Calculated+
Limit Experimental
1 0.505 316 1.00 ??? ??? ??? 60.5 58.0
2 14 0.061 38 0.726 0.274 ??? ??? 85.9 80.0
3 60 0.011 7 0.647 0.244 0.109 ??? 94.2 89.8
16 16
was modeled as a function of particle size. It was determined that the fuel plate internal
temperatures increase with increasing fuel particle diameters. At the interface between
the fuel particle and the matrix, the von Mises stress increases with an increasing fuel
particle diameter. The maximum von Mises stress within the fuel particle increases with
increasing particle diameter, as well. Jiang et al. simulated the effect of a heterogeneous
fuel particle loading in dispersion fuel rods. The results showed that the highest
temperatures within the fuel were located close to the mid-plane of the fuel rod and at
points where there was the smallest distance between fuel particles. However, the actual
difference in temperatures values between particles from a performance standpoint was
insignificant (less than 0.5 K variation). Thus, it was determined that for metallic
matrices, the fuel particle-to-particle distance does not affect the maximum temperature
in the fuel [15]. This is due to the high thermal conductivity of the metallic matrix.
2.3FABRICATION
The simplest method for manufacturing dispersion fuel follows the powder
metallurgy process. Prefabricated fuel microspheres are mixed with a matrix material in
powder form, and sintered into pellets or other desired shapes [16]. Sintering removes
voids and pores in the fuel that can have a negative impact on heat conduction on and
matrix fracture toughness. Matrix materials with high melting temperatures are desired
for higher safety operating margins. However, this also presents a challenge in terms of
sintering fuels to high densities because the task may involve several high temperature,
long duration heating cycles. This issue is especially difficult when the fissile phase and
the matrix material have different melting temperatures. There are many variations to this
17 17
Institute used capillary impregnation to draw molten matrix material up and around fuel
particles previously vibro-loaded in a cladding [17]. Fuel particle production methods
are discussed in the following sections.
2.3.1MILLING
In the case of Uranium aluminides or uranium silicides, the dispersed phase is
produced by induction melting and casting. For brittle materials, the fabricated ingots
can be comminuted to powder using hammer milling or ball milling techniques. This
yields a fuel powder composed of small fuel particles, which is suitable in most
dispersion fuels. However, tougher materials like U3Si2 required additional machining or
crushing and yield “chips” rather than powder. Another problem with milling techniques
is that the process increases the opportunity for foreign debris to contaminate the fuel
particles. For highly reactive fuels, milling cannot be used due to the reactive nature of
the particle with air.
2.3.2INTERNAL GELATION
The internal gelation process, or sol gel, offers several advantages to traditional
milling. The aqueous process is capable of producing highly spherical particles with a
reproducible size distribution. This method can be used to ceramic particle fuels, such as
UO2, (U,Pu)O2, ThO2, and even ceramics with minor actinide additives. Recently,
ORNL has successfully extended the process to produce metal oxide spheres of titanium,
zirconium, and iron. A drawback to the process is the large quantity of liquid waste
generated. In the sol gel process, chilled clear broth droplets containing acid-deficient
uranyl nitrate (ADUN), hexamethylenetetramine (HMTA), and urea are heated causing a
homogenous gelation and solidification of the droplets. The particles assume a highly
18 18
solidification, the particles are washed and can be calcined and sintered to ceramic
kernels of a desired density [18]. The sol gel process allows for the precise control of
fuel composition, particle size, and density. The particle diameter is directly dependent
upon the size of the both droplets, which can be easily fixed using a high frequency
needle for deposition [18]. Thus, the process is capable of producing highly spherical
particles within a narrow size distribution. The sol gel process has proven very
successful in terms of producing particles on the order of 100-1000 µm. However,
Vaidya et al. documented that the process is incapable of producing particles smaller than
50 µm [3]. Oak Ridge National Lab (ORNL) found that particle size was dependent on
both needle frequency and the inner diameter of the broth-dispensing needle [18].
Generally, it was found that the diameter of the broth jet should be about one half the
intended drop diameter. With a decreasing needle cavity, it eventually becomes
impossible to flow the broth through the needle. This applies a lower limit to the size of
fuel particles that can successfully be fabricated using the sol gel method.
2.3.3SPARK EROSION
Spark erosion can be used to produce highly spherical microparticles for use in
dispersion fuels. Particles can be fabricated from any conductive material. Thus, the
process can be used to produce the fuel particles as well as the stock powder for the
matrix. In spark erosion, a spark is generated between two electrodes immersed in a
dielectric fluid. Following the creation and breakdown of plasma between the two
electrodes, molten material is ejected from the surface of the electrode and is rapidly
quenched in the dielectric [1]. Metallic, alloy, and compound particles can be produced
using this method with particles sizes ranging from on the order of nanometers up to
19 19
applied current, current frequency, and a number of other parameters [19]. Methods in
which one or both of the electrodes rotate are referred to as a rotating electrode
mechanism. Although most spark erosion devices feature a rotating electrode, the unique
advantage associated with the rotating electrode processes seems limited to systems in
which the is electrode sees thousands of rotations per minute (rpm). In this case, a high
frequency of rotation is responsible for the smaller particle sizes associated with the
method. Although spark erosion devices may feature a rotating electrode, it rotates with
a much lower frequency of rotation. This low rotation frequency is responsible for
clearing the debris from the gap between the electrodes, rather than directly influencing
particle size. Although the rotating electrode process is capable of producing smaller
particles than a classical spark erosion mechanism, the spark erosion mechanism is still
capable of producing particles on the scale of several nanometers. A detailed review of
the supporting science of spark erosion and the influence of process parameters on
20 20
CHAPTER 3
R
EVIEW OFS
PARKE
ROSIONM
ACHINING3.1HISTORY AND USE OF SPARK EROSION IN INDUSTRY
The first use of machining with electric discharge was during the 1930’s. Henry
Harding of Elox US developed a “disintegrator” to remove broken taps, studs, and bolts
from valuable workpiece materials [20]. The cutting action of the disintegrator was
accomplished by a series of intermittent electric arcs between a tool electrode and
workpiece, which was connected to a DC power supply. Although the process was not
precise and process parameters were not well understood, the disintegrator accomplished
the task of material erosion and bit retrieval. In 1943, B. R. Lazarenko studied the
prevention of wear on tungsten electrical contacts [21]. The research found that erosion
was more precisely controlled when electrodes were immersed in a dielectric medium.
By introducing the concept of controlled discharge conditions, this work initiated the
development of advanced electric discharge machining with precision machining
capabilities. Following Lazarenko’s work, electric discharge technology developed
rapidly. Today, the technology exhibits several variations and is used in a number of
manufacturing applications including die and mold making, finishing, micro-machining,
21 21
Within the literature, the terms “spark erosion machining” and “electric discharge
machining (EDM)” are used interchangeably. However, there is a tendency to use EDM
to discuss precision machining of a workpiece material, as in the case of die making. On
the other hand, the powder and particle industry prefers the term spark erosion machining
or rotating electrode machining, depending upon the specified process. In either case, the
science and guiding principles discussed in the following section are the same.
Spark erosion has greatly increased the machinability of otherwise difficult
materials. Refractory metals and other hard materials can be machined with relative ease
using the high temperatures and precision afforded by the spark erosion method. Wire
EDM is used to carve out and design impressions in the workpiece material. This
particular form of spark erosion is used in the die-making industry. The wire tool
electrode is fed down to the work piece and can move along the X-Y-Z axes, allowing for
the engraving or cutting of complicated shapes.
Although spark erosion is considered a removal process, it can also be used to add
layers and coatings. Under sparking conditions, an anode steel electrode in the presence
of a hydrocarbon dielectric will build a layer rich in carbon. This carbon-rich layer is
known to increase the corrosion resistance of the base material. Similarly, titanium
electrodes in a water dielectric develop an oxide layer. This process has been used to
color titanium since the interference of light in the oxide film is responsible for the color
of the titanium. A desired color can be achieved by controlling the thickness of the oxide
layer.
The powder and particle industry also rely on spark erosion technology. The
22 22
be optimized to achieve of a desired size and size distribution. The process has been used
to produce microspheres of metals, alloys, and compounds of a wide range of materials
with particle sizes from several nanometers to several micrometers [22]. Processes that
feature a rapidly rotating electrode are referred to as rotating electrode processes (REP)
rather than spark erosion process. Although many spark erosion electrodes rotate, the
method is distinguished from REP by the frequency of rotation (60 rpm vs. 10,000 rpm).
REP is able to achieve much smaller particle sizes than non-rotating spark erosion
methods because of the greater centrifugal force on the molten debris. The rapid rotation
of the electrodes flings spherical debris from the gap but creates an elongated tail on the
molten material. [23]. This tail eventually breaks from the primary debris particle and
forms a smaller secondary particle.
Figure 3.1: Shows how the molten debris flung from the
23 23
Spark erosion can also be used to fabricate reacted particles. This is achieved by
a reaction between the molten debris and the dielectric. The composition of particle and
even the microstructure of the particle can be influenced by carrying the dielectric. It has
been shown that kerosene and other hydrocarbon-based dielectrics form carbide phases in
the reacted particles. Similarly, when water or deionized water is used as the dielectric, it
is possible to produce oxide particles. To prevent the formation of reacted particles, an
inert gas may be used as the dielectric.
3.2SPARK EROSION:EXPLANATION AND UNDERLYING PRINCIPLES
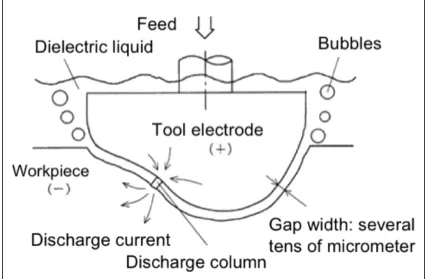
Both EDM and spark erosion refer to machining processes in which material is
removed in response to a pulsed electric arc drawn across a pair of electrodes. One
electrode is referred to as the tool electrode while the other is called the workpiece. A
gap between the electrodes is filled with a dielectric, an insulating medium of gas or
fluid. The dielectric aids in preventing electrolysis effects on the electrodes during the
EDM process and is also responsible for the stability of the sparking behavior. Following
the flow of current between electrodes, an electric discharge is initiated as the high
voltage overcomes the dielectric breakdown strength of the gap. When the dielectric
breakdown of the gap occurs, the gap transitions from an insulator to a conductor. This
transition is characterized by the formation of a plasma channel, which is an ionized
highly conductive gas with extremely high temperature. If the electrodes are not perfectly
smoothed, the plasma channel tends to form at the nearest points between the electrodes.
Following the formation of the plasma channel, an electric arc flows across the electrodes
following the path of the plasma channel [19]. Plasma temperatures have been measured
24 24
electrode surface temperature rises well above its melting and even boiling point. The
resulting molten material at the location of the arc is expelled from the gap. The molten
debris material forms a sphere due to surface tension and solidifies as a result of the rapid
cooling caused by the presence of a dielectric. When the flow of current is ended, the
temperature of the plasma and the electrode surfaces rapidly drop. Hashimoto et al. found
that the plasma temperature drops to below 5000K within 5µs after the discharge current
is stopped [26]. This results in a recombination of ions and electrons in the gap and the
recovery of the breakdown strength of dielectric.
Figure 3.2: Plasma temperature at gap center during and after discharge as measured by spectroscopy [26]
Adequate timing between the applied current pulses insures that the dielectric has
sufficient time to recover its breakdown strength. Hashimoto determined that applying
the current before 5µs resulted in immediate ignition because the dielectric strength was
not fully regained [26]. Thus, the frequency of the applied current used in EDM and
spark erosion controls not only the frequency of the electric discharges, but also the
stability of the process.
It is also found from Figure 17 that 18% of the energy goes
to the discharge gap. In the magnetohydrodynamics
analysis of the steady state arc, however, Hayakawa et al.
[20] found that almost all the discharge power is conducted
into the electrodes and the heat dissipated by convection
and radiation is negligible. This is because the arc column
is established in steady state and both convection and
radiation are insignificant in the narrow gap between
parallel plane electrodes. This result agrees with the
distribution measured when discharge duration was several
thousand times longer than the duration actually used in
EDM [20]. The power distributed into the gap with the
actual discharge duration is considerably higher than that in
the steady arc. Thus it was concluded that the gap
condition is not in equilibrium during the actual discharge
duration in EDM, and a large fraction (18%) of the
discharge power is consumed in the formation of plasma
through
ionization,
excitation,
dissociation,
and
polymerization. So it means the plasma formation is still
going on.
3.4 Measurement of plasma temperature
The arc plasma temperature in EDM was measured using
spectroscopic analysis, and it was found that the
temperature reaches 6000 to 7000K [32-35]. Figure 18
shows the change in measured temperatures during and
after a discharge when a copper electrode of 2mm in
diameter was used both for anode and cathode under the
following pulse conditions: discharge current: 40A;
discharge duration: 300µs. It is found that the deionization
time for a 0.5mm gap width is considerably shorter than for
1.5mm. This is because a wide gap results in a small
temperature gradient and a great heat capacity of the
plasma. On the other hand, Hashimoto et al. [34] found that
the ignition delay time of the following pulse discharge
becomes zero when the discharge interval after the
preceding pulse discharge was shorter than 5µs. They also
found that the plasma temperature measured at 5µs after
the cease of discharge current was below 5000K. The
calculated temperature decrease during the discharge
interval shown in Figure 13 also supports their results. This
means that a plasma temperature of 5000K is considered
as the threshold of deionization. This temperature drop
during the pulse interval shows the minimum interval
required to obtain stable machining.
3.5 Thermal aspects
To obtain the relationship between pulse conditions and
material removal rate, many attempts have been made to
calculate temperature distribution in the electrodes caused
by a single pulse discharge by solving time-dependent heat
transfer equations assuming various heat source models.
By integrating the solution for a point source which is
liberated instantaneously at a given point and time with
regard to appropriate space and time variables, one can
obtain solutions for instantaneous and continuous sources
of any spatial configuration (Carslaw and Jaeger [36]). The
analytical solutions of the temperature distributions at time
t
produced by stationary Gaussian energy distribution
sources in a semi-infinite solid were given by Pittaway [37].
With the advent of powerful computers and numerical
methods, it is nowadays not difficult to take into account the
temperature dependence of thermophysical properties of
electrode materials and latent heat of melting and
vaporization. It is also possible to consider the time
dependent radius of the circular heat source and time
dependent heat flux, using the principle of superposition
based on the linearity of the heat conduction problem.
It should be noted, however, that boundary conditions, such
as the time dependent function of plasma radius, spatial
configuration of the heat flux, distribution of heat flux in the
heat source, and ratios of energy distributed to anode and
cathode, also exert significant influence on the calculation
results. Snoeys and Van Dijck [7,8,23] systematically
analyzed the temperature distribution assuming a circular
heat source with time dependent radius and time
dependent heat flux on a semi-infinite cylinder. The heat
source growth function was obtained from an iterative
calculation of the heat conduction equation by assuming
that the temperature at the center of the heat source
corresponds to the metal boiling temperature at a pressure
equal to an average pressure in the gas bubble calculated
from the thermodynamical model. Good agreement was
found between melting point isothermals calculated and
those measured from the pictures of the cross sections of
craters cut perpendicular to the surface. Since boiling of
superheated metal is suppressed by the bubble pressure
during the discharge duration, the most significant removal
was assumed to be associated with ejection of liquid metal
by bulk boiling inside the normal boiling point isothermal
surface, at the end of the discharge. The calculated
superheated volume agreed well with the measured
material removed per pulse. It was also found that the
metal removal efficiency, which was defined as the ratio of
the ejected to melted volume, was 0.01 to 0.1.
However, with regard to the heat source configuration,
some papers assume a point heat source [16], and many
other papers consider that the diameter of the heat source
is equal to that of the discharge crater generated by the
discharge [6,21,22,28,29]. Although, in most cases, it is
assumed that the heat source is stationary and uniform in
its heat flux, Kunieda et al. [38] measured the arc column
movement in a single pulse discharge and found that both
anode and cathode spots move in the same way and the
area of movement becomes larger with the progress of the
discharge. Their detection method, however, does not yet
allow the measurement of the diameter of the arc column.
About the timing of material removal, there are still different
findings.
Zolotykh
[11]
reported
that
high-speed
photographs showed that most of the metal is ejected due
to boiling of the superheated crater at the end of discharge
when the bubble pressure drops sharply, promoting the
discharge of the gas dissolved in the molten metal. On the
other hand, Yoshida et al. [13] found that metal removed
per pulse in air is almost equal to that in liquid, indicating
that metal removal can occur without a sharp drop of
Figure 17: Energy distribution in EDM process
(I
e:16A,
t
e:100
s , Cu(+) – Cu(-)).
48% 34% 1% 18% 30% 3%
(a) Distribution of discharge energy
(b) Energy distribution in workpiece
Energy into tool electrode Energy into workpiece
Energy into workpiece
Loss due to conduction Total discharge
energy Loss into gap Energy carried away by debris
Loss due to convection and radiation
34%
Figure 17: Energy distribution in EDM process
(I
e:16A,
t
e:100
s , Cu(+) – Cu(-)).
48% 34% 1% 18% 30% 3%
(a) Distribution of discharge energy
(b) Energy distribution in workpiece
Energy into tool electrode Energy into workpiece
Energy into workpiece
Loss due to conduction Total discharge
energy Loss into gap Energy carried away by debris
Loss due to convection and radiation 34% 0 2000 4000 6000 8000 10000
-50 0 50 100 150 200 250 300 350
Gap distance 1.5mm
Discharge duration: 300 s
Tempera
tur
e
K
Time
s
5 s
Figure 18: Plasma temperature at gap center during
and after discharge measured by spectroscopy.
Gap distance 0.5mm
0 2000 4000 6000 8000 10000
-50 0 50 100 150 200 250 300 350
Gap distance 1.5mm
Discharge duration: 300 s
Tempera
tur
e
K
Time
s
5 s
Figure 18: Plasma temperature at gap center during
and after discharge measured by spectroscopy.
25 25
Figure 3.3: Example of Electric Discharge Machine. The tool electrode has a complex form in order to erode the workpiece into a desired shape. As the workpiece is eroded, the tool electrode is fed downward to maintain a constant gap width. [19]
3.2.1MATERIAL REMOVAL IN THE GAP
Several mechanisms may be used to aid in removal of molten material from the
gap. This is required to prevent the buildup of debris on the surface of the electrodes.
Additionally, the presence of debris in the gap results in unpredictable sparking behavior.
In high-frequency rotating electrode processes, centrifugal forces are responsible for
debris expulsion. A constant flow of the dielectric fluid or gas through the gap also aids
in debris removal. This can be provided in cases where the dielectric requires filtration
over the course of the experiment. In instances where the dielectric does not circulate
during the experiment, the tool electrode may be intermittently raised and lowered in a
pulsing-fashion in order to flush debris from the gap. The current research included in
![Figure 3.4: Discharge phenomena in the gap and the expulsion of debris [19] Figure 10: Discharge phenomena in EDM gap](https://thumb-us.123doks.com/thumbv2/123dok_us/8455631.1389314/40.612.93.507.263.468/figure-discharge-phenomena-expulsion-debris-figure-discharge-phenomena.webp)