Modelling Representation Noise in Emotion Analysis using Gaussian
Processes
Daniel Beck
∗Computing and Information Systems
The University of Melbourne, Australia
[email protected]
Abstract
Emotion Analysis is the task of modelling la-tent emotions present in natural language. La-belled datasets for this task are scarce so learn-ing good input text representations is not triv-ial. Using averaged word embeddings is a sim-ple way to leverage unlabelled corpora to build text representations but this approach can be prone to noise either coming from the embed-ding themselves or the averaging procedure. In this paper we propose a model for Emotion Analysis using Gaussian Processes and kernels that are better suitable for functions that ex-hibit noisy behaviour. Empirical evaluations in a emotion prediction task show that our model outperforms commonly used baselines for re-gression.
1 Introduction
The goal of Emotion Analysis is to infer latent emo-tions from textual data (Strapparava and Mihalcea,
2007). This problem has theoretic roots in psycholin-guistics studies such asClore et al.(1987) andOrtony et al.(1987), which aim to understand connections be-tween emotions and words. However, Emotion Anal-ysis also has motivations from an applied perspective, being closely related to Opinion Mining (Pang and Lee,
2008). The main difference is that the latter is usually concerned with coarse polarity predictions, while the former aims at modelling different emotional aspects in a more fine-grained level. Table1shows some ex-amples taken from the “Affective Text” dataset ( Strap-parava and Mihalcea,2007), in which human judges annotate news headlines according to the taxonomy proposed by Ekman(1993). Each label is a score in the [0−100]range, where0 means lack of the cor-responding emotion and100 corresponds to maximal emotional load.
Given the nature of the task and the available datasets, a sensible approach for Emotion Analysis is through regression models that map texts to emotion ∗This work was partially done while the author was at The University of Sheffield, United Kingdom.
scores. This requires the choice of a suitable text repre-sentation so it can be incorporated into a model. Bag-of-words (BOW) are a common approach that works well in the presence of large amounts of data but it is unsuitable for Emotion Analysis datasets since they tend to be scarce.
An alternative is to leverage unlabelled data through the use of word embeddings (Deerwester et al.,1990;
Turian et al., 2010; Mikolov et al., 2013). To obtain a fixed vector representation for a text, one can aver-age the embeddings for each word present in the text. While this method can lose linguistic information such as word order, for some tasks it still gives good empiri-cal performance (Hu et al.,2014;Kenter and de Rijke,
2015). However, word embeddings are known to be prone to noise due to the different contexts captured in the training procedure (Nguyen et al.,2016). This effect can be potentialised by simple averaging proce-dures.
In this work we propose to use Gaussian Processes (GPs) (Rasmussen and Williams, 2006) to develop Emotion Analysis models that capture noisy functions that map text representations to the emotion scores. More specifically, we propose the use of the Mat`ern class of kernels to address this problem. Empirical evaluations show that our approach can outperform simpler out-of-the-box choices commonly employed in regression tasks. Overall, we show that properly moti-vated choices of kernels can bring benefits in prediction performance.
While the focus of this work is on Emotion Analy-sis, the methods proposed here are general and can be applied to other text regression settings.
2 Gaussian Process Regression
In this Section we introduce the basic concepts around GP regression. We follow closely the definition of GPs inRasmussen and Williams(2006).
Let X = {(x1, y1),(x2, y2), . . . ,(xn, yn)} be a
dataset where each x ∈ RD is a D-dimensional in-put andy ∈ Ris its corresponding response variable. A GP prior is defined as a stochastic model over the latent functionf that maps the inputs inXto their
anger disgust fear joy sadness surprise
Storms kill, knock out power, cancel flights 3 9 82 0 60 0
Morrissey may cheer up Eurovision 0 0 2 61 0 10
Archaeologists find signs of early chimps’ tool use 0 0 2 23 0 64
Republicans plan to block Iraq debate 60 17 0 0 37 7
European Space Agency 0 0 0 2 0 0
Table 1: Emotion annotation examples, taken from the Affective Text dataset. Scores are in the[0−100]range.
responding response variables. Formally, f(x)∼ GP(m(x), k(x,x0)),
wherem(x)is themean function andk(x,x0)is the
kernel orcovariancefunction, which describes the co-variance between values off at the different locations ofxandx0. For simplicity, we assumem(x) =0.
The GP prior is combined with a likelihood via Bayes’ rule to obtain a posterior over the latent func-tion:
p(f|X,y) = p(yp|X(y, f|X)p)(f),
whereX and y are the training inputs and response variables, respectively. In regression, we usually as-sume a Gaussian likelihood for y, i.e., each yi =
f(xi) +η, whereη ∼ N(0, σn2)is added white noise. This allows us to have an exact, closed formula so-lution for the posterior, which is itself a Gaussian p(f|X,y) ∼ N(y,K+σ2
nI), whereK is the Gram matrix of kernel evaluations between inputs.
To obtain predictions for an unseen inputx∗we
in-tegrate over all possible values off. Since we assume a Gaussian likelihood for the unseen response variable y∗, we can obtain its distribution exactly,
p(y∗|x∗,X,y) =N(f∗|µ∗, σ∗2)
µ∗=kT∗(K+σ2In)−1y σ2
∗ =k(x∗,x∗)−k∗T(K+σ2In)−1k∗,
where k∗ = [hx1,x∗i,hx2,x∗i, . . . ,hxn,x∗i] is the
vector of kernel evaluations between the unseen input and each training input.
Choosing an appropriate kernel is a crucial step in defining a GP model. One common choice is to employ the squared exponential (SE) kernel,1
kSE(x,x0) =σvexp(−r2
2),
wherer2=XD
i=1
(xi−x0i)2 `2
is the scaled distance between the two inputs,σv is a scale hyperparameter and ` is a lengthscale hyperpa-rameter.
The SE kernel is vastly used not only in GP models but also in Support Vector Machines (SVMs) since it is
1Also known as Radial Basis Function (RBF) kernel.
a simple way to have a flexible non-linear model over the data. However, from a GP perspective it assumes the process is infinitely mean-square differentiable.2 In
practice, this means the resulting GP encodes functions with strong smoothness, which is not an ideal property in the presence of high amounts of noise.
2.1 Mat`ern kernels
Mat`ern kernels (Rasmussen and Williams,2006, Sec. 4.2.1) are an alternative class of kernels that relax the smoothness assumptions made by the SE kernels. For-mally, they define GPs which areν-times mean-square differentiable only. Common values forνare the half-integers3⁄2and5⁄2, resulting in the following kernels:
kMat32(x,x0) =σv(1 +√3r2) exp(−√3r2)
kMat52(x,x0) =σv
1 +√5r2+5r2
3
exp(−√5r2).
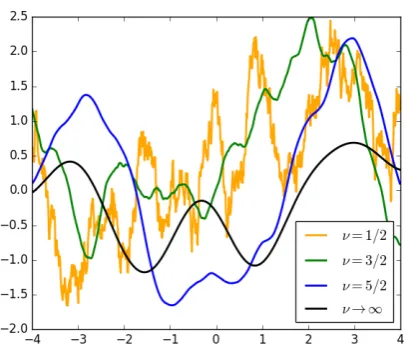
Higher values for ν are usually not very useful since the resulting behaviour is hard to distinguish from limit caseν → ∞, which retrieves the SE kernel.
On Figure1 we plot samples from three GP priors with Mat`ern kernels with different values forν. We can see that lower values forν result in noisier func-tions. When ν =1⁄2 we recover a simple exponential
kernel, equivalent to Brownian motion in one dimen-sion (Rasmussen and Williams,2006, Sec. 4.2). The Mat`ern class of kernels allows us to find a compromise between full noise behaviour and extreme smoothness, as in the case of SE.
2.2 Hyperparameter Optimisation
Most kernels rely on appropriate choices of hyper-parameters, a problem of model selection. In non-Bayesian approaches such as SVMs, an usual approach for this is grid search, where we evaluate a set of val-ues on a development set and choose the one with best performance. This approach can be brittle as values are constrained to the grid. It also does not scale well with the number of hyperparameters.
GPs have an elegant way to perform model selection: maximising the (log) marginal likelihood with respect
2Mean-square differentiability is a commonly used
Figure 1: Sample functions from Mat`ern kernels with different values forν. The black line is equivalent to a sample from an SE kernel.
to the training data,
logp(y|X,θ) =−yTK¯2−1y−log2|K¯| −nlog 22 π,
whereK¯ =K+σ2Inandθrepresents the set of
hyper-parameters (such as the lengthscale`and the bias term b). The main advantage of this method is that we can define gradients of the marginal likelihood and employ gradient ascent optimisers, which are much faster than grid and random search.
Another advantage of this method is that it obviates the need of a validation set, making full use of the whole available training data. To understand why, we can inspect the terms of the marginal likelihood for-mula: the first one is the data-fit term and it is the only one that depends on the outputs; the second one is the complexity penalty, which depends only on the inputs and the third one is a normalisation constant. In-tuitively, the optimisation procedure balances between complex models that highly fit the data and simple models that give a lower complexity penalty, prevent-ing overfittprevent-ing.
3 Experiments
We performed a set of experiments using two freely available datasets for Emotion Analysis, in order to as-sess our proposed models.3
3.1 Data and Preprocessing
The first dataset was employed in the SemEval2007 Affective Text shared task (Strapparava and Mihalcea,
2007) and is composed of a set of news headlines man-ually annotated by human judges.4 We combined the
3Code to replicate all experiments in this section
is available at https://github.com/beckdaniel/ ijcnlp17_emo
4Available atweb.eecs.umich.edu/˜mihalcea/
downloads.html#affective
official “dev” and “test” sets from the shared task into a single dataset containing 1,250 instances in total.
To put our models in perspective with the state-of-the-art, we also tested them in the recently re-leased dataset for the WASSA2017 workshop shared task (Mohammad and Bravo-Marquez,2017b).5 The
dataset is composed of tweets annotated with four of the six Ekman emotions (anger, fear, joyandsadness), with ratings originally provided by Best-Worst Scal-ing and transformed into values in the [0−1] inter-val (Mohammad and Bravo-Marquez,2017a). Unlike SemEval2007, this dataset has different instances per emotion. We combined the official “train” and “dev” sets and use that as our full training set, for each emo-tion.
All texts were tokenised6, lowercased and we used
100-dimensional GloVe embeddings (Pennington et al.,
2014) to represent each word7. To obtain a fixed vector
representation for each headline we used the average of its word embeddings, ignoring out-of-vocabulary words.
3.2 Models
We compared the performance of the proposed Mat`ern kernels with models based on linear and SE kernels. All GP models have hyperparameters optimised using 100 iterations of L-BFGS. Our implementation is based on the GPy toolkit.8
We also compared our approach with two non-Bayesian approaches commonly used in the literature, ridge regression and support vector regression (SVR) with an SE kernel. For these models we used grid search to optimise hyperparameters. The grid search procedure uses 3-fold cross-validationwithin the train-ing set, using two folds for training and one fold as a development set. Hyperparameter values are selected by averaging the best results obtained for each fold. We use the scikit-learn toolkit (Pedregosa et al.,2011) as our underlying implementation. The hyperparameter grid for each model is shown on Table2.
Ridge
λ(regularisation coefficient) [0.01,0.1,1,10,100]
SVR
C(error penalty) [0.01,0.1,1,10,100]
(margin size) [0.001,0.01,0.1,1,10]
`(SE kernel lengthscale) [0.01,0.1,1,10,100]
Table 2: Hyperparameter grids for the non-Bayesian baselines.
5Availabe at http://saifmohammad.com/
WebPages/EmotionIntensity-SharedTask. html
6We used the NLTK (Bird et al.,2009) PTB tokeniser. 7We used the GloVe version trained on a combination
of Wikipedia and Gigaword, available atnlp.stanford. edu/projects/glove
3.3 Evaluation
We evaluated our models using Pearson’srcorrelation measure and Negative Log Predictive Density (NLPD) (Qui˜nonero-Candela et al., 2006). Pearson’s r is the main metric used in previous work in Emotion Analy-sis and also other regression tasks. NLPD corresponds to the likelihood of the test label given the correspond-ing predictive distribution and it is a common way to compare GP models. It is not applicable for models that give point estimates as predictions (such as SVR) but it is useful when information about the predictive distributions is available. Higher Pearson’srand lower NLPD correspond to better performance.
For the SemEval2007 dataset we performed our ex-periments using 10-fold cross-validation and average the results. For the WASSA2017 dataset, we tested the performance on the official “test” sets for each emotion to make results comparable with the original shared task submissions.
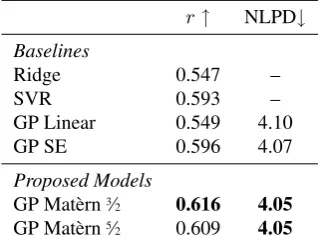
3.4 Results on SemEval2007
Table3shows the results for all models, averaged over the emotions. We can see that both models based on Mat`ern kernels outperformed the baselines. Within the Mat`ern models there is a slight preference over the Mat`ern 3⁄2 in terms of Pearson’s r but it is not
signi-GP Linear 0.549 4.10
GP SE 0.596 4.07
Proposed Models
GP Mat`ern3⁄2 0.616 4.05
GP Mat`ern5⁄2 0.609 4.05
Table 3: Results on SemEval2007, averaged over all emotions and all 10 cross-validation folds.
In Table4we discriminate the results over each par-ticular emotion, where we observe some interesting phenomena. Forjoywe can see that a linear GP shows higher Pearson’srcompared to a GP with an SE kernel. To investigate this we inspected the individual folds for the GP SE model and we found out one of the models ended up with very low lengthscale, which resulted in an interpolation behaviour leading to overfitting. The Mat`ern models did not suffer from this.
The emotion where we see the least gains from our proposed models is fear, which is also the one with higher absolute correlation in all models. This might be a case of diminishing returns, where we do not see much gains from using a more involved kernel because the emotion is already well explained by simpler mod-els.
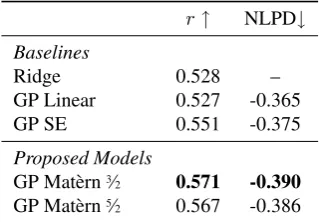
3.5 Results on WASSA2017
Table5 shows the results for WASSA2017, averaged over all emotions/datasets. We see similar trends to the SemEval2007 results, with the Mat`ern kernels outper-forming the baselines and a small preference for the Mat´ern3⁄2variant.
On Table6we compare our models with the official shared task baseline and the wiining submission. The Mat`ern3⁄2model would be placed in 11th place of a
to-tal of 22 submissions, which is a promising result con-sidering that it can be applied to other feature sets be-yond word embeddings. To show this, we train another model using the 300 dimensional version of GloVe em-beddings, which gives further gains in terms of Pear-son’sr, reaching 10th place in the official results.
The best performing submissions at this shared task used a range of other features beyond word embed-dings, such as emotion lexicons and character ngrams. For future work, we plan to apply our models to these feature sets to check if they can also benefit from the flexibility coming from Mat`ern kernels.
4 Related Work
Emotion Analysis has been studied in other domains beyond News headlines. Alm et al. (2005) studied emotions in the context of children’s fairy tales and de-veloped a corpus annotated at the sentence level. They use coarse-grained labels, which account for the pres-ence or abspres-ence of emotions in each sentpres-ence. Mihal-cea and Strapparava(2012) focused on analysing emo-tions from music, combining information from song lyrics and melody notes. They consider more fine-grained labels in this work and show promising results. The work ofBeck et al. (2014) is similar to ours, which focuses on applying multi-task GPs to encode interactions between emotions. Unlike our approach, they use a simple bag-of-words representation and an SE kernel as the underlying GP model. Compared to our model, they show much lower correlation scores (their best model achieves 0.399 Pearson’s r on the SemEval2007 dataset), although these are not strictly comparable since they use different data splits and do not perform cross-validation. However, their approach is orthogonal to ours: combining the Mat´ern kernels within a multi-task GP framework can be a promising avenue for future work.
Anger Disgust Fear Joy Sadness Surprise
r NLPD r NLPD r NLPD r NLPD r NLPD r NLPD
Baselines
Ridge 0.584 – 0.445 – 0.680 – 0.539 – 0.636 – 0.399 –
SVR 0.632 – 0.510 – 0.732 – 0.558 – 0.687 – 0.438 –
GP Linear 0.587 3.94 0.449 3.81 0.681 4.16 0.539 4.35 0.636 4.31 0.404 4.06
GP SE 0.638 3.92 0.515 3.80 0.737 4.08 0.531 4.33 0.693 4.25 0.462 4.03
Proposed models
GP Mat`ern3⁄2 0.650 3.90 0.540 3.76 0.740 4.07 0.595 4.29 0.700 4.24 0.472 4.03
GP Mat`ern5⁄2 0.647 3.91 0.533 3.78 0.740 4.08 0.592 4.29 0.698 4.24 0.445 4.01
Table 4: Emotion specific results for SemEval2007.
r↑ NLPD↓ Baselines
Ridge 0.528 –
GP Linear 0.527 -0.365
GP SE 0.551 -0.375
Proposed Models
GP Mat`ern3⁄2 0.571 -0.390
GP Mat`ern5⁄2 0.567 -0.386
Table 5: Results for WASSA2017, using the official test set provided at the shared task.
r↑ Proposed Models
GP Mat`ern3⁄2 0.571
GP Mat`ern3⁄2+ 300d embs 0.627
Shared task submissions
Best baseline 0.660
Winning submission 0.747
Table 6: Comparison with other WASSA 2017 shared task submissions.
5 Conclusions
Emotion Analysis is a task that relies on scarce, noisy and potentially biased datasets. The use of word em-beddings can help tackle sparsity problems but furthers add noise to the data being modelled. In this paper we proposed a Gaussian Process approach for Emo-tion Analysis that can better incorporate these aspects. Empirical findings showed that noisy behaviour can be better modelled by Mat`ern kernels compared to other commonly used kernels in the literature.
An interesting avenue for future work is to address noise and bias in the response variables as well. For the kind of labels we employ in Emotion Analysis, a possible extension is to remove the Gaussian constraint and employ different likelihoods, such as a Beta distri-bution over the scale limits, for instance. This how-ever makes the model intractable and approximation schemes (such as the one proposed byOpper and Ar-chambeau (2008)) should be employed. Finally, we
also plan to apply the ideas showed here to other NLP problems with similar settings. In particular, we be-lieve the proposed approach can be useful in any set-ting where (noisy) embeddings should be mapped to manually provided scores.
Acknowledgements
Daniel Beck was supported by funding from CNPq/Brazil (No. 237999/2012-9) and from the Australian Research Council (DP #160102686). The author would also like to thank the anonymous reviewers for their comments.
References
Cecilia Ovesdotter Alm, Dan Roth, and Richard Sproat. 2005.Emotions from text: machine learning for text-based emotion prediction. InProceedings of EMNLP, pages 579–586.
Daniel Beck, Trevor Cohn, and Lucia Specia. 2014. Joint Emotion Analysis via Multi-task Gaussian Pro-cesses. In Proceedings of EMNLP, pages 1798– 1803.
Daniel Beck, Lucia Specia, and Trevor Cohn. 2016. Exploring Prediction Uncertainty in Machine Trans-lation Quality Estimation. In Proceedings of CoNLL.
Steven Bird, Ewan Klein, and Edward Loper. 2009. Natural Language Processing with Python. O’Reilly Media.
Gerald L. Clore, Andrew Ortony, and Mark A. Foss. 1987. The psychological foundations of the affec-tive lexicon. Journal of Personality and Social Psy-chology, 53(4):751–766.
Trevor Cohn and Lucia Specia. 2013. Modelling An-notator Bias with Multi-task Gaussian Processes: An Application to Machine Translation Quality Estima-tion. InProceedings of ACL, pages 32–42.
Paul Ekman. 1993. Facial Expression and Emotion. American Psychologist, 48(4):384–392.
Baotian Hu, Zhengdong Lu, Hang Li, and Qingcai Chen. 2014. Convolutional Neural Network Archi-tectures for Matching Natural Language Sentences. InProceedings of NIPS, pages 2042–2050.
Tom Kenter and Maarten de Rijke. 2015. Short Text Similarity with Word Embeddings Categories and Subject Descriptors. InProceedings of CIKM, pages 1411–1420.
Vasileios Lampos, Nikolaos Aletras, Daniel Preoiuc-Pietro, and Trevor Cohn. 2014. Predicting and Char-acterising User Impact on Twitter. InProceedings of EACL, pages 405–413.
Michal Lukasik, Trevor Cohn, and Kalina Bontcheva. 2015. Point Process Modelling of Rumour Dynam-ics in Social Media. InProceedings of ACL, pages 518–523.
Rada Mihalcea and Carlo Strapparava. 2012. Lyrics, Music, and Emotions. InProceedings of the Joint Conference on Empirical Methods in Natural guage Processing and Computational Natural Lan-guage Learning, pages 590–599.
Tomas Mikolov, Ilya Sutskever, Kai Chen, Greg Cor-rado, and Jeffrey Dean. 2013.Distributed Represen-tations of Words and Phrases and their Composition-ality. InProceedings of NIPS, pages 1–9.
Saif M. Mohammad and Felipe Bravo-Marquez. 2017a.
Emotion Intensities in Tweets. In Proceedings of *SEM.
Saif M. Mohammad and Felipe Bravo-Marquez. 2017b. WASSA-2017 Shared Task on Emotion In-tensity. InProceedings of WASSA.
Kim Anh Nguyen, Sabine Schulte im Walde, and Ngoc Thang Vu. 2016.Neural-based Noise Filtering from Word Embeddings. InProceedings of COL-ING, pages 2699–2707.
Manfred Opper and C´edric Archambeau. 2008.
The Variational Gaussian Approximation Revisited. Neural Computation, 21(3):786–792.
Andrew Ortony, Gerald L. Clore, and Mark A. Foss. 1987. The Referential Struture of the Affective Lex-icon. Cognitive Science, 11:341–364.
Bo Pang and Lillian Lee. 2008. Opinion Mining and Sentiment Analysis. Foundations and Trends in In-formation Retrieval, 2(1-2):1–135.
Fabian Pedregosa, Ga¨el Varoquaux, Alexandre Gram-fort, Vincent Michel, Bertrand Thirion, Olivier Grisel, Mathieu Blondel, Peter Prettenhofer, Ron Weiss, Vincent Duborg, Jake Vanderplas, Alexan-dre Passos, David Cournapeau, Matthieu Brucher, Matthieu Perrot, and ´Edouard Duchesnay. 2011. Scikit-learn: Machine learning in Python. Journal of Machine Learning Research, 12:2825–2830.
Jeffrey Pennington, Richard Socher, and Christo-pher D. Manning. 2014. GloVe: Global Vectors for Word Representation. In Proceedings of EMNLP, pages 1532–1543.
Daniel Preoiuc-Pietro and Trevor Cohn. 2013. A tem-poral model of text periodicities using Gaussian Pro-cesses. InProceedings of EMNLP, pages 977–988. Joaquin Qui˜nonero-Candela, Carl Edward Rasmussen,
Fabian Sinz, Olivier Bousquet, and Bernhard Sch¨olkopf. 2006. Evaluating Predictive Uncertainty Challenge. MLCW 2005, Lecture Notes in Computer Science, 3944:1–27.
Carl Edward Rasmussen and Christopher K. I. Williams. 2006. Gaussian processes for machine learning, volume 1. MIT Press Cambridge.
Kashif Shah, Trevor Cohn, and Lucia Specia. 2013. An Investigation on the Effectiveness of Features for Translation Quality Estimation. InProceedings of MT Summit XIV.
Carlo Strapparava and Rada Mihalcea. 2007. SemEval-2007 Task 14 : Affective Text. In Proceedings of SemEval, pages 70–74.
![Table 1: Emotion annotation examples, taken from the Affective Text dataset. Scores are in the [ 0 −100] range.](https://thumb-us.123doks.com/thumbv2/123dok_us/800037.1094138/2.595.65.525.63.148/table-emotion-annotation-examples-taken-affective-dataset-scores.webp)