University of South Carolina
Scholar Commons
Theses and Dissertations
1-1-2013
Illness-Related Diabetes Social Support and
Glycemic Control Among Middle Aged and Older
Adults
Favel Leah Mondesir
University of South Carolina
Follow this and additional works at:https://scholarcommons.sc.edu/etd
Part of theEpidemiology Commons
This Open Access Thesis is brought to you by Scholar Commons. It has been accepted for inclusion in Theses and Dissertations by an authorized administrator of Scholar Commons. For more information, please [email protected].
Recommended Citation
ILLNESS-RELATED DIABETES SOCIAL SUPPORT AND GLYCEMIC CONTROL AMONG MIDDLE AGED AND OLDER ADULTS
by
Favel L. Mondesir
Bachelor of Science
South Carolina State University, 2010
Submitted in Partial Fulfillment of the Requirements
For the Degree of Master of Science in Public Health in
Epidemiology
The Norman J. Arnold School of Public Health
University of South Carolina
2013
Accepted by:
Kellee White, Director of Thesis
Angela Liese, Reader
Alexander McLain, Reader
ii
iii
DEDICATION
I dedicate this thesis to my mother, Cecilia Mondesir. Your support,
iv
ACKNOWLEDGEMENTS
This thesis would not be possible without the patience, assistance and
encouragement of my director of thesis, Dr. Kellee White. I owe a debt of
gratitude to her for her dedication, support and guidance during my master’s
program of study. Her roles as my academic advisor, supervisor and director of
thesis were instrumental in helping me achieve my goals.
I am also grateful to Dr. Angela Liese for her assistance and direction
throughout the course of my thesis and Dr. Alexander McLain for sharing his
statistical expertise.
I would like to acknowledge Dr. Merchant for assisting me in working on
the directed acyclic graph for my master’s thesis and Drs. Linda Hazlett, Jihong
Liu and Jiajia Zhang for their unfailing help as I matriculated through my master’s
v
ABSTRACT
Objective
The objective of this study is to investigate the association between
illness-related diabetes social support (IRDSS) and glycemic control (GC) among a
racially diverse sample of middle aged and older adults. In gender-stratified
models we examine whether the relationship between IRDSS and GC is modified
by race/ethnicity. Additionally, we explore the association between eight
individual types of IRDSS and GC.
Methods
We used the Health and Retirement Study (HRS) 2002 and the 2003 Diabetes
Survey. The final analytic sample consisted of 914 study respondents.
Gender-stratified multivariable logistic regression models were used to calculate odd
ratios (ORs) and 95% confidence intervals (CIs) for the association between
IRDSS and GC, test an interaction between race/ethnicity and IRDSS, and
investigate the association between individual IRDSS variables and GC. Final
models were adjusted for socio-demographic characteristics, lifestyle factors and
clinical characteristics.
Results
79.5% and 76.7% of males and females respectively are classified as having
vi
between IRDSS and GC (OR: 2.39; 95% CI: 1.44, 4.00), but no significant
association was observed among males. There was a significant interaction
between race/ethnicity and IRDSS (p-value < 0.10). Among Hispanic females,
there was a higher odds (OR: 5.75; 95% CI: 1.01, 32.63) of adequate glycemic
control in those who had high levels of IRDSS. The strongest association was
found between high levels of emotional oriented social support and GC among
females (OR=2.05; 95% CI: 1.18, 3.54).
Conclusion
Our findings suggest that the relationship between IRDSS and GC varied by
gender, where we only observed an association among females. Although we
found a significant interaction between Hispanic race/ethnicity and IRDSS among
females, our results should be interpreted with caution due to small sample sizes
for the groups. We found that type of social support for self-care activities may
play a role in achieving GC, where emotional support was most important.
Further studies should aim at identifying factors which may determine gender
differences in the association between IRDSS and GC. Race/ethnicity as an
effect modifier of this association also needs further exploration in studies with
vii
TABLE OF CONTENTS
DEDICATION ... III
ACKNOWLEDGEMENTS ...IV
ABSTRACT ... V
LIST OF TABLES ...IX
LIST OF FIGURES ... X
LIST OF ABBREVIATIONS ...XI
CHAPTER 1: INTRODUCTION ... 1
CHAPTER 2: LITERATURE REVIEW ... 3
2.1 PUBLIC HEALTH SIGNIFICANCE ... 3
2.2 SOCIAL SUPPORT ... 5
2.3 SOCIAL SUPPORT AND GLYCEMIC CONTROL ... 6
2.4 RACIAL/ETHNIC DIFFERENCES IN SOCIAL SUPPORT AND GLYCEMIC CONTROL ... 7
2.5 THE IMPORTANCE OF ILLNESS-RELATED DIABETES SOCIAL SUPPORT ... 9
CHAPTER 3: METHODS ... 13
3.1 AIM AND RESEARCH QUESTIONS ... 13
3.2 DATA SOURCE ... 14
viii
3.4 DEFINITION OF VARIABLES ... 17
3.5 STATISTICAL ANALYSIS ... 22
CHAPTER 4: RESULTS ... 25
CHAPTER 5: DISCUSSION ... 53
5.1 ASSOCIATION BETWEEN ILLNESS-RELATED DIABETES SOCIAL SUPPORT AND GLYCEMIC CONTROL ... 53
5.2 RACE/ETHNICITY AS AN EFFECT MODIFIER OF THE RELATIONSHIP BETWEEN ILLNESS-RELATED DIABETES SOCIAL SUPPORT AND GLYCEMIC CONTROL ... 59
5.3 ASSOCIATION BETWEEN INDIVIDUAL ILLNESS-RELATED DIABETES SOCIAL SUPPORT VARIABLES AND GLYCEMIC CONTROL ... 60
5.4 STRENGTHS AND LIMITATIONS ... 62
5.5 CONCLUSION ... 64
REFERENCES ... 66
ix
LIST OF TABLES
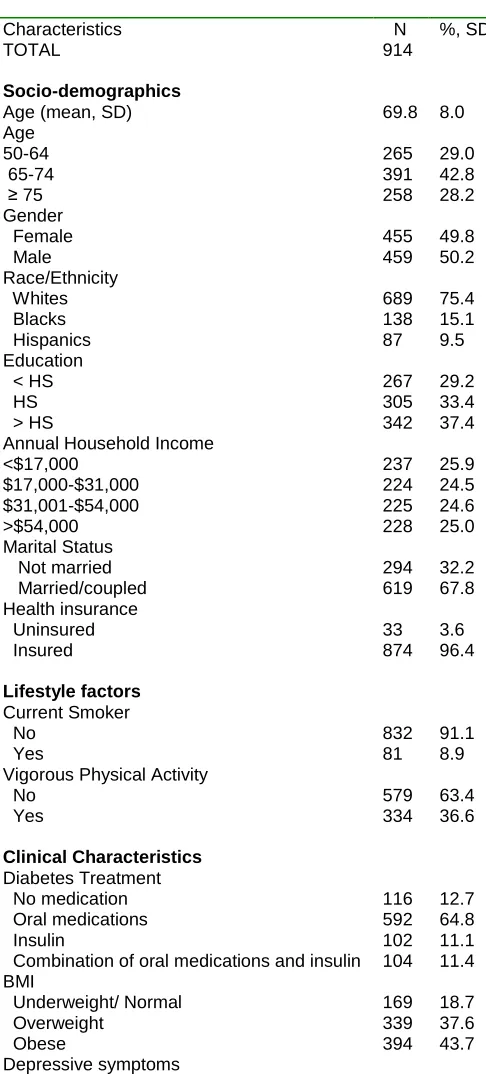
Table 4.1. Socio-demographic, lifestyle, and clinical characteristics of the study sample of individuals with diabetes, Health and Retirement Study, 2002 and 2003 Diabetes Survey ... 34
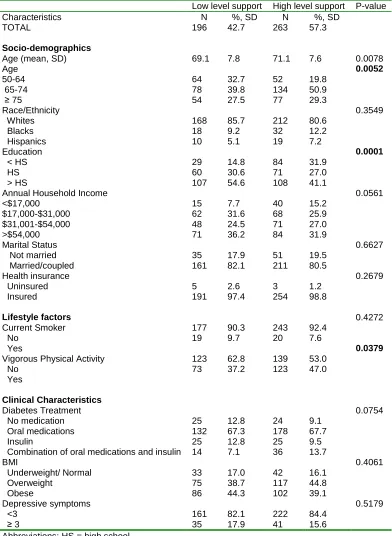
Table 4.2. Sample characteristics by levels of illness-related diabetes social support among males ... 36
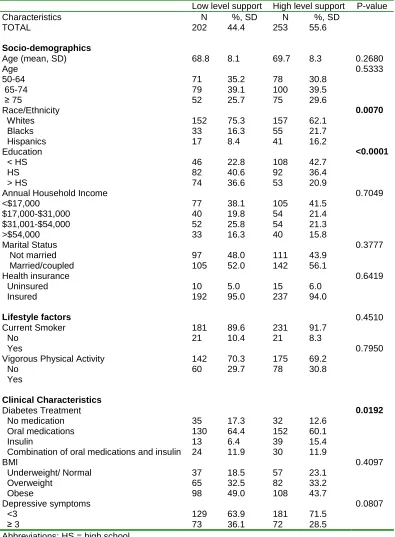
Table 4.3. Sample characteristics by levels of illness-related diabetes social support among females ... 37
Table 4.4. Sample characteristics by glycemic control among males ... 38
Table 4.5. Sample characteristics by glycemic control among females ... 39
Table 4.6. Crude and adjusted odds ratios (OR) and 95% confidence intervals (CI) of the associations of illness-related diabetes social support and other
respondent characteristics with adequate glycemic control among males ... 46
Table 4.7. Crude and adjusted odds ratios (OR) and 95% confidence intervals (CI) of the associations of illness-related diabetes social support and other
respondent characteristics with adequate glycemic control among females ... 48
Table 4.8. Adjusted model with odds ratios (OR) and 95% confidence intervals (CI) of the associations of illness-related diabetes social support with adequate glycemic control among females stratified by race/ ethnicity ... 50
Table 4.9. Crude and adjusted models with odds ratios (OR) and 95%
x
LIST OF FIGURES
Figure 2.1. Conceptual Model ... 10
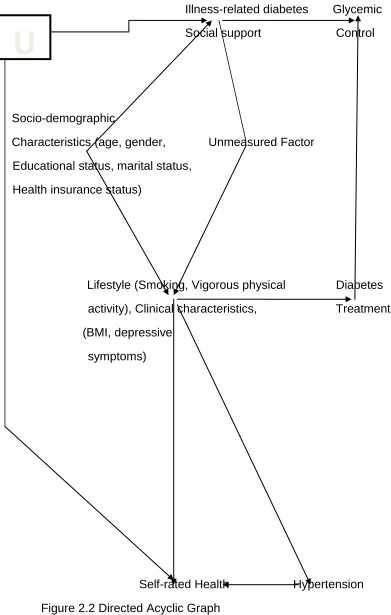
Figure 2.2. Directed Acyclic Graph ... 11
Figure 4.1. Percentage of males with a high level of illness-related diabetes social support (IRDSS) for lifestyle modification activities (following meal plan, getting enough physical activity, weight control) by race/ethnicity ... 40
Figure 4.2. Percentage of males with a high level of illness-related diabetes social support (IRDSS) for medically oriented activities (taking medication, testing blood sugar, going to the doctor or nurse to keep appointments, foot care) by race/ethnicity ... 41
Figure 4.3. Percentage of males with a high level of illness-related diabetes social support (IRDSS) for emotional support oriented activity (handling feelings about diabetes) among by race/ethnicity ... 42
Figure 4.4. Percentage of females with a high level of illness-related diabetes social support (IRDSS) for lifestyle modification activities (following meal plan, getting enough physical activity, weight control) by race/ethnicity ... 43
Figure 4.5. Percentage of females with a high level of illness-related diabetes social support (IRDSS) for medically oriented activities (taking medication, testing blood sugar, going to the doctor or nurse to keep appointments, foot care) by race/ethnicity ... 44
xi
LIST OF ABBREVIATIONS
BRFSS ... Behavioral Risk Factor Surveillance System
CDC ... Centers for Disease Control and Prevention
CI ... Confidence Interval
HbA1c ... Glycosylated hemoglobin A1c
HRS ... Health and Retirement Study
HS ... High School
IRDSS ... Illness-related diabetes social support
GC ... Glycemic Control
NHANES ... National Health and Nutrition Examination Survey
OR ... Odds Ratio
SAS ... Statistical Analysis Software
SD ... Standard Deviation
1
CHAPTER 1
INTRODUCTION
Diabetes is a highly prevalent chronic disease and it has been estimated
that 25.8 million (8.3%) of the American population has diabetes (1). This
resulted in estimated direct and indirect diabetes health care costs of $174 billion
in 2007 (1-3). The prevalence of diabetes has increased from 2000 to 2010
particularly among middle-aged and older adults: from 8.6% to 12.3% in those
aged 45- to 64; 15.4 % to 20.7% in those aged 65 to 74; and 13.0% to 20.1% in
those aged 75 and over (4). Uncontrolled diabetes results in poorer health
status, increased morbidity, disability, and mortality (5-9). Adequate diabetes
management which entails performing diabetes related self-care activities such
as following meal plans, taking medication, taking care of their feet, getting
enough physical activity, testing blood glucose and going to the doctor or nurse
to keep appointments is critical for minimizing complications (5). However,
optimal control of diabetes remains a public health and clinical challenge. Only
44% of adults with diabetes have their diabetes controlled (10). Socio-economic
status, access to health care, treatment adherence and disease severity partially
explain the reasons for poor diabetes management and ethnic differences in
management. However, it is possible that psychosocial factors such as social
support may advance our understanding of racial/ethnic disparities in diabetes
2
Social support has been shown to be positively associated with glycemic
control. For example, some studies have demonstrated that social support is
positively associated with improvements in self-care activities, following
treatment regimens, increasing exercise and reducing smoking (11-13).
Additionally, a positive association between social support and improved blood
pressure and reductions in heart disease has also been observed (1, 12, 13).
Further, evidence shows that the association between improved diabetes
outcomes and social support is stronger for illness-related diabetes social
support in comparison to general social support. However, there is a scarcity of
studies which focus on the association between illness-related diabetes social
support and glycemic control.
It is possible that the clarification of these relationships will help shed light
on factors that account for disparities in diabetes management among older
adults. These mechanisms required greater clarity and comprehension so that
interventions aimed at diabetes management can be better tailored. Therefore,
this thesis sought to investigate the association between illness-related diabetes
social support and glycemic control among a racially diverse sample of middle
aged and older adults. More specifically, we explored whether the relationship
between illness-related diabetes social support and glycemic control was
modified by race/ethnicity. Further, we investigated whether the association
between individual illness-related diabetes social support for different self-care
3
CHAPTER 2
LITERATURE REVIEW
2.1 PUBLIC HEALTH SIGNIFICANCE
Diabetes is the seventh leading cause of death in the US (14, 15). It
contributes to substantial morbidity, disability, lowered quality of life, and high
economic and health care expenditures (10). Furthermore, diabetes is a leading
cause of cardiovascular disease, stroke, non-traumatic lower limb amputations,
blindness, end-stage renal disease, suffering, and lost productivity (3, 10, 16,
17). The incidence, prevalence and mortality of diabetes and its complications,
especially cardiovascular disease complications are higher with older age (5, 6,
15). Approximately 23% of middle-aged and older adults in the US have type 2
diabetes (18). The prevalence of diabetes varies by race/ethnicity, where blacks
and Hispanics have higher disease prevalence in comparison to whites (17, 19).
Adequate diabetes management is of great importance in order for people to
improve their health and reduce morbidity and complications. There is currently
no cure for diabetes but it can be managed through checkups, medication, and
self-care activities (14). Self-management is concerned with activities carried out
by individuals to control their diabetes such as following a meal plan, taking
4
blood sugar, going to the doctor or nurse, keeping their weight under control and
handling their feelings about diabetes. These activities serve to reduce the
detrimental effect of diabetes on physical health and functioning. This in turn
helps these individuals deal with the psychosocial sequelae of diabetes (20). It
has been found that adequate self-management of diabetes is connected to
achieving improvements in complete physical and psychological health outcomes
(20).
The performance of diabetes self-care activities is known to be associated
with better glycemic control (21). Glycosylated hemoglobin A1c (HbA1c) is used
to measure control of blood glucose. It is an indicator of glycemic
concentrations over the past 3 months (10). For adults with diabetes, the
American Diabetes Association (ADA) recommends that HbA1c levels be less
than 7% (10). For older adults with diabetes duration of at least 10 years, other
comorbidities and use of combined medications for treatment of diabetes
including insulin, Kirkman and associates have recommended that HbA1c levels
be less than 8% (22). High glycemic concentration has been associated with
increased risk of developing diabetes related macrovascular and microvascular
complications (23). The risk of deaths from macrovascular complications in
individuals with diabetes is two to four times the risk in individuals without
diabetes after adjusting for age and gender (16). Glycemic control has been
shown to be difficult to achieve among many individuals with diabetes (3, 10).
5
this can reduce the risk of cardiovascular complications and mortality (10, 15,
24).
Diabetes management and glycemic control are known to vary by
race/ethnicity. One recent study showed that 36.9% of blacks, 35.4% of
Hispanics, and 48.6% of whites had their diabetes controlled (10). The disparities
in diabetes control may also account for racial/ethnic disparities in diabetes
complications. These disparities are still observed even after adjusting for
socio-demographic, clinical characteristics, medication use and other co-morbidities
(3, 8, 10, 17, 19, 25-30). Some ethnic minority groups may have at most a 50
percent higher rate of diabetes complications compared to all individuals with
diabetes (31). Therefore, identifying factors that may help improve glycemic
control can ultimately reduce the burden of these complications.
2.2 SOCIAL SUPPORT
Prior research has shown that achieving optimal management of diabetes is
better facilitated if individuals have high levels of social support. Social support
involves having a feeling that one is loved and cared for and is part of a network
which may involve parents, relatives, friends, a spouse, or social and community
contacts within churches and clubs (32). There are four subtypes: emotional
support (caring, loving, reassuring, respect); appraisal support (stress-related
help); informational support (giving advice); and tangible assistance or
practical-instrumental support (material or other practical help such as services, financial
6
published research related to cardiovascular disease (34). However, research
shows that practical-instrumental support has a stronger correlation with
treatment adherence for chronic diseases compared to emotional support (21,
35). Family members and significant others have a significant part to play in
terms of providing support and practical help in the management of diabetes
(36).
2.3 SOCIAL SUPPORT AND GLYCEMIC CONTROL
Social support is important in the management of diabetes. Studies have
shown that social support results in increased knowledge, understanding and
awareness of diabetes (37) as well as improved glycemic control (24, 37).
Several studies have found a positive association between social support and
glycemic control (24, 27, 37). One of the studies also found that when individuals
with diabetes perceive greater support, they achieve better diabetes
management (27). It was also stated that lack of social support results in poor
diabetes self- management (20).
Social support may operate in two ways to have a positive influence on
optimal diabetes management. It may have a direct effect or an indirect
(buffering) effect (32). The direct effect results in the promotion of better health in
diabetes patients because of the perceived presence of social support (1, 32).
The buffering effect acts during stressful situations such as times of illness (1, 32,
7
and change in behavior (32, 35). It has further been shown that greater social
support is a predictor of lowered depression (27, 35, 38).
Social support is also associated with treatment adherence. Adherence to
treatments may be a mediator of the relationship between social support and
health outcomes (35) such as glycemic control.
On the other hand, it has also been found that there is no significant
association between social support and glycemic control or self-care activities.
Some studies have found that social support does not significantly predict
HbA1c levels or glycemic control and that family support is not associated with
adherence to health-promoting activities and diabetes self-care (20, 33, 39).
These contrasting results suggest the need for further investigation into the role
of social support in diabetes management as it relates to glycemic control.
Further inconsistencies were found in a review of controlled intervention
studies. The review found that social support from peers may lead to
improvements in lifestyle activities which then lead to better diabetes care (32).
However, this same review also found that participation of family and friends in
diabetes education groups had no association with diabetes control (32).
2.4 RACIAL/ETHNIC DIFFERENCES IN SOCIAL SUPPORT AND GLYCEMIC
CONTROL
Differences also exist in the subtypes and sources of social support and the
relationship with glycemic control by race/ ethnicity (33). The way social support
8
American populations (24, 33). Prior studies have shown that achieving diabetes
self-care activities and adequate glycemic control in African Americans is more
successful in “informal” social networks compared to whites (17, 24, 30, 33). It
was noted that certain economic and cultural factors may result in large
households of African Americans (33). This means that there are high levels of
social support and blacks tend to rely heavily on this (30, 33). Additionally, social
support from African American church congregations, result in an increase in
health promoting behaviors (33). Research has also shown that social support
was negatively associated with HbA1c levels in whites but no association was
found between race/ ethnicity and self-care behaviors related to diabetes (30). In
another study by Rees and colleagues, no association was found between social
support and race (30). Additionally, one study found that there was no significant
association between social support and diabetes self-care in Caucasians and
African Americans but this study had a small sample size (39).
Further, it has been found that in comparison to whites, social support
predicts better clinical outcomes and improvements in self-care behaviors in
blacks (1). Conversely, whites were found to have improved low-density
lipoprotein (LDL) levels compared to blacks (1). For Hispanics, there were no
9
2.5 THE IMPORTANCE OF ILLNESS-RELATED DIABETES SOCIAL
SUPPORT
The previous discussion highlighted that social support may have a positive
impact on management of diabetes and glycemic control through improvements
in self-care, diet, medication adherence, physical activity, disease control and
lowered risk of mortality (13, 18, 20, 27, 30, 37, 40) . It is important to note that
many studies make use of the general term “social support” to refer to different
sources of social support including peer support, support from family and friends,
support from couples/ spouse or even support from nurse managers (1) and to
refer to the different subtypes of social support discussed previously.
However, there is a scarcity of studies which specifically mention,
“illness-related diabetes social support,” “regimen specific social support” or
“diabetes-related social support.” All of these phrases can be used interchangeably. The
phrase, “illness-related diabetes social support” has been and will continue to be
used in the rest of this document. Despite this scarcity, it has been shown that
illness-related social support may be a stronger predictor of chronic disease
outcomes compared to general social support (13, 20). It was further suggested
that illness-related diabetes social support may be positively associated with
improvements in self-management behaviors (20). Recent evidence suggests
that illness-related diabetes social support, a form of practical-instrumental social
support, has the strongest association with adherence to activities associated
10
Therefore, the availability of illness-related diabetes social support in the 2003
HRS Diabetes Study as a measure of practical-instrumental support, provided
the opportunity to use a source of social support which is directly linked to
activities related to diabetes management. This facilitated the investigation of the
association between illness-related diabetes social support for diabetes self-care
activities (as a whole and individually) and glycemic control and whether the
association between the summary IRDSS variable and GC is modified by race/
ethnicity.
Illness-related diabetes
social support
Glycemic control
2 Race/ethnicity
11
Illness-related diabetes Glycemic
Social support Control
Socio-demographic
Characteristics (age, gender, Unmeasured Factor
Educational status, marital status, Health insurance status)
Lifestyle (Smoking, Vigorous physical Diabetes
activity), Clinical characteristics, Treatment
(BMI, depressive symptoms)
Self-rated Health Hypertension Figure 2.2 Directed Acyclic Graph
12 represents an unmeasured factor.
Based on the DAG, it is necessary to minimally adjust for socio-demographic
characteristics (marital status, age, gender, educational status, health insurance
status) and lifestyle factors (vigorous physical activity, smoking, BMI). Adjusting
for diabetes treatment will not introduce bias, so it may also be adjusted for.
Self-rated health status is a collider and so conditioning on or adjusting for it would
open up a backdoor path. Therefore, it is not necessary to adjust for it. Further, it
is not necessary to adjust for hypertension.
13
CHAPTER 3
METHODS
3.1 AIM AND RESEARCH QUESTIONS
Specific Aim: To investigate the association between illness-related diabetes
social support and glycemic control among middle aged and older adults.
Research Questions:
1 a) Is illness-related diabetes social support associated with glycemic control? In
gender-stratified models, we will examine whether the association between
illness-related diabetes social support is associated with glycemic control
independent of confounders.
Hypothesis 1a: It is hypothesized that higher scores of illness-related
diabetes social support will be associated with good glycemic control.
1 b) Is the association between illness-related diabetes social support and
14
Hypothesis 1b: It is hypothesized that there will be statistically significant
interactions between illness-related diabetes social support and race/ethnicity in
relation to glycemic control, independent of confounders.
1c) Does the strength of the association between type of illness-related diabetes
social support and glycemic control differ?
Hypothesis 1c: It is hypothesized that there will be different associations between
IRDSS for lifestyle modification, medically oriented, or emotional support oriented
activities and glycemic control. It is further hypothesized that the association
between individual types of illness-related diabetes social support and glycemic
control will be the strongest for lifestyle modification self-care activities (i.e.
illness-related diabetes social support for meal plan, getting enough physical
activity, and weight control) after adjusting for confounders.
3.2 DATA SOURCE
The Health and Retirement Study (HRS)
The Health and Retirement Study (HRS) is a longitudinal biennial survey
conducted on a nationally representative sample of U.S. adults aged 50 and
older. These individuals were born from 1931 to 1941 but beginning in 1998,
individuals who were born before 1948 were selected to participate in the survey
(41, 42). Data collection began in 1992 and detailed information on physical
15
care expenditures was collected (41, 42). In 1992, the response rate was 81.4%
and in the following waves, response rates were between 85-90% (41, 42).
Further information concerning the sample design, recruitment and
measurement are extensively discussed elsewhere (41, 42). Data from wave 6,
(year 2002) was the only wave used in the analysis. Selected
socio-demographic characteristics (race/ ethnicity, educational status and marital
status), lifestyle factors (smoking, vigorous physical activity) and clinical
characteristics (diabetes treatment, depressive symptoms) were obtained. Wave
6 and data from two HRS-related sources, the 2003 Diabetes supplemental study
and RAND HRS dataset, were merged together to create the final analytic
dataset.
The 2003 Mail Survey on Diabetes was a supplemental study which was
used to obtain self-reported data on diabetes related treatment and management
by use of a questionnaire (5). Additionally, HbA1c, a clinical biomarker of
glycemic control was also collected (5). Individuals for the 2003 survey were a
subsample of individuals (n = 3194) who self-reported having diabetes in 2002.
Only 2,385 individuals were eligible to participate in the supplemental survey
(680 excluded due to participation in the Consumption and Activities Mail Survey
and 129 excluded due to death). Of these people, 1,901 (79.7%) individuals
completed the survey; and only 1233 (64.9%) had valid HbA1c readings. The
2003 Diabetes Survey was used to obtain the following variables:
socio-demographic characteristics (age) and the illness-related diabetes social support
16
The RAND Corporation created a RAND HRS data file including HRS data
from eleven waves (1992 – 2010). This data file contains cleaned variables that
have been named consistently across each wave, derived variables for a variety
of measures, and imputations of wealth and income (43). Selected variables (i.e.
gender, income, health insurance status, BMI) were ascertained from this
dataset.
3.3 STUDY POPULATION
Exclusion and Inclusion criteria:
Respondents who were missing any of the illness-related diabetes social support
variables (n=180) or age and were younger than 50 (n =16) were excluded.
Further, respondents who were missing on any of all the variables which
measured depressive symptoms (n = 81) were excluded. There is a higher
prevalence of depressive symptoms in individuals with diabetes and a positive
association has been found between poor glycemic control and high levels of
social support (44-48). As a result, completeness of data on depressive
symptoms is necessary for all individuals who are included in the analysis. An
additional number of respondents were excluded based on missing race/ethnicity
variables (n=25) and for having zero weight variables (n=17). The final analytic
sample yielded for the analysis was 914 (74% of the 1233 individuals who had
17 3.4 DEFINITION OF VARIABLES
Outcome
Glycemic control: Glycosylated hemoglobin (HbA1c) levels were used to
measure glycemic control. Home kits were mailed to respondents of the 2003
Diabetes study. Flexsite Diagnostics, Inc was used for performing blood spot
assays for HbA1c in 2003 (49). Participants with HbA1c >8.0% were classified as
having poor glycemic control based on two previously published papers focusing
on older adults and on a consensus report written by Kirkman and colleagues
(22, 23, 50) . The two categories which were used in the analyses are good
glycemic control (HbA1c < 8.0%) and poor glycemic control (HbA1c > 8.0%).
Exposure
Illness-related diabetes social support: The 2003 Diabetes Study included eight
questions ascertaining illness-related diabetes social support from the Diabetes
Care Profile (5). These questions focused on the help and support diabetes
patients received from family or friends for eight self-care activities. The
questions asked: “How much would you agree that you can count on your family
or friends to help and support you a lot with each particular diabetic care” for the
following 8 conditions: 1) following meal plan; 2) taking medicine; 3) taking care
of feet; 4) getting enough physical activity; 5) testing sugar; 6)going to the doctor
or nurse; 7) keeping weight under control; and 8) handling feeling about
diabetes?’’ The response choices were strongly agree (represented by 5), agree
18
(represented by 2), and strongly disagree (represented by 1). A summary
illness-related diabetes social support variable was created by summing across the
eight different questions. Since there were 8 questions and 5 response choices
(represented with numbers from 1-5), the lowest score was 8 and the highest
score was 40. This summary variable was then used to categorize illness-related
diabetes social support into two categories; low support and high support.
Responses of agree and strongly agree were used to represent high support.
Since these two responses were represented by 4 and 5 respectively and there
were 8 questions, scores ranging from (8 x 4 =32) to (8 x 5 =40) were used for
the category, high support. Low support was based on the responses, strongly
disagree, disagree and neither agree nor disagree which were represented by 1,
2 and 3 respectively. As such, the lowest score for low support was (8 x1 =8) and
the highest score was less than 32 since 32 was used as the lowest score for
high support. Therefore, low support had scores in the range of 8 to 31. Each of
the 8 types of illness-related diabetes social support (IRDSS) was also
categorized as low (strongly disagree, agree, neither agree or disagree) versus
high (agree or strongly agree) support. This is consistent with the way the
summary illness-related social support variable was categorized. However, the
use of a continuous summary IRDSS variable and continuous individual IRDSS
variables will be explored in future analyses.
Effect modifier
Race/ethnicity: This variable was formed based on responses from two
19
Caucasian, Black or African American, American Indian, or Asian, or something
else?” and “Do you consider yourself Hispanic or Latino?” The following mutually
exclusive categories were created based on the responses to the questions:
“white”, “black” and “Hispanic.”
Confounders
The confounders which were included are based on apriori hypotheses, or
considered in prior studiesfocused on social support, glycemic control, diabetes
management) (5, 11, 17, 29, 30, 37, 40, 51-55).
Socio-demographic Characteristics
Age: This was collected continuously but it was categorized as “50-64”, “65-74”,
and “≥ 75” for the descriptive statistics based on prior studies (5, 6, 53). Age was
also used as a continuous variable in the models.
Gender: Gender was categorized as collected: “male” and “female.”
Educational status: This variable was collected by the question: “What is the
highest grade of school or year of college you completed?” It was categorized as
“less than high school,” “high school” and “more than high school.”
Annual household income: This refers to all 2001 income of family members who
reside in the household. This continuous variable was categorized into the
following quartiles: “less than $17, 000,” “$17, 000-$31, 000,” “$31, 001-$54,
20
Marital status: Response categories to the question about marital status were
“married,” “separated,” “divorced,” “widowed” and “never married”. This variable
was recoded as: “married/coupled” (married, separated) and “not married”
(divorced, widowed, never married).
Health insurance status: Health insurance status was created based responses
to four variables: “covered by federal government Health insurance program”,
“covered by health insurance from a current or previous employer”, “covered by
his/her spouse's employer”; “covered by other health insurance.” The responses
required for these questions were either “yes” or “no”. Based on these
responses, health insurance status was categorized as “insured” and
“uninsured.”
Lifestyle Factors
Current smoking status: This was collected by the question, “Do you smoke
cigarettes now?” This was categorized as “yes” and “no.”
Vigorous physical activity: This was collected by the question, “On average over
the last 12 months have you participated in vigorous physical activity or exercise
three times a week or more? By vigorous physical activity, we mean things like
sports, heavy housework, or a job that involves physical labor.” This was
21 Clinical characteristics
Diabetes Treatment: Diabetes treatment refers to the treatments used to manage
diabetes symptoms. This variable was created from the following two questions:
“In order to treat or control your diabetes, are you now taking medication that you
swallow?” and “Are you now using insulin shots or a pump?” The variable was
categorized as “no medication,” “oral medications” “insulin” and “combination of
oral medications and insulin.”
Body Mass Index (BMI): BMI was categorized as “underweight/ normal” (less
than 18.5 to 24.9), “overweight “(25.0 to 29.9) and “obese” (30 or more).
Depressive symptoms: Participants were asked about the possibility of having
one of eight symptoms (“I felt depressed”; “I felt that everything I did was an
effort”; “my sleep was restless”; “I could not get going”; “I felt lonely”; “I enjoyed
life”; “I felt sad”; “I was happy”) “much of the time” in the past week. All the
questions except two (“I enjoyed life” and “I was happy”) were based on
affirmative responses and so they were reverse coded. The total scores ranged
between 0 and 8 with higher scores meaning a greater number of depressive
symptoms. Depressive symptoms was categorized using a modified version of
the Center for Epidemiological Studies Depression Score (CES-D); “< 3” and “≥
3”. This cut-point was also used by the World Health Organization’s Composite
22 3.5 STATISTICAL ANALYSIS
The final analytical sample of 914 eligible individuals was used in the analyses.
Descriptive statistics: Gender-stratified frequency statistics were used in the
bivariate analysis to examine illness-related diabetes social support and glycemic
control by socio-demographic characteristics (age, gender, race/ethnicity,
educational status, marital status, health insurance status), lifestyle factors
(smoking, vigorous physical activity) and clinical characteristics (diabetes
duration, diabetes treatment, BMI, depressive symptoms) to obtain descriptive
statistics of the sample population. Means and standard deviations were
obtained for the continuous variables, and numbers and percentages of
respondents were used for the categorical variables. Analysis of variance with
t-tests was used to compare continuous variables and chi square (X2) tests were
used to compare categorical variables by levels of illness-related diabetes social
support in order to obtain p-values.
Gender- stratified frequency statistics were also used in a bivariate analysis of
race/ ethnicity by each individual illness-related diabetes social support variable.
The 8 individual illness-related diabetes self-care activities were further divided
into three groups: 1) IRDSS for lifestyle modification activities (following meal
plan, getting enough physical activity, weight control); 2) IRDSS for medically
oriented activities (taking medication, testing blood sugar, going to the doctor or
nurse to keep appointments, foot care) and 3) IRDSS for emotionally oriented
23
compare the race variable and the ethnicity variable by levels of illness-related
diabetes social support in order to obtain p-values.
Association between illness-related diabetes social support and glycemic control:
Multivariable logistic regression models were used to estimate the association
between illness-related diabetes social support and glycemic control. Sequential
adjustments were made using five different models. Model 1 was the crude
model which included illness-related diabetes social support. Model 2 was
adjusted for age, race/ethnicity, and marital status. For model 3, model 2 was
further adjusted for education, income and health insurance status and in model
4, model 3 was adjusted for smoking status and vigorous physical activity. Model
4 was then further adjusted for diabetes treatment, BMI, depressive symptoms to
produce model 5.
Effect modification by race/ethnicity: Effect modification was formally tested
using a cross-product term between race/ethnicity and IRDSS in the
gender-stratified fully adjusted multivariable logistic regression models. P-values <0.10
were considered as statistically significant.
Association between individual illness-related diabetes social support and
glycemic control: Multivariable logistic regression models were used to estimate
the association between each individual illness-related diabetes social support
and glycemic control. For each illness-related diabetes social support variable,
model 1 was the crude model which included the illness-related diabetes social
24
2 was adjusted for age, education, annual household income, marital status,
health insurance, smoking status, vigorous physical activity, diabetes treatment,
BMI, depressive symptoms.
All analyses were stratified by gender. For each analysis, odds ratios (OR) and
95% confidence intervals (CI) were obtained. Analyses were weighted to take
into account the complex sampling design of the HRS. All analyses used an
alpha level of 0.05, with the exception of the test for interaction (p<0.10). The
statistical software, SAS version 9.3; SAS Institute, Inc, Cary, North Carolina was
25
CHAPTER 4
Results
The characteristics of the sample of individuals with diabetes are shown in table
4.1. Over one third of the sample (42.8%) fell in the 65-74 age category with the
mean age being 69.8 (SD = 8.0) and about half (49.8%) of the sample was
female. It was a predominantly white sample (75.4%) with 15.1% blacks and
9.5% Hispanics. A little over one third of the sample (37.4%) had more than a
high school education and about two thirds (67.8%) of the sample was married/
coupled. Almost everyone (96.4%) had health insurance. The majority of the
sample (91.1%) was composed of non-smokers and a little less than two-thirds
(63.4%) of study participants indicated participation in vigorous physical activity.
Oral medication was the most popular (64.8%) diabetes treatment used in the
sample. A high percentage (81.3%) of the sample was overweight or obese and
a little less than one quarter (24.2%) of the sample had a high number of
depressive symptoms.
Table 4.2 shows the sample characteristics by levels of illness-related diabetes
social support for males. Males with high levels of illness-related diabetes social
support made up 57.3% of the sample. A significantly higher percentage of these
males were in the 65-74 age category compared to the 50-64 age category and
26
percentage of them had more than a high school education compared to those
who had less than a high school education and a high school education (p-value
= 0.0001). Further, a significantly higher percentage of these males did not
participate in vigorous physical activity in comparison to those who participated in
vigorous physical activity (p-value = 0.0379).
Table 4.3 shows the sample characteristics by levels of illness-related diabetes
social support for females. Females with high levels of illness-related diabetes
social support made up 55.6% of the sample. A significantly higher percentage of
these females were white in comparison to being black or Hispanic (p-value =
0.0070). In addition, a significantly higher percentage of them had less than a
high school education compared to those who had more than a high school
education and a high school education (p-value = <0.0001). Further, a
significantly higher percentage of these females took oral medications to treat
diabetes in comparison to taking no medication, insulin and a combination of oral
medications and insulin (p-value = 0.0192).
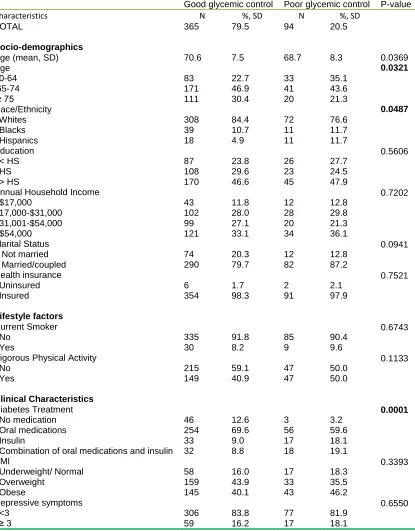
In table 4.4, the sample characteristics are shown for males by glycemic control
levels. 79.5% of males had adequate glycemic control. A significantly higher
percentage of these males were in the 65-74 age category compared to the
50-64 age category and the ≥ 75 age category (p-value = 0.0321).In addition, a
significantly higher percentage of these males were white in comparison to being
black or Hispanic (p-value = 0.0487). Further, a significantly higher percentage of
27
medication, insulin and a combination of oral medications and insulin (p-value =
0.0001).
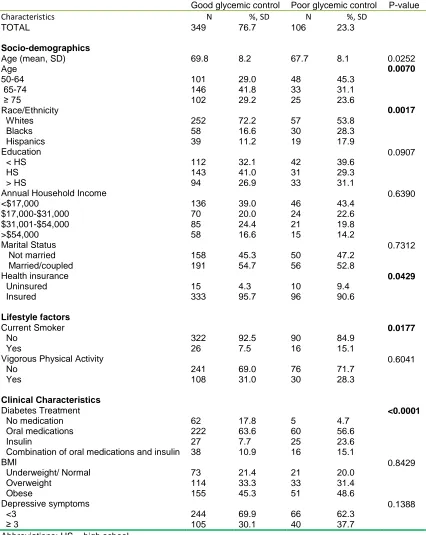
In table 4.5, the sample characteristics are shown for females by glycemic control
levels. 76.7% of females had adequate glycemic control. A significantly higher
percentage of these females were in the 65-74 age category compared to the
50-64 age category and the ≥ 75 age category (p-value = 0.0070). In addition, a
significantly higher percentage of these females were white in comparison to
being black or Hispanic (p-value = 0.0017).Further, a significantly higher
percentage of these females were insured in comparison to being uninsured
(p-value = 0.0429). Additionally, a significantly higher percentage of these females
were non-smokers in comparison to being smokers (p-value = 0.0177). A
significantly higher percentage of these females took oral medications to treat
diabetes in comparison to taking no medication, insulin and a combination of oral
medications and insulin as well(p-value = <0.0001).
In figure 4.1, the percentage of males with a high level of illness-related diabetes
social support (IRDSS) for lifestyle modification activities (following meal plan,
getting enough physical activity, weight control) is displayed by race/ethnicity.
There were no statistically significant differences observed (p-values > 0.05)
between the percentages of white and Hispanic males by high levels of
illness-related diabetes social support for all lifestyle modification activities (following
meal plan, getting enough physical activity, weight control). There were also no
28
percentages of white and black males in terms of high levels of illness-related
diabetes social support for lifestyle modification activities.
Figure 4.2 displays the percentage of males with a high level of illness-related
diabetes social support (IRDSS) for medically oriented activities (taking
medication, testing blood sugar, going to the doctor or nurse to keep
appointments, foot care) by race/ethnicity. There were statistically significant
differences observed (p-values < 0.05) between the percentages of white and
Hispanic males by high levels of illness-related diabetes social support for one of
the four medically oriented activities (testing blood sugar). A significantly higher
percentage of males with a high level of illness-related diabetes social support for
testing blood sugar were Hispanic compared to white. There were no statistically
significant differences observed (p-values > 0.05) between the percentages of
white and Hispanic males in terms of high levels of illness-related diabetes social
support for three of the medically oriented activities (taking medication, going to
the doctor or nurse to keep appointments, foot care). There were no statistically
significant differences observed (p-values > 0.05) between white and black males
in terms of the percentages of high levels of illness-related diabetes social
support for any of the medically oriented activities. There were no statistically
significant differences observed (p-values > 0.05) between the three
race/ethnicity categories in terms of the percentages of high levels of
illness-related diabetes social support for going to the doctor or nurse to keep
29
In Figure 4.3, the percentage of males with a high level of illness-related diabetes
social support (IRDSS) for the emotional support oriented activity (handling
feelings about diabetes) among males is displayed by race/ ethnicity. There were
statistically significant differences observed (p-values < 0.05) between the
percentages of white and Hispanic males as well as between the percentages of
white and black males by high levels of illness-related diabetes social support for
the emotional support oriented activity (handling feelings about diabetes). A
significantly higher percentage of males with a high level of illness-related
diabetes social support for the emotional support oriented activity were Hispanic
or black compared to white.
Figure 4.4 displays the percentage of females with a high level of illness-related
diabetes social support (IRDSS) for lifestyle modification activities (following meal
plan, getting enough physical activity, weight control) by race/ethnicity. There
were statistically significant differences observed (p-values < 0.05) between the
percentages of white and Hispanic females by high levels of illness-related
diabetes social support for all lifestyle modification activities (following meal plan,
getting enough physical activity, weight control). A significantly higher percentage
of females with a high level of illness-related diabetes social support for all
lifestyle modification activities were Hispanic compared to white. There were no
statistically significant differences observed (p-values > 0.05) between white and
black females in terms of high levels of illness-related diabetes social support for
30
In figure 4.5, the percentage of females with a high level of illness-related
diabetes social support (IRDSS) for medically oriented activities (taking
medication, testing blood sugar, going to the doctor or nurse to keep
appointments, foot care) is displayed by race/ ethnicity. There were statistically
significant differences observed (p-values < 0.05) between the percentages of
white and Hispanic females by high levels of illness-related diabetes social
support for three of the four medically oriented activities (taking medication,
testing blood sugar, foot care). A significantly higher percentage of females with
a high level of illness-related diabetes social support for these three medically
oriented activities were Hispanic compared to white. There were no statistically
significant differences observed (p-values > 0.05) between the percentages of
white and Hispanic females in terms of levels of illness-related diabetes social
support for going to the doctor or nurse to keep appointments. There were also
no statistically significant differences observed (p-values > 0.05) between the
percentages of white and black females in terms of levels of illness-related
diabetes social support for any of the medically oriented activities.
Figure 4.6 displays the percentage of females with a high level of illness-related
diabetes social support (IRDSS) for the emotional support oriented activity
(handling feelings about diabetes) by race/ethnicity. There were statistically
significant differences observed (p-values < 0.05) between the percentages of
white and Hispanic females. A significantly higher percentage of females with
high levels of illness-related diabetes social support for the emotional support
31
significant differences observed (p-values > 0.05) between the percentages of
white and black females by high levels of illness-related diabetes social support
for the emotional support oriented activity (handling feelings about diabetes).
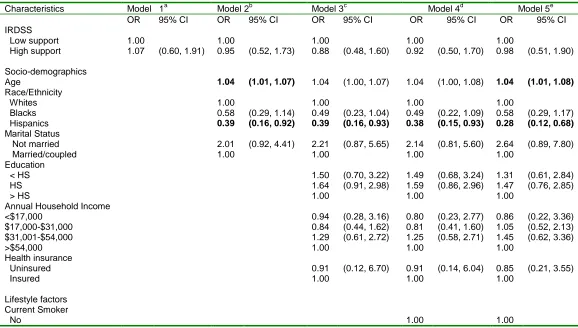
Table 4.6 illustrates the crude and adjusted odds ratios (OR) and 95%
confidence intervals (CI) for respondent characteristics associated with poor
glycemic control and illness-related diabetes social support for males. There
were no significant associations between illness-related diabetes social support
and glycemic control among males in any of the models. After adjusting for
socio-demographic characteristics, lifestyle factors and clinical characteristics, male
respondents have 1.04 (95% CI: 1.01, 1.08) times the odds of adequate glycemic
control for every one year increase in age. Hispanic males had consistent lower
odds of adequate glycemic control compared to white males with the odds being
0.28 (95% CI: 0.12, 0.68) in the fully adjusted model. Interestingly, males who
did not participate in vigorous physical activity had 2.35 (95% CI: 1.42, 3.90)
times the odds of adequate glycemic control compared to males who participated
in vigorous physical activity. Males who took oral medications, insulin or a
combination of oral medications and insulin all had a very low odds of adequate
glycemic control compared to males who used no medication; (OR: 0.32; 95%
CI: 0.14, 0.73), (OR: 0.18; 95% CI: 0.05, 0.60) and (OR: 0.12; 95% CI: 0.04,
0.39) respectively.
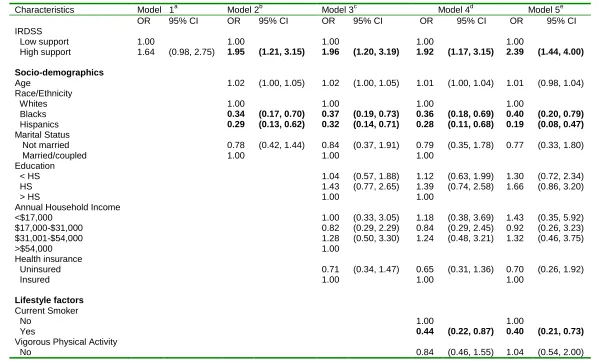
Table 4.7 illustrates the crude and adjusted odds ratios (OR) and 95%
32
glycemic control and illness-related diabetes social support for females. In all the
adjusted models, there were consistently higher odds of adequate glycemic
control among females with high levels of illness-related diabetes social support
compared to those with low levels of illness-related diabetes social support. In
the fully adjusted model, the odds was 2.39 (95% CI: 1.44, 4.00) times higher.
Black and Hispanic females had consistently lower odds of adequate glycemic
control compared to white females with the odds being 0.40 (95% CI: 0.20, 0.79)
and 0.19 (95% CI: 0.08, 0.47) respectively in the fully adjusted model. Females
who were current smokers had lower odds of adequate glycemic control
compared to females who were not current smokers; 0.40 (95% CI: 0.21, 0.73) in
the fully adjusted model. Females who took insulin had very low odds of
adequate glycemic control compared to females who used no medication; (OR:
0.09; 95% CI: 0.03, 0.22).
We checked for interaction between IRDSS and race/ethnicity in gender-stratified
models fully adjusted for socio-demographic characteristics, lifestyle factors, and
clinical characteristics. Among males, we did not find evidence of interaction
between IRDSS and black race/ethnicity (p-value =0.9422) or Hispanic
race/ethnicity (p-value = 0.2973) and IRDSS relative to white race/ethnicity.
Among females, the p-value for the interaction between IRDSS and black
race/ethnicity relative to white race/ethnicity was not significant (p-value
=0.2168). However, we observed a significant interaction among females
(p-value = 0.0715) between Hispanic race/ethnicity and IRDSS relative to white
33
Table 4.8 shows the adjusted model with odds ratios (OR) and 95% confidence
intervals (CI) for illness-related diabetes social support among females stratified
by race/ ethnicity. These results show that among white and black females, there
were no statistically significant associations between IRDSS and glycemic control
We found higher odds of adequate glycemic control among Hispanic females
with high levels of IRDSS compared to Hispanic females with low levels of
IRDSS; (OR: 5.75; 95% CI: 1.01, 32.63).
Table 4.9 shows the crude and adjusted models with odds ratios (OR) and 95%
confidence intervals (CI) for individual illness- related diabetes social support
variables stratified by gender. In the crude models, there were no significant
associations between any of the individual illness-related diabetes social support
variables and glycemic control for males or females. In the adjusted models, the
only significant association was seen among females. The odds of adequate
glycemic control among female respondents with high levels of illness-related
diabetes social support for handling feelings about diabetes was 2.05 (95% CI:
1.18, 3.54) times the odds of adequate glycemic control among female
respondents with low levels of illness-related diabetes social support for handling
feelings about diabetes.
34 Table 4.1: Socio-demographic, lifestyle, and clinical characteristics of the study sample of individuals with diabetes, Health and
Retirement Study, 2002 and 2003 Diabetes Survey
Characteristics N %, SD
TOTAL
Socio-demographics
Age (mean, SD) Age 50-64 65-74 ≥ 75 Gender Female Male Race/Ethnicity Whites Blacks Hispanics Education < HS HS > HS
Annual Household Income <$17,000 $17,000-$31,000 $31,001-$54,000 >$54,000 Marital Status Not married Married/coupled Health insurance Uninsured Insured Lifestyle factors Current Smoker No Yes
Vigorous Physical Activity No Yes Clinical Characteristics Diabetes Treatment No medication Oral medications Insulin
35
<3 ≥ 3
693 221
75.8 24.2
Abbreviations: HS = high school a
36
Table 4.2: Sample characteristics by levels of illness-related diabetes social support among males
Abbreviations: HS = high school
a
The frequencies and percentages are unweighted and may not add up to the total sample size due to missing.
Low level support High level support P-value
Characteristics N %, SD N %, SD
TOTAL
Socio-demographics
Age (mean, SD) Age 50-64 65-74 ≥ 75 Race/Ethnicity Whites Blacks Hispanics Education < HS HS > HS
Annual Household Income <$17,000 $17,000-$31,000 $31,001-$54,000 >$54,000 Marital Status Not married Married/coupled Health insurance Uninsured Insured Lifestyle factors Current Smoker No Yes
Vigorous Physical Activity No Yes Clinical Characteristics Diabetes Treatment No medication Oral medications Insulin
37
Table 4.3: Sample characteristics by levels of illness-related diabetes social support among females
Abbreviations: HS = high school
a
The frequencies and percentages are unweighted and may not add up to the total sample size due to missing.
Low level support High level support P-value
Characteristics N %, SD N %, SD
TOTAL
Socio-demographics
Age (mean, SD) Age 50-64 65-74 ≥ 75 Race/Ethnicity Whites Blacks Hispanics Education < HS HS > HS
Annual Household Income <$17,000 $17,000-$31,000 $31,001-$54,000 >$54,000 Marital Status Not married Married/coupled Health insurance Uninsured Insured Lifestyle factors Current Smoker No Yes
Vigorous Physical Activity No Yes Clinical Characteristics Diabetes Treatment No medication Oral medications Insulin
38
Table 4.4: Sample characteristics by glycemic control among males
Good glycemic control Poor glycemic control P-value
Characteristics N %, SD N %, SD
TOTAL
Socio-demographics
Age (mean, SD) Age 50-64 65-74 ≥ 75 Race/Ethnicity Whites Blacks Hispanics Education < HS HS > HS
Annual Household Income <$17,000 $17,000-$31,000 $31,001-$54,000 >$54,000 Marital Status Not married Married/coupled Health insurance Uninsured Insured Lifestyle factors Current Smoker No Yes
Vigorous Physical Activity No Yes Clinical Characteristics Diabetes Treatment No medication Oral medications Insulin
Combination of oral medications and insulin BMI Underweight/ Normal Overweight Obese Depressive symptoms <3 ≥ 3 365 70.6 83 171 111 308 39 18 87 108 170 43 102 99 121 74 290 6 354 335 30 215 149 46 254 33 32 58 159 145 306 59 79.5 7.5 22.7 46.9 30.4 84.4 10.7 4.9 23.8 29.6 46.6 11.8 28.0 27.1 33.1 20.3 79.7 1.7 98.3 91.8 8.2 59.1 40.9 12.6 69.6 9.0 8.8 16.0 43.9 40.1 83.8 16.2 94 68.7 33 41 20 72 11 11 26 23 45 12 28 20 34 12 82 2 91 85 9 47 47 3 56 17 18 17 33 43 77 17 20.5 8.3 35.1 43.6 21.3 76.6 11.7 11.7 27.7 24.5 47.9 12.8 29.8 21.3 36.1 12.8 87.2 2.1 97.9 90.4 9.6 50.0 50.0 3.2 59.6 18.1 19.1 18.3 35.5 46.2 81.9 18.1 0.0369 0.0321 0.0487 0.5606 0.7202 0.0941 0.7521 0.6743 0.1133 0.0001 0.3393 0.6550
Abbreviations: HS = high school
a
39
Table 4.5: Sample characteristics by glycemic control among females
Good glycemic control Poor glycemic control P-value
Characteristics N %, SD N %, SD
TOTAL
Socio-demographics
Age (mean, SD) Age 50-64 65-74 ≥ 75 Race/Ethnicity Whites Blacks Hispanics Education < HS HS > HS
Annual Household Income <$17,000 $17,000-$31,000 $31,001-$54,000 >$54,000 Marital Status Not married Married/coupled Health insurance Uninsured Insured Lifestyle factors Current Smoker No Yes
Vigorous Physical Activity No Yes Clinical Characteristics Diabetes Treatment No medication Oral medications Insulin
Combination of oral medications and insulin BMI Underweight/ Normal Overweight Obese Depressive symptoms <3 ≥ 3 349 69.8 101 146 102 252 58 39 112 143 94 136 70 85 58 158 191 15 333 322 26 241 108 62 222 27 38 73 114 155 244 105 76.7 8.2 29.0 41.8 29.2 72.2 16.6 11.2 32.1 41.0 26.9 39.0 20.0 24.4 16.6 45.3 54.7 4.3 95.7 92.5 7.5 69.0 31.0 17.8 63.6 7.7 10.9 21.4 33.3 45.3 69.9 30.1 106 67.7 48 33 25 57 30 19 42 31 33 46 24 21 15 50 56 10 96 90 16 76 30 5 60 25 16 21 33 51 66 40 23.3 8.1 45.3 31.1 23.6 53.8 28.3 17.9 39.6 29.3 31.1 43.4 22.6 19.8 14.2 47.2 52.8 9.4 90.6 84.9 15.1 71.7 28.3 4.7 56.6 23.6 15.1 20.0 31.4 48.6 62.3 37.7 0.0252 0.0070 0.0017 0.0907 0.6390 0.7312 0.0429 0.0177 0.6041 <0.0001 0.8429 0.1388
Abbreviations: HS = high school
a
40
Abbreviations: IRDSS = illness-related diabetes social support
Figure 4.1: Percentage of males with a high level of illness-related diabetes social support (IRDSS) for lifestyle modification activities (following meal plan, getting enough physical activity, weight control) by race/ethnicity
0 10 20 30 40 50 60 70 80 90 100
High Level support High Level support High Level support
Meal Plan Physical Activity Weight Control
Per
ce
n
tage
IRDSS for lifestyle modification activities
41
Abbreviations: IRDSS = illness-related diabetes social support
a
*: p-value < 0.05 for chi-square test of significant differences between white and Hispanic males
Figure 4.2: Percentage of males with a high level of illness-related diabetes social support (IRDSS) for medically oriented activities (taking medication, testing blood sugar, going to the doctor or nurse to keep appointments, foot care) by race/ethnicity
0 10 20 30 40 50 60 70 80 90 100
High Level support High Level support High Level support High Level support Taking medication Testing blood sugar Going to the doctor
or nurse
Foot Care
Per
ce
n
tage
IRDSS for medically oriented activities
42
Abbreviations: IRDSS = illness-related diabetes social support
a
*: p-value < 0.05 for chi-square test of significant differences between white and Hispanic males
b
+: p-value < 0.05 for chi-square test of significant differences between white and black males
Figure 4.3: Percentage of males with a high level of illness-related diabetes social support (IRDSS) for emotional support oriented activity (handling feelings about diabetes) among by race/ethnicity
0 10 20 30 40 50 60 70 80 90 100
High Level support Handling feelings about diabetes
Per
ce
n
tage
IRDSS for emotionally oriented activity
Whites Blacks Hispanics *
43
Abbreviations: IRDSS = illness-related diabetes social support
a
*: p-value < 0.05 for chi-square test of significant differences between white and Hispanic females
Figure 4.4: Percentage of females with a high level of illness-related diabetes social support (IRDSS) for lifestyle modification activities (following meal plan, getting enough physical activity, weight control) by race/ethnicity
0 10 20 30 40 50 60 70 80 90 100
High Level support High Level support High Level support
Meal Plan Physical Activity Weight Control
Per
ce
n
tage
IRDSS for lifestyle modification activities
Whites Blacks Hispanics
44
Abbreviations: IRDSS = illness-related diabetes social support
a
*: p-value < 0.05 for chi-square test of significant differences between white and Hispanic females
Figure 4.5: Percentage of females with a high level of illness-related diabetes social support (IRDSS) for medically oriented activities (taking medication, testing blood sugar, going to the doctor or nurse to keep appointments, foot care) by race/ethnicity
0 10 20 30 40 50 60 70 80 90 100
High Level support High Level support High Level support High Level support Taking medication Testing blood sugar Going to the doctor
or nurse
Foot Care
Per
ce
n
tage
IRDSS for medically oriented activities
Whites Blacks Hispanics *
45
Abbreviations: IRDSS = illness-related diabetes social support
a
*: p-value < 0.05 for chi-square test of significant differences between white and Hispanic females
Figure 4.6: Percentage of females with a high level of illness-related diabetes social support (IRDSS) for emotional support oriented activity (handling feelings about diabetes) among by race/ethnicity
0 10 20 30 40 50 60 70 80 90 100
High Level support Handling feelings about diabetes
Per
ce
n
tage
IRDSS for emotionally oriented activity
46
Table 4.6: Crude and adjusted odds ratios (OR) and 95% confidence intervals (CI) of the associations of Illness-related diabetes social support and other respondent characteristics with adequate glycemic control among males
Characteristics Model 1a Model 2b Model 3c Model 4d Model 5e
OR 95% CI OR 95% CI OR 95% CI OR 95% CI OR 95% CI
IRDSS Low support High support Socio-demographics Age Race/Ethnicity Whites Blacks Hispanics Marital Status Not married Married/coupled Education < HS HS > HS
Annual Household Income <$17,000 $17,000-$31,000 $31,001-$54,000 >$54,000 Health insurance Uninsured Insured Lifestyle factors Current Smoker No 1.00
47
Abbreviations: HS = high school
IRDSS = illness-related diabetes social support
a
Model 1: crude model;
b
Model 2: Model 1 + age, race/ethnicity, marital status,
c
Model 3: Model 2 + education, annual household income, health insurance;
d
Model 4: Model 3 + smoking status, vigorous physical activity;
e
Model 5: Model 4 + diabetes treatment, BMI, depressive symptoms. Yes
Vigorous Physical Activity No Yes Clinical Characteristics Diabetes Treatment No medication Oral medications Insulin