University of South Carolina
Scholar Commons
Theses and Dissertations
1-1-2013
Essays In the Airline Industry
Mariana Luminita Nicolae
University of South Carolina
Follow this and additional works at:https://scholarcommons.sc.edu/etd
Part of theBusiness Administration, Management, and Operations Commons
This Open Access Dissertation is brought to you by Scholar Commons. It has been accepted for inclusion in Theses and Dissertations by an authorized administrator of Scholar Commons. For more information, please [email protected].
Recommended Citation
Essays in the Airline Industry
by
Mariana L. Nicolae
Bachelor of Science
Academy of Economic Studies, Bucharest 2000
Master of Business Administration University of Montana 2006
Submitted in Partial Fulfillment of the Requirements
for the Degree of Doctor of Philosphy in
Business Administration
Darla Moore School of Business
University of South Carolina
2013
Accepted by:
Dr. Mark Ferguson, Major Professor
Dr. Carolyn Queenan, Committee Member
Dr. Pelin Pekgün, Committee Member
Dr. Orgül Öztürk, Committee Member
c
Copyright by Mariana L. Nicolae, 2013
Dedication
Acknowledgments
I would like to express my sincerest gratitude to my advisor, Dr. Mark Ferguson.
I could not have completed this dissertation without his constant support, guidance
and encouragement. I would also like to thank Dr. Carolyn Queenan, Dr. Pelin
Pekgün and Dr. Orgül Öztürk for their encouragement, mentoring and helpful insights
throughout the dissertation process. Additionally, I would like to thank Dr. Vinayak
Deshpande, Dr. Mazhar Arıkan and Dr. Laurie Garrow for their collaboration and
guidance. Finally, I would like to thank Resource Systems Group, Inc. for making
Abstract
In 2008, most U.S. airlines implemented checked baggage fee policies to generate
additional revenue to help with their financial distress caused by abnormally high
fuel prices. Since this time, the fees have provided a steady revenue stream and
often are the difference between a profit and a loss. Recently, some literature in the
operations management field has postulated that altering consumer behavior in a
manner that is beneficial to both the firm and customers is an additional purpose
of these fees. In Essay 1, we empirically investigate the airline perspective of this
hypothesis by considering the operational impact of airline baggage fees as measured
by the airlines’ departure delays. We do so by using primarily data collected by the
Bureau of Transportation Statistics for the time periods immediately before and after
fees for one and two checked bags were imposed by most U.S. airlines in 2008, and
using a Tobit regression model to assess the impact of the fees on departure time
performance. According to the 2013 North America Airline Satisfaction Study by J.D.
Power & Associates, the baggage fees are still a source of passenger dissatisfaction. In
Essay 2, we empirically investigate the customer perspective of the above hypothesis
by considering the benefits provided by the service of checking bags. Thus, we
examine airline service attributes that affect customer choice itinerary, and how
checking or not checking bags influence these relationships, by employing discrete
Table of Contents
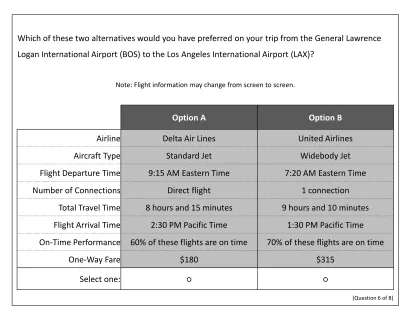
Dedication . . . iii
Acknowledgments . . . iv
Abstract . . . v
List of Tables . . . viii
List of Figures . . . x
Chapter 1 Introduction . . . 1
Chapter 2 Do Bags Fly Free? An Empirical Analysis of the Operational Implications of Airline Baggage Fees . 4 2.1 Introduction . . . 4
2.2 Literature Review . . . 9
2.3 Hypothesis Development . . . 13
2.4 Methods . . . 19
2.5 Results and Discussion . . . 32
2.6 Conclusions . . . 42
Chapter 3 Airline Customer Preferences in the Baggage Fees Era . . . 45
3.1 Introduction . . . 45
3.2 Literature Review . . . 48
3.4 Methods . . . 57
3.5 Results and Discussion . . . 70
3.6 Conclusions . . . 78
Chapter 4 Conclusions. . . 82
List of Tables
Table 2.1 The 57 origin airports used by Southwest Airlines and the other
airlines in our datasets . . . 21
Table 2.2 Dates of implementing fee policies on one checked bag and two checked bags . . . 22
Table 2.3 Description of variables . . . 23
Table 2.4 A snapshot of aircraft rotation: Southwest Airlines’ aircraft with tail number N208WN . . . 26
Table 2.5 Descriptive statistics . . . 30
Table 2.6 Summary of Tobit1 regression . . . 33
Table 2.7 Summary of Tobit2 regression . . . 34
Table 2.8 Summary of Tobit2 regression - JetBlue Airways included . . . 36
Table 2.9 Summary of Tobit2 regression: Legacy Carriers vs. Low-Cost Carriers . . . 37
Table 2.10 Summary of OLS1 regression . . . 39
Table 2.11 Summary of OLS2 regression . . . 41
Table 3.1 Attributes and levels characterizing the itinerary in the stated preference experiment . . . 60
Table 3.2 Demographics of respondents . . . 61
Table 3.3 The revealed-preference trips by airline . . . 61
Table 3.4 Nested Likelihood Ratio tests (1) . . . 65
Table 3.5 Nested Likelihood Ratio tests (2) . . . 67
Table 3.7 MNL: Base model results . . . 71
Table 3.8 MNL: Heterogeneous models results (1) . . . 73
Table 3.9 MNL: Heterogeneous models results (2) . . . 75
Table 3.10 MNL: Heterogeneous pooled model results . . . 77
List of Figures
Figure 2.1 Flight delays by cause in January-December, 2008 (based on
the BTS data on all carriers and airports) . . . 28
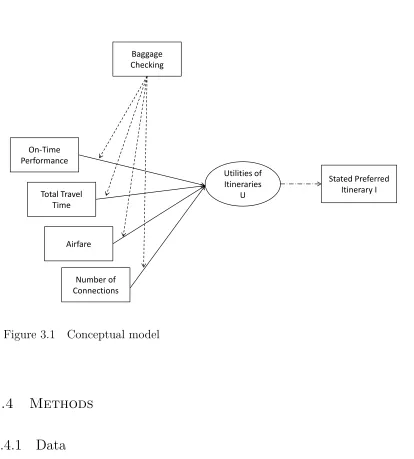
Figure 3.1 Conceptual model . . . 57
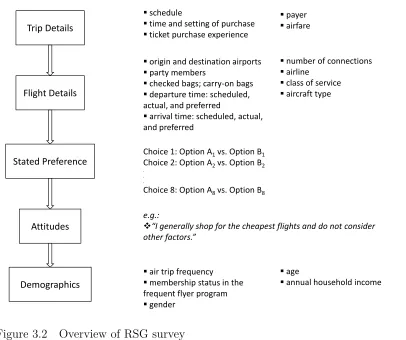
Figure 3.2 Overview of RSG survey . . . 58
Chapter 1
Introduction
In the early 2008 the U.S. airlines were struggling with severe financial pressure due
especially to record fuel prices. For competitive reasons, they had not been able
to raise ticket prices enough to offset that increasing expense. Consequently, the
airlines were trying to both reduce costs and add new revenues such as charging
for products and services that once were complimentary, moving customers to “a la
carte” pricing. United Airlines’ move of imposing a fee on the second bag checked
by its passengers led to an industry shift as the competitors mimicked it. Soon
after, checking two 50-pound suitcases free of charge was not the industry standard
anymore. The financial implications were immediate, with U.S. airlines collecting in
2008 more than $1 billion in baggage fees, which represents a 148% increase from
2007.
Even though fuel prices receded, baggage fees have remained to boost the airline
industry’s usually poor finances. As recently as 2012, the baggage fees amounted to
$3.5 billion, or 3.8% increase compared to 2011, when the baggage fees generated
approximately one-half of the industry’s profit of $7 billion [BTS, 2013]. Given that
in 2012 only 0.8% more total system passengers were carried by U.S. airlines than in
2011 [BTS Press Release, March 2013], we can conclude the growing acceptance of
baggage fees by travelers.
However, a significant increase in the amount of carry-on baggage as a direct
result of passengers avoiding the checked baggage fees has also been documented
flight attendants over the more and heavier carry-on baggage brought into the cabin,
which leads to an increase in the amount of bags checked at the gate when there is no
room for them in the cabin, and subsequent delays that occur from the process. In
20071 flight delays were estimated to have raised the operating costs of U.S. airlines
by $19 billion [Joint Economic Committee, 2008], being thus a big burden to airlines’
profits [Bishop, Rupp, and Zheng, 2011]. If the checked baggage fees are seen as
an additional cause of flight delays due to excessive carry-on baggage, they should
provide the necessary impetus for airlines to reconsider them.
Thus, in Essay 1 we examine the operational impact of airline baggage fees as
measured by departure delays, by using primarily data collected by the Bureau of
Transportation Statistics. More specifically, we use data on 1,929,733 domestic flights
flown by Continental Airlines, Delta Air Lines, Northwest Airlines, United Airlines,
US Airways, American Airlines, AirTran Airways, JetBlue Airways and Southwest
Airlines, starting with 35 days prior to the date when the fees for one checked bag were
implemented and continuing until 35 days after the implementation of two checked
bags fees. We supplement this data with data published by the Federal Aviation
Administration and the National Climatic Data Center of the National Oceanic and
Atmospheric Administration, and use regression analyses to examine the impact of
implementing checked baggage fees on departure delay performance.
While recognizing the main purpose of the baggage fees, the literature (e.g. Allon,
Bassamboo, and Lariviere [2011]) has postulated that:
“[B]aggage fees are not just about revenue. They serve to alter consumer
behavior in a manner that is beneficial to both the firm and customers.
The firm enjoys lower costs (...)”
1The fees for one, respectively two checked bags were gradually implemented by most U.S.
That is, because offering the service of checking bags adds additional costs to
the airlines, one approach taken by airlines in order to lower their costs has been
to discourage travelers from checking bags by implementing checked baggage fees,
which some have argued would also benefit travelers. Yet, the recent 2013 North
America Airline Satisfaction Study by J.D. Power & Associates has revealed that
“[b]aggage fees continue to be a source of passenger dissatisfaction and to lead to lower
satisfaction levels” [J.D. Power & Associates Press Release, May 2013]. Consequently,
it remains to be shown what benefits the service of checking bags provides, beyond
the increase in revenues from the fees, as previously mentioned.
Thus, in Essay 2 we explore a potential new way of segmenting travelers based
on their sensitivities to itinerary attributes. More specifically, we investigate
whether travelers who check bags and travelers who do not check bags have different
sensitivities to the historical on-time performance, total travel time, airfare and
number of connections when choosing an itinerary. This is particularly relevant as
most major airlines are evaluating operational changes that may make the process of
checking bags even more inconvenient than it currently is. In this essay, we use data
from an Internet-based stated-preference survey conducted by Resource Systems
Group, Inc. in the Spring of 2012, who surveyed 878 U.S. domestic travelers who
had flown a domestic flight within the last six months, and employ discrete choice
modeling.
Through empirically evaluating these two issues using secondary and primary data
sources, this dissertation will help explicate the airlines’ perspective of the impact of
the checked baggage fees implemented by most U.S. airlines in 2008, and travelers’
Chapter 2
Do Bags Fly Free? An Empirical Analysis of
the Operational Implications of Airline
Baggage Fees
2.1
Introduction
The once industry standard of two 50-pound free checked bags is now virtually extinct
in the domestic U.S. airline market. Today, most U.S. airlines charge fees for checking
a bag. On February 10th 2007 Spirit Airlines, an ultra low-cost carrier, became the
first airline to charge for one checked bag (i.e. the second checked bag fee), a policy
that was extended to two checked bags (i.e., by adding the first checked bag fee) on
June 19th, 2007. United Airlines was the first major U.S. carrier that announced a
fee for one checked bag1, which was estimated to generate cost savings and additional
revenue of more than $100 million annually [Carey, 2008]. Citing high fuel prices,
large carriers such as Continental Airlines, Delta Air Lines, Northwest Airlines, and
US Airways quickly matched United’s decision and all began charging their passengers
for one checked bag (i.e. the second checked bag fee) starting May 5th, 2008. A week
later, American Airlines matched the other airlines’ baggage policy and, on June 15th,
started charging its passengers for two checked bags (i.e. by adding the first checked
bag fee), hoping to get more than $350 million in additional revenues [McCartney,
2008b]. By the end of 2008, all major U.S. carriers except Alaska Airlines, JetBlue
Airways, and Southwest Airlines2 had instituted fees for the first two checked bags.
The financial implications were immediate, with U.S. airlines collecting more than
one billion dollars in baggage fees for overweight, oversized and/or extra bags in 2008,
which represents a 148% increase from 2007 [BTS, 2012]. Expressed as a percentage
of operating revenues, baggage fees increased from 0.27% in 2007 to 0.62% in 2008 for
U.S. airlines (reaching 1.94% in 2010), generating a sustainable source of revenues. In
the first half of 2012, the industry set a new record by collecting $1.7 billion in baggage
fees [Mayerowitz, 2012]. Ignoring these potential financial gains, the no-fee policy was
used as part of its marketing strategy by Southwest Airlines which saw an opportunity
to distinguish itself from the competition by launching its “Fees Don’t Fly With Us”
campaign. This marketing campaign has been viewed as successful by Southwest, as
they continue to be the only major U.S. airline that does not charge a fee for the
first two checked bags. This policy indicates that they view the marginal increase in
revenue from the increased volume of passengers generated by the campaign as being
larger than the loss in potential revenue from charging the fees and any associated
cost increases. Their decision has not gone unquestioned, however, as stock analysts
have repeatedly suggested that they begin charging for checked bags in order to raise
additional revenues.
While the baggage fee policies are now generally agreed upon as a successful
way of improving revenues for both the airlines that started charging for checked
bags, as well as those that did not (Southwest), the question still remains about
the impact the policies have had on airlines’ operations such as on-time departure
performance. At the aggregate level (i.e. all U.S. airlines and airports), the percentage
of delayed departures remained constant over the 2007-2008 period, according to
2Alaska Airlines instituted the first two checked bags fees policy on July 7th, 2009; JetBlue
Airways has only charged for one checked bag as of 2012, i.e. starting June 1st, 2008; Southwest
the U.S. Department of Transportation’s (DOT) Bureau of Transportation Statistics
(BTS). Aggregate statistics, however, may disguise the impact at the individual airline
level. Thus, it is worthwhile to evaluate whether a marketing strategy decision such
as charging or not charging fees for one or two checked bags has had implications on
an airline’s operational performance.
As pointed out in the popular press [Johnsson and Hilkevitch, 2011], Southwest
had to cope with a surge in checked baggage, a byproduct of its “Bags Fly Free”
marketing campaign. Transferring bags between flights under an extreme time crunch
is perhaps the most challenging aspect of running an airport hub and a common cause
of delays. Departure delays at Midway airport for Southwest Airlines were reported
to increase after the checked baggage fee implementation by other airlines. Ryanair,
an Irish low-cost airline, claims that baggage fees are a necessity in order to keep costs
down, and it has been popularly hypothesized that if Southwest is going to welcome
free checked bags, they have to expect higher costs [Lariviere, 2011]. On the other
hand, to avoid baggage fees, passengers have continued to bulk up their carry-on bags,
turning the allotment of one bag and a purse or briefcase into a two-suitcase load.
Some game the system by fully intending to check a bag – they volunteer at the gate
instead of the counter, and thus avoid the airline fee [McCartney, 2012a]. Baggage fees
have made the overhead bin a precious commodity and the accompanying boarding
stampede can increase departure delays. Thus, whether baggage fees lead to increased
departure delays for the carrier that charges fees, or does not charge fees, is an
empirical question that we seek to answer.
That a firm will perform better if it links its operations strategy to the
competitive strategy to achieve the so-called external fit, is well established in the
operations strategy literature [Smith and Reece, 1999]. Moreover, the alignment
between operations and marketing strategies should exist to benefit organizational
issue on this topic, Malhotra and Sharma [2002, p. 210] note that “managing the
interface between the marketing and operations functions is a challenging task
since these two functional areas may often have conflicting objectives and plans
of action. Yet co-ordination between them is critical for firm success”. Thus, the
implementation of checked bag fees (a marketing decision) provides an ideal setting
to study how an industry changed, or coordinated, their operations to respond to
this marketing strategy change.
To empirically address the impact of baggage fees in the airline industry, we
primarily use data collected by the BTS for the time periods immediately before
and after fees for one and two checked bags were imposed by the majority of
the U.S. airlines. We supplement this data with data published by the Federal
Aviation Administration (FAA) and the National Climatic Data Center (NCDC) of
the National Oceanic and Atmospheric Administration (NOAA) and use regression
analyses to examine the impact of implementing checked baggage fees on departure
delay performance. We collected data on 1,929,733 domestic flights flown by
Continental Airlines, Delta Air Lines, Northwest Airlines, United Airlines, US
Airways, American Airlines, AirTran Airways, JetBlue Airways and Southwest
Airlines, starting with 35 days prior to the date when the fees for one checked bag
were implemented and continuing until 35 days after the implementation of two
checked bags fees. Since Southwest Airlines is the only major U.S. airline that
does not charge for two checked bags, it resembles a control variable of operational
performance in a quasi-experiment3 when compared against competing airlines (that
did begin charging for checked bags) that operated in the same airports.
3In a true experimental study, the treatment group receives the intervention, while the control
Our focus is on the operational impact of airline baggage fees instituted by most
U.S. airlines in 2008. More specifically, we seek to answer the following questions:
Do baggage fees impact airline operations as measured by departure delays? Is there
a differential impact of one checked bag fee and two checked bags fees policies? Did
airlines increase or decrease scheduled block-times in anticipation/response to the
impact of baggage fees?
We show that, at the aggregate level, the airlines that began charging for one
checked bag saw a significant relative improvement in their on-time departure
performance in the 35-day period afterwards, compared to the airlines that were
not charging for a checked bag during the same time period. When grouped into
‘low-cost’ versus ‘legacy’ carriers, however, we find opposite effects: the departure
performance of the low-cost airlines became worse while it improved for the legacy
carriers. When the airlines began charging for two checked bags, we find no significant
change in departure performance of legacy carriers, but a degradation of departure
performance of low-cost carriers. These findings indicate that the baggage fees did
influence customer behavior, but in the case of charging for both checked bags, not in
the direction the airlines had hoped for. The degradation of departure performance
appears to be especially bad for the low-cost carriers, as it appears that their more
price sensitive passengers may have begun carrying on more baggage to avoid the
checked bag fees. Thus, our findings also support the notion that Southwest’s
marketing strategy of being the only major U.S. airline not charging for the first two
checked bags is in line with their historical operations oriented strategy.
The remainder of this study is organized as follows. In Section 2 we briefly review
the related literature on on-time performance and baggage fees. Section 3 describes
the hypotheses of this study. Section 4 explains the data, variables and empirical
specifications. Section 5 presents and discusses the results, and Section 6 concludes
2.2
Literature Review
This paper relates to two streams of research in economics and operations
management: (1) research that uses data provided by the DOT to investigate
the impact of various factors on the quality dimension of airline’s operational
performance, as measured by on-time departures, on-time arrivals, and flight
cancellations, and the impact of service quality dimensions on financial performance,
and (2) research that examines the consequences of implementing baggage fees.
Within the first stream, economics researchers have looked at the impact of
competition on airline service quality. Prince and Simon [2009] use BTS data on 10
major airlines in the 1995-2001 period on Fridays on the 1,000 busiest routes, and
find that multimarket contact has a positive effect on arrival delays, causing delays
on the ground, more in the form of gate departure delays rather than time spent on
the runway. Using over 800,000 individual flights scheduled between 50 major U.S.
airports in January, April, and July of 2000, Mazzeo [2003] finds that the prevalence
and duration of arrival delays are significantly greater on routes where only one airline
provides direct service, and that weather, congestion, and scheduling decisions have
a significant contribution to arrival delays.
Using over 27,000 monthly route observations between 1997 to 2000, Rupp,
Owens, and Plumly [2006] find that less competitive routes are characterized by lower
service quality, in terms of both more frequent and longer flight delays. Further,
Rupp [2009] examines the effect of competitive, economic, logistical, and weather
measures on flight delays, by using 505,127 domestic flights between January 1995
and December 2004. He finds that airlines do not internalize passenger delay costs
as departure and arrival delays are more likely at highly concentrated airports, and
that the local market competition improves on-time performance, delays being more
prevalent on monopoly routes. Rupp and Holmes [2006] examine the effect of the
U.S. between January 1995 and August 2001. Their findings indicate that route
competition improves service quality as measured by cancellation rates, and that
flight cancellations are independent of airport concentration. They also identify a
hub airline effect for both origin and destination airports that lowers the frequency
of cancelled flights. Further, Rupp and Sayanak [2008] use 1,065,953 domestic flights
of twenty-one U.S. carriers in 2006, and find that low-cost carriers have slightly
shorter arrival delays (about one minute) than their competitors. In our study we
also differentiate between legacy and low-cost carriers, and control for weather and
logistical aspects. However, to control for the propagation of flight delays, unlike
Rupp and colleagues who use a measure of scheduled departure time, we use a
spillover-adjusted measure of departure delay in addition to our measure of scheduled
departure time (i.e., departure block time). Unlike this previous literature, we use a
Tobit regression model, which is more appropriate for measuring departure delay as
a left-censored dependent variable. Thus, our study adds a robustness check to the
earlier results. Finally, other economics researchers (e.g., Mayer and Sinai [2003],
Forbes and Lederman [2010], Ater and Orlov [2011]) have investigated the impact
of factors such as hub origin, vertical integration with regional partners to operate
flights, and Internet access on departure delays, but these factors are not relevant
for our objective.
In the operations management literature, Ramdas, Williams, Li, and Lipson
[2012] examine the relationship between performance along several dimensions of
service quality, including on-time performance, long delays, and cancellations, and
stock market performance, by using monthly data for eleven major U.S. airlines
over a 20-year period. They find that unexpected changes in service quality have
a contemporaneous impact on stock returns, and that the cost of flight delays is
convex in time. They also estimate a conservative marginal cost of a delay as being
operational aspects of running an airline on airline service quality. Li and Netessine
[2011] consider that airline alliances provide higher service quality in the form of
more options, smoother connections, shared alliance lounges, and flexibility regarding
frequent flyer programs. Others equate higher quality with on-time performance.
For example, Ramdas and Williams [2008] investigate the tradeoff between aircraft
capacity utilization and on-time performance using flights flown within the continental
U.S. in the years 1995-2005. They find that greater aircraft utilization results in
higher delays, with this effect being worse for airlines that are close to their asset
frontiers in terms of already being at high levels of aircraft utilization. Deshpande
and Arıkan [2012] examine the impact of the airline flight schedules on on-time
arrival performance. They use 20,681,160 flights covering 294 U.S. airports in the
years 2005-2007 to provide a method for forecasting the scheduled on-time arrival
probability for each individual scheduled domestic flight in the U.S. They find that
revenue drivers, competitive measures, and operational characteristics such as the
hub and spoke network structure have a significant effect on the scheduled on-time
arrival probability. In addition, they find that, unlike low-cost airlines, full-service
airlines assign a higher weight on the cost of late arrivals. Using the same dataset,
Arıkan, Deshpande, and Sohoni [2012] develop stochastic models to analyze the
propagation of delays through air-transportation networks. They find that the actual
block times averages of all U.S. airlines exceed their average scheduled block times,
potentially driven by the 15-minute buffer used by the DOT in reporting on-time
arrival performance. They also construct a measure for “passenger” on-time arrival
probability, in addition to the flight on-time arrival performance currently reported
by the DOT. Our study contributes to this research stream by including a new
possible factor that influences departure delays, i.e. charging for checked bags. More
charging passengers for one, and respectively two checked bags, impacts airline service
quality as measured by on-time departures.
Within the second research stream, Allon, Bassamboo, and Lariviere [2011]
analytically examine whether airlines should bundle the main service (i.e. transporting
a person) and an ancillary service such as transporting a checked bag, and if
they should post a single price or unbundle them and price the ancillary service
separately. Their modeling approach indicates that the way in which airlines have
been implementing baggage fees has more direct impact on controlling customer
behavior than segmenting customers. Our study is the first to show empirically
that baggage fees do seem to have influenced customer behavior, and that the effect
depends on the type of airline. Unlike Allon, Bassamboo, and Lariviere [2011] who
posit that pricing the baggage separately induces customers to exert effort (i.e.,
to reduce the volume of checked baggage) and thus lowers the airline’s costs, we
find that this practice also induces customers to increase the volume of carry-on
baggage, which does not lower the airline’s costs. Using an event study methodology,
Barone, Henrickson, and Voy [2012] explore the impact of the first checked bag fee
announcements on airline stock prices. They find negative abnormal returns on the
day of announcement for the announcing airline and other competing airlines, since
perceived as an industry weakness. On the other hand, they find that subsequent
announcements of fee increases for the first checked bag are correlated with positive
abnormal returns, justified by investors learning the revenue implication of these
baggage fees that have positively impacted the airline’s financial performance. Using
a spatial autoregressive model to account for airport substitutability, Henrickson and
Scott [2012] consider the top 150 domestic routes from 2007 to 2009, and find that
a one dollar increase in baggage fees reduces airline ticket prices on the fee charging
airlines by $0.24 and increases Southwest Airlines’ ticket prices on routes in which
very little difference between the change in total customer costs on the airlines that
charge baggage fees versus Southwest. Our study also contributes to this research
stream, by linking baggage fees directly to an airline’s operational costs.
2.3
Hypothesis Development
Due to severe financial pressures in 2008, especially increased jet fuel prices, the
majority of the U.S. airlines stripped out previously free services and began charging
customers for anything more than basic transportation. While customers adapted to
most of these changes, the implementation of checked bags fee tested the boundaries of
what a basic airline service was. As United Airlines’ Senior VP of Marketing explained
in 2008, “the definition of basic airline service is evolving, and different airlines today
have different answers of what comes standard with a ticket. “Unbundling” services
means travelers will pay only for what they use. Currently, every customer pays
for baggage service, whether used or not. We believe it has been too much of a
one-size-fits-all model. (...) the baggage decision was difficult because changing
customer expectations is obviously difficult” [McCartney, 2008a]. Indeed, the U.S.
airlines saw competitive concerns as the deciding factor in implementing à-la-carte
pricing regarding checked baggage. If they began charging for bags, a service that
had been long built into the ticket price, they would start to lose business among the
price-sensitive, non-elite frequent flyers. However, once Spirit Airlines, the “ultra-low
cost airline”, successfully experimented with fees for checked bags, most U.S. airlines
followed it. The current theory does not clearly predict the effect of baggage fees
on departure delays. We speculate that the imposition of baggage fees (of similar $
value for all airlines) caused passengers to change their behavior, and thus impacted
Let x1 and x2 represent the percentage of passengers who travel by checking in
one and two bags respectively4. When the airlines which previously had not charged
their passengers for the first two pieces of checked baggage instituted a policy change
by charging for one checked bag (see Table 2.2 for exact dates), the x1 passengers
were not affected. However, x2 passengers’ behavior was affected, and depending on
their price sensitivity, they chose one of the following three options: (1) paying the
fee for one checked bag while checking the other bag for free, (2) checking only one
bag (instead of two) and thus not paying the fee, hence turning into the x1 type
of passengers, or (3) switching to a carrier which did not implement such a policy.
Let y1, y2, and y3 represent the percentage of x2 passengers who chose the first,
second and third option respectively. While y1 and y2 passengers did not switch to
a carrier without such a baggage policy, overall they contributed to a decline in the
checked baggage load of those airlines which implemented such a policy. That is,
when faced with a fee for checked baggage, passengers checked 40 to 50 percent fewer
bags on some carriers [U.S. Government Accountability Office, 2010]. Moreover, y2
passengers may have brought on board a larger carry-on to make up for the “loss” of
one bag. Indeed, checked baggage fees led to more and heavier bags brought as
carry-on into the cabin [Dinkar, 2010]. The existing carry-carry-on baggage limits were not always
enforced. Related to the increase of carry-on baggage, a survey of the Association
of Flight Attendants show an increase in tense boarding situations, the number of
checked bags at the gate and pushback delays [U.S. Government Accountability Office,
2010]. Consequently, the implementation of checked baggage fees resulted in reduced
4We assume that these two categories describe the most typical passengers, and thus the most
likelihood of on-time departures as long as the carry-on baggage limits were loosely
enforced. The popular press describes the real-estate crisis in the plane through as
follows:
“For many travelers, the most odious aspect of the baggage fee is
the anticipated battle for overhead-bin space. To make sure they can
find room, some customers already push their way through boarding
queues. Passengers struggle to stuff large bags into small bins, and flight
attendants often find themselves taking bags off planes and checking them
to their destinations once bins fill up. All this will likely get worse, though
the airlines say that the new fee won’t be collected in airplane cabins
from customers who can’t find space for their allowed carry-on bags. Bin
battles can delay flights and leave customers frustrated.” [McCartney,
2008b]
In this vein, Spirit Airlines, the airline that initiated the checked bag fees in
the U.S., started charging fees for carry-on baggage in 2010. They estimated that
charging for carry-on baggage would eliminate the gate delay caused by gate-checking
for carry-on bags that do not fit in the overhead bins. Spirit Airlines estimated
savings of five minutes per flight5 or 20 hours of airplane time per day, which was the
equivalent of two extra planes which cost about $40 million each [McCartney, 2010a].
On the other hand, the switching behavior of the y3 passengers caused those
carriers which did not have the one checked bag fee in place, to experience higher
checked baggage volume. This higher volume brought about additional challenges,
as “[m]oving passenger baggage is an intensely manual operation, requiring lots of
workers. On average, each bag gets touched by about 10 workers during its journey.
Once bags are tagged, they are sorted and placed on carts, then driven planeside,
5According to Spirit Airlines’ CEO, each flight has saved, on average, five to six minutes spent
where a crew loads them into the belly of a jet. The unloading process is more
labor-intensive: Bags are sorted into luggage to be delivered to the carousel for passengers
to collect and luggage that needs to be routed to connecting flights and has to be
sorted and driven to lots of different planes” [McCartney, 2008d]. As the US Airways’
VP of Customer Service Planning simply put it, “[t]he art, or science, of handling
bags is really more complex than people realize” [McCartney, 2008d]. Moreover, the
correlation between on-time dependability and amount of baggage checked has been
pointed out by the American Airlines’ VP of Airport Services [McCartney, 2008c].
Thus, reducing the volume of checked bags should increase the likelihood of on-time
departure. Therefore, we hypothesize that an airline that charges its passengers for
baggage may have a reduced volume of checked bags and thus reduced likelihood of
departure delay. On the other hand, an airline that does not charge its passengers
for baggage may have a high volume of checked bags and thus its flights are more
likely to depart later than their scheduled departure times. Indeed, the distribution
ofxandypassengers (as described before) plays an important role in the operational
impact of baggage fees. Because the theory does not provide a clear direction, we let
the data dictate the correct hypothesis:
Hypothesis 1A. Better relative performance as measured by departure delays is
achieved when charging for one checked bag versus not charging for a checked bag.
Hypothesis 1B. Worse relative performance as measured by departure delays is
achieved when charging for one checked bag versus not charging for a checked bag.
Further, when the airlines which were charging their passengers for one checked
bag instituted a policy change by charging the first two checked bags (see Table 2.2
for exact dates), both x2 and x1 passengers were affected, depending on their price
sensitivity. Regardingx2, their y1 subset of passengers (previously defined) faced the
following options: (1) paying the fees for the first two checked bags, (2) instead of
and potentially having a bigger carry-on bag to make up for one bag, or (3) switching
to a carrier which did not implement such a policy. The y2 subset, as previously
mentioned, identifies withx1passengers, who have the following options: (1) checking
one bag and paying for it, (2) not checking the bag as it is a carry-on bag, or (3)
switching to a carrier which did not implement such a policy.
Letz represent the percentage ofx1 passengers who switch to a carrier which did
not institute the above mentioned policy. Ifz is large, then we hypothesize that the
departure delays encountered by the airlines without fees for the first two checked
bags exceed the departure delays of those airlines which have a one checked bag fee
policy, which in turn are larger than the departure delays of the airlines which do
charge fees for the first two checked bags. Let f and g represent the percentage of
x1 passengers who pay the fee for their one checked bag and those who do not pay
the fee as their bag is a carry-on. If g is large, we expect the departure delays of the
airlines charging fees for the first two checked bags to be larger than the departure
delays of the airlines with a single checked bag fee policy, which in turn exceeds the
departure delays of the airlines without fees for the first two checked bags. Regarding
the larger carry-on bag that passengers might have considered to make up for the
“loss” of a free checked bag (i.e. either the second or the first checked bag), we expect
passengers to exhibit a more pronounced behavior change when facing a change in
baggage policy from one checked bag fee to two checked bags fees, rather than from
no checked bag fee to one checked bag fee. That is, we expect an incremental impact
of implementing fees for the first two checked bags over implementing fees for only
one checked bag.
Similar to the one checked bag fee policy, the theory does not offer a clear direction
of the impact of the first two checked bags fees policy on departure delays, and hence
Hypothesis 2A. Better relative performance as measured by departure delays is achieved when charging for the first two checked bags versus charging only for one
checked bag.
Hypothesis 2B. Worse relative performance as measured by departure delays is
achieved when charging for the first two checked bags versus charging only for one
checked bag.
It is understood that the new policies on checked baggage, motivated by poor
financial performance, required strategic decisions at the carrier level, given the
unknown impact it would have on passengers and on the entire industry. As “service
factories” [Schmenner, 1986], the airlines were facing another challenge in providing
their services as reliably and rapidly as possible. American Airlines declared: “[we]
took extraordinary pains to prepare for the step. We did a lot of research on how our
customers would be impacted. We did a lot of preparation with our airport people
and our flight attendants” [Field, 2009]. United Airlines acknowledged a potential
drawback, given the exemptions accompanying the policies: “determining passengers’
mileage status and ticket types could require more interaction with airline agents”
[McCartney, 2008d]. It seems obvious that a decision of such caliber required closer
coordination and communication within airlines, especially between the marketing
and operations functions. Given the expected disruptions in the boarding process,
we expect airlines allocate more slack in their scheduled block times6 to make up
for departure delays and still arrive on-time, according to the DOT performance
metrics. However, this practice of adding minutes to schedules7 comes at a high cost
to airlines: “Pilot-and flight-attendant costs increase since many are paid based on
6The scheduled block time is the difference between the scheduled arrival time and the scheduled
departure time of a flight.
7Other reasons offered by airlines for this practice are increased congestion at the airports
scheduled time. Maintenance costs rise since many functions are based on how many
hours that engines and airplanes are in service. Inefficient schedules can even mean
more planes are needed to fly the same schedule” [McCartney, 2007]. It also hurts
passengers, who value the most realistic schedules. That is, while from the planning
perspective the increased scheduled block time is viewed as a waste of resources, from
the operational perspective it becomes an opportunity to absorb disruption and avoid
its propagation. Hence, given the previously hypothesized departure performances
(i.e. both worse and better) triggered by implementing checked bags fees policies,
we let the data dictate the correct hypothesis for the impact of these policies on the
scheduled block time:
Hypothesis 3A. As the checked baggage fee policy gets implemented from zero
to one to two bags, the scheduled block time increases.
Hypothesis 3B. As the checked baggage fee policy gets implemented from zero
to one to two bags, the scheduled block time decreases.
2.4
Methods
2.4.1
Data and Variables
The main data source is BTS’ Airline On-Time Performance data, which includes
flight information of all major U.S. airlines that have at least 1 percent of total
domestic service passenger revenues. The data cover nonstop
scheduled-service flights between points within the U.S., and include detailed departure and
arrival statistics by airport and airline, such as: scheduled and actual departure and
arrival times, departure and arrival delays, origin and destination airports, flight
numbers, flight date, one-hour time block based on the scheduled departure/arrival
time (e.g. 6:00am-6:59am), cancelled or diverted flights, taxi-out and taxi-in times,
is an individual flight from its origin airport to the destination airport operated by
its carrier on a given day at a particular time.
An ideal setup for understanding how the implementation of checked bags fees
affects departure performance would be an experiment where, for the same time
period and at the same airports, some airlines charge their passengers for their
baggage while others do not. Because we focus only on the airports used by Southwest
Airlines, which did not impose fees on the first two checked bags (unless they
exceeded the maximum weight limit), our research employs a quasi-experiment that
approximates the ideal setting. For our comparison set, we included all U.S. airlines
with greater than $2B in annual revenues in 2008, i.e. Continental Airlines, Delta Air
Lines, Northwest Airlines, United Airlines, US Airways, American Airlines, JetBlue
Airways8 and AirTran Airways. All but AirTran Airways and JetBlue Airways are
considered “legacy” U.S. airlines (airlines that were operating before the deregulation
of the industry in 1978). Notably, for our purposes, we use Southwest Airlines to
approximate the ideal setup where some randomly selected flights encounter fees for
two pieces of baggage whereas others do not and thus constitute the “control” group.
In our study, Southwest flights act as a pseudo-control for trends and unobservable
factors that can also affect flight delays in addition to baggage fees and other
observable factors such as congestion. For a meaningful comparison, we restricted
our analysis to the 57 origin airports used simultaneously by Southwest Airlines
and one or more of the other airlines (see Table 2.1). These airports constitute
a representative sample of Southwest’s airports, i.e. 89% of the total number of
airports used by Southwest in 2008.
8We performed analysis by first excluding, and later including, JetBlue Airways because the
Table 2.1 The 57 origin airports used by Southwest Airlines and the other airlines in our datasets
Airport Airport Airport Airport
Code Name Code Name
ABQ Albuquerque International Sunport, Albuquerque, NM MSY Louis Armstrong New Orleans International, New Orleans, LA ALB Albany International, Albany, NY OAK Oakland International, Oakland, CA
AUS Austin-Bergstrom International, Austin, TX OKC Will Rogers World, Oklahoma City, OK BDL Bradley International, Hartford, CT OMA Eppley, Omaha, NE
BHM Birmingham International, Birmingham, AL ONT Ontario International, Ontario, CA
BNA Nashville International, Nashville, TN ORF Norfolk International, Norfolk/Virginia Beach, VA BOI Boise, Boise, ID PBI Palm Beach International, West Palm Beach, FL BUF Buffalo Niagara International, Buffalo, NY PDX Portland International, Portland, OR BUR Bob Hope, Burbank, CA PHL Philadelphia International, Philadelphia, PA BWI Baltimore/Washington International, Baltimore, MD PHX Phoenix Sky Harbor International, Phoenix, AZ CLE Cleveland Hopkins International, Cleveland, OH PIT Pittsburgh International, Pittsburgh, PA CMH Port Columbus International, Columbus, OH PVD T. F. Green International, Providence, RI DEN Denver International, Denver, CO RDU Raleigh-Durham International, Raleigh/Durham, NC DTW Detroit Metropolitan Wayne County, Detroit, MI RNO Reno/Tahoe International, Reno, NV
ELP El Paso International, El Paso, TX RSW Southwest Florida International, Ft. Myers, FL FLL Ft. Lauderdale-Hollywood International, Ft. Lauderdale, FL SAN San Diego International, San Diego, CA GEG Spokane International, Spokane, WA SAT San Antonio International, San Antonio, TX HOU William P. Hobby, Houston, TX SDF Louisville International, Louisville, KY IAD Washington Dulles International, Washington, DC SEA Seattle-Tacoma International, Seattle, WA IND Indianapolis International, Indianapolis, IN SFO San Francisco International, San Francisco, CA JAN Jackson International, Jackson, MS SJC Norman Y. Mineta San Jose International, San Jose, CA JAX Jacksonville International, Jacksonville, FL SLC Salt Lake City International, Salt Lake City, UT LAS McCarran International, Las Vegas, NV SMF Sacramento International, Sacramento, CA LAX Los Angeles International, Los Angeles, CA SNA John Wayne, Orange County, CA
LIT Adams Field, Little Rock, AR STL Lambert-St. Louis International, St. Louis, MO MCI Kansas City International, Kansas City, MO TPA Tampa International, Tampa, FL
MCO Orlando International, Orlando, FL TUL Tulsa International, Tulsa, OK MDW Midway International, Chicago, IL TUS Tucson International, Tucson, AZ MHT Manchester-Boston Regional, Manchester, NH
To examine the impact of charging for one checked bag, we selected the flights
in the 35-day period preceding and the 35-day period following the implementation
of one checked bag fee by the specific airline. A 35-day window guarantees four
occurrences of the same day of a week, and is large enough to provide an adequate
sample size but small enough to isolate the impact of the baggage fee policies. Table
2.2 shows the dates when the airlines implemented their fees for one checked bag. For
instance, Continental, as one of the first airlines that started charging for one checked
bag, had its March 31 - June 8, 2008 flights included; AirTran, as the last among our
airlines to charge for one checked bag, had its April 10 - June 18, 2008 flights included.
However, Southwest, as the airline that did not charge for a checked bag (unless more
than two checked bags or overweight), had March 31 - June 18, 2008 flights included.
Using similar criteria as Deshpande and Arıkan [2012] and Arıkan, Deshpande, and
Sohoni [2012], we eliminated some bad records, and the final number of observations
Table 2.2 Dates of implementing fee policies on one checked bag and two checked bags
Airline Date of implementing the fee policy on Date of implementing the fee policy on
one checked bag two checked bags
Continental Airlines May 5th, 2008 October 7th, 2008
Delta Air Lines May 5th, 2008 December 5th, 2008
Northwest Airlines May 5th, 2008 August 28th, 2008
United Airlines May 5th, 2008 June 13th, 2008
US Airways May 5th, 2008 July 9th, 2008
American Airlines May 12th, 2008 June 15th, 2008
AirTran Airways May 15th, 2008 December 5th, 2008
To study the impact of two checked bags fees, we selected the flights of all the
airlines in our study in the March 31, 2008 - January 8, 2009 period. According to
Table 2.2, the boundaries of this period are given by the lower bound of the 35-day
period preceding the earliest implementation of one checked bag fee policy, and the
upper bound of the 35-day period following the last implementation of the two checked
bags fees policy. After eliminating bad records similar to the first dataset, the final
number of observations in this second dataset after excluding cancelled flights was
1,866,208 flights.
For our flight-level datasets, we used data from several sources such as the
BTS9, the FAA10, and the NCDC11 websites. Since most airports are weather
reporting stations, for each origin and destination airports we collected data on
daily precipitation level and average daily wind speed from the NCDC. Additional
variables were computed as well (see Table 2.3). All the variables in our datasets are
described next.
9
http://www.transtats.bts.gov/databases.asp?Mode_ID=1&MODE_Desc= Aviation&Subject_ID2=0(last accessed September 22, 2012).
10
http://www.faa.gov/licenses_certificates/aircraft_certification/aircraft_ registry/releaseable_aircraft_download/(last accessed September 22, 2012).
11
Table 2.3 Description of variables
Variable Description
Bag-F eei {0,1,2}variable indicating whether: a) no checked bag fee policy; or b) one checked
bag fee policy; or c) two checked bags fees policy was implemented on the flighti
date.
SpAdj-Departure-Delayi Difference between the actual departure time and the scheduled departure time
of flighti, adjusted for the spillover from the previous flight in an aircraft rotation.
Scheduled-Block-T imei Difference between the scheduled arrival time and the scheduled departure time of
flighti.
Actual-T urnAround-T imei Turn-around duration between the actual departure time of flightiand the actual
arrival time of the previous flight in an aircraft rotation (not applicable to the first flight in an aircraft rotation).
Routei Origin-destination airports pair of flighti.
Origini Origin airport of flighti.
Carrieri Airline that flew flighti.
M onthi Month of flighti.
Day-of-W eeki Day of week of flighti.
Dep-T ime-Blocki One-hour time block based on the scheduled departure time (e.g., 6:00am-6:59am)
of flighti.
Arr-T ime-Blocki One-hour time block based on the scheduled arrival time of flighti.
Dep-Congestioni Number of flights scheduled to depart between 45 minutes before and 15 minutes
after the scheduled departure time of flighti.
Arr-Congestioni Number of flights scheduled to arrive between 45 minutes before and 15 minutes
after the scheduled arrival time of flighti.
Aircraf t-Agei Age of the aircraft that flew flighti.
Avg-P assengersi Expected number of passengers on the aircraft that flew flighti.
Origin-P rcpi Precipitation level at the origin airport on the day of flighti(tenths of mm).
Dest-P rcpi Precipitation level at the destination airport on the day of flighti(tenths of mm).
Origin-Awndi Average wind speed at the origin airport on the day of flighti(tenths of meters
per second).
Dest-Awndi Average wind speed at the destination airport on the day of flighti(tenths of meters)
per second).
2.4.1.1 Explanatory Variable
Checked bag fee. TheBag-Feeordinal variable indicates the status of each flight in
our datasets with regard to the checked bag fee policy of the airline that flew the flight.
Thus,Bag-F ee=1 indicates a flight with the one checked bag fee policy implemented
by the specific airline on that specific date, whereasBag-F ee=0 indicates the absence
of such policy, i.e. no checked bag fee policy is implemented by the airline. Further,
Bag-F ee=2 indicates a flight with the first two checked bags fees policy implemented
by the airline on that specific date. Thus, the variable Bag-Fee has three levels, and
2.4.1.2 Dependent Variables
Scheduled block time. For each flight i in our datasets, we computed the
Scheduled-Block-Time (Qi) as the difference between the scheduled arrival time and
its scheduled departure time, as shown in the carrier’s Computerized Reservations
System (CRS).
Spillover-adjusted departure delay. According to BTS, the departure
performance is based on departure from the gate. The departure delay is given by
the difference between the actual departure time and CRS departure time. In case
the actual departure occurs prior to the scheduled departure, the departure delay
becomes zero as a negative departure delay does not represent a “true” delay. Also,
a delay on one flight can potentially spill-over, or propagate, to the next flight since
any given aircraft for an airline typically flies multiple flights over the course of a
day. Therefore, our main dependent variable is spillover-adjusted departure delay
(SpAdj-Departure-Delay), which we computed for each flight i in our datasets by
subtracting any late aircraft delay from the previous flight i− 1 in the aircraft’s
rotation, from the departure delay of flight i. This eliminates the serial correlation
between observations in our dataset induced by consecutive flights using a common
aircraft routing.
To calculate the spillover, we follow Arıkan, Deshpande, and Sohoni [2012]’s
approach. Thus, we consider the sequence of flights operated by a particular tail
number as an aircraft rotation. More specifically, an aircraft’s rotation begins with
the first revenue flight after a major maintenance, or a layover of more than five hours
at an airport, and ends with the last flight operated before the aircraft returns for
its next maintenance or remains on the ground for several hours.12 Further, we refer
to the actual block time of a flight as DiL, and compute it as the difference between
12As crew schedule information is not publicly available, we assume that airline crews remain
the actual arrival time of the flight and its scheduled departure time. Unlike the
traditional definition of actual block time, i.e. the difference between the actual arrival
time of the flight and its actual departure time, our definition captures the impact of
flight delays propagated through the system and departure delays associated with the
observed flight. The actual block time is comprised of several components including
taxi-out time, en route time, and taxi-in time, each one being subject to different
causes of delay, and thus the total block time delay is the sum of all individual
component delays.
The time duration between the next flight’s scheduled departure time, on an
aircraft rotation, and the earlier flight’s scheduled arrival time is referred to as the
scheduled ground time (Gi). In order to compute Gi, from the Airline On-time
Performance dataset, we first sorted the data by airline, tail number and scheduled
departure time so that all aircraft rotations are grouped together. Then, for each
flighti, we computedGi by subtracting the scheduled arrival time of flighti−1 from
the scheduled departure time of flight i. A snapshot of one such aircraft rotation
flown by Southwest Airlines’ aircraft with tail number N208WN is shown in Table 2.4.
We computed the minimum time to turn an aircraft (Ti) by analyzing ground
times at different airports for different types of aircraft for each airline. First, we
grouped the actual ground-times for each flight flown in 2008 by airline, aircraft
model, and departure airport. We then computed the 5th percentile value (in
minutes) across all actual ground-times for each airline, aircraft model, and departure
airport combination. Additionally, we calculated the 5thpercentile value (in minutes)
of actual ground-times for each airline-aircraft model and airline-departure airport
combinations. The minimum turn-around time for the corresponding flight i was
assumed to be this 5th percentile. Further, the buffer time available on ground for
flight i, Bi, is calculated by subtracting Ti from Gi for all flights except the first
Table 2.4 A snapshot of aircraft rotation: Southwest Airlines’ aircraft with tail number N208WN
Position Route CRS Actual CRS Actual
Departure Time Departure Time Arrival Time Arrival Time
1 MHT–MDW 7:10 AM 7:12 AM 8:35 AM 8:55 AM
2 MDW–HOU 9:05 AM 9:27 AM 11:35 AM 11:55 AM
3 HOU–LAS 12:05 PM 12:27 PM 1:10 PM 1:32 PM
4 LAS–RNO 1:40 PM 2:00 PM 3:00 PM 3:09 PM
5 RNO–LAS 3:30 PM 3:42 PM 4:45 PM 4:56 PM
6 LAS–BUF 5:15 PM 5:31 PM 12:40 AM 12:45 AM
Scheduled Actual Scheduled Ground Minimum Turn- Buffer Time Spillover Block Time (Qi) Block Time (DiL) Time (Gi) Around Time (Ti) (Bi) (Li)
145 min 165 min - - -
-150 min 170 min 30 min 25 min 5 min 15 min
185 min 207 min 30 min 20 min 10 min 10 min
80 min 89 min 30 min 22 min 8 min 14 min
75 min 86 min 30 min 18 min 12 min 0 min
265 min 270 min 30 min 22 min 8 min 3 min
be zero. Thus, the spillover, Li, from flight i−1 to flighti is given by
Li = [DiL−1−(Qi−1 +Bi)]+.
Therefore, we computed the spillover-adjusted departure delay of a given flight
by subtracting the spillover from the previous flight in the aircraft’s rotation, from
the departure delay:
SpAdj-Departure-Delayi = (Actual Departure Timei −CRS Departure Timei)+−Li.
Actual turn-around time. The time duration between the next flight’s actual
departure time, on an aircraft rotation, and the earlier flight’s actual arrival time is
referred to as Actual-TurnAround-Time.
2.4.1.3 Controls
Typical factors that influence departure delays are seasonal (e.g. passenger load
factor, weather, etc.), daily propagation related (e.g. late arriving crew, late arriving
random (e.g. mechanical problems, baggage problems, security delays) [Tu, Ball, and
Jank, 2008]. Since June 2003, the airlines that report on-time data to the BTS also
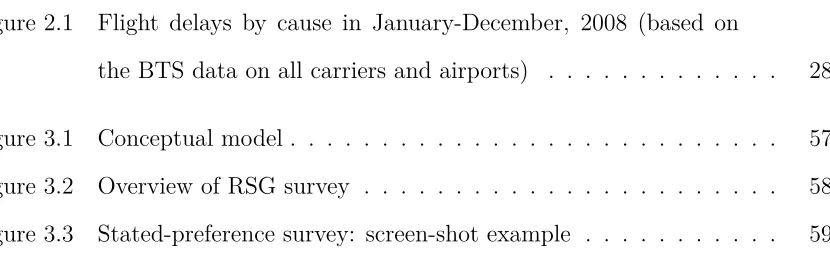
report the causes of delays13 for their flights. Figure 2.1 shows, for example, the
flight delays by cause in the year 2008, across all U.S. airports. The weather shows
up as the main source of delays, followed by air carrier delay (e.g. maintenance or
crew problems, aircraft cleaning, baggage loading, fueling, etc.), aircraft arriving late,
National Aviation System (e.g. airport operations, heavy traffic volume, air traffic
control, etc.), and lastly, security delay. However, a shortcoming of the Airline
On-Time Performance data is that the source of delay cannot distinguish between origin
and destination airports. By using individual flight level congestion and weather
related control variables at the origin and destination airports, and spillover-adjusted
departure delay as dependent variable, we do control for the main drivers of flight
delays. Hence, our conclusions related to baggage fees and departure delays are
robust, given that we used the following control variables:
Route. The Route variable captures all the fixed effects of an origin-destination pair
for each flight.
Origin. The Origin variable controls for unobserved origin airport specific effects
such as maintenance facilities, airport capacity, etc. that can potentially affect flight
departure.
Carrier. The Carrier variable denotes the airline that flew the flight, and controls
for airline specific effects.
Congestion at the origin/destination airport. Unlike prior literature which
used an average congestion measure, we computed two congestion measures for each
individual flight, i.e.: 1) departure congestion, Dep-Congestion, as the number of
13The causes of delays are reported in the following broad categories: air carrier, extreme weather,
Figure 2.1 Flight delays by cause in January-December, 2008 (based on the BTS data on all carriers and airports)
flights scheduled to depart in an adjacent time block (i.e. between 45 minutes
before and 15 minutes after the scheduled departure time of that flight) from the
origin airport, that can potentially delay the flight, and 2) arrival congestion,
Arr-Congestion, as the number of flights scheduled to arrive in an adjacent time block
(between 45 minutes before and 15 minutes after the scheduled arrival of that flight)
at the destination airport.
Month. The Month variable denotes the month of the flight which controls for the
seasonal demand fluctuations.
Day of the week. The Day-of-Week variable indicates the day of the week of the
flight, controlling thus for lighter versus heavier travel days.
Departure/arrival time block. Because delays are generally expected to worsen
over the course of a day, we useDep-Time-Block/Arr-Time-Block variables to control
for the one-hour time block of the scheduled departure/arrival time (e.g.,
Age of aircraft. As the tail number is an unique identifier for each aircraft, we used
it to collect the aircraft’s year of manufacturing from the Aircraft Registry Database
hosted by FAA. Hence, we were able to compute the age of the aircraft as of the year
of the flight.
Average number of passengers. The uniqueness of the tail number also offers
information on the number of seats of each aircraft, as per the Aircraft Registry
Database. We multiplied this seating capacity by the load factor we collected from
BTS’ T-100 Domestic Segment (U.S. Carriers). As the load factor is the monthly
proportion of total seats that were actually filled for an airline on a specific route, we
were able to compute the average number of passengers on each flight, thus controlling
for the demand for air travel.
Weather related variables. Adverse weather conditions increase the likelihood of
making adaptation decisions. Thus, the precipitation level (tenths of mm) on the
day of the flight at the origin and destination airports are captured by Origin-Prcp
and Dest-Prcp variables. Similarly, the average wind speed (tenth of meters per
second) on the day of the flight at the origin and destination airports are captured
byOrigin-Awnd and Dest-Awnd variables.
A summary of descriptive statistics of the continuous variables used in our analysis
is presented in Table 2.5.
2.4.2
Models
Previous studies have investigated the impact of various factors on departure delay
by examining OLS and instrumental variables estimates. However, to evaluate the
impact of charging for checked bags on departure delay, we employ the censored
Table 2.5 Descriptive statistics
Variable First dataset Second dataset
N Mean SD N Mean SD
SpAdj-Departure-Delay 513,907 6.0995 22.8233 1,866,208 6.2358 23.6840 Scheduled-Block-Time 512,928 138.3611 71.9553 1,861,809 140.2325 72.5715 Actual-TurnAround-Time 365,087 47.4051 30.5309 1,316,591 49.3889 31.5419
Dep-Congestion 513,907 19.6835 14.3445 1,866,208 19.2749 14.3013
Arr-Congestion 513,907 24.3167 21.0789 1,866,208 24.5563 21.5455
Aircraft-Age 492,170 10.2811 8.5675 1,781,660 11.2789 8.0856
Avg-Passengers 492,233 107.9543 29.9775 1,791,887 105.9316 31.9048
Origin-Prcp 510,868 18.5503 67.9132 1,863,071 19.4913 72.9711
Dest-Prcp 511,290 20.6380 69.7319 1,863,394 21.4509 78.0365
Origin-Awnd 488,641 39.5498 16.6166 1,830,698 34.0933 16.0301
Dest-Awnd 491,503 41.2326 17.5546 1,834,650 35.9083 16.8022
Let yi represent the time when a flight i is ready for take-off and let
CRSdeparturei represent the scheduled departure time shown in the carrier’s CRS.
Then, departure delay is:
DepartureDelayi = (yi−CRSdeparturei)+.
However, yi is a latent variable and DepartureDelayi is the observed variable.
Hence, a Tobit regression model is appropriate here. Moreover, standard regression
techniques (OLS) provide inconsistent parameter estimates when applied to a large
number of observations in the sample equal to the lower bound for the dependent
variable [Greene, 2008]. In the Tobit model, which uses the maximum likelihood
estimation, the statistical significance of individual parameter estimates is evaluated
by Wald Chi-square tests which replace the t-tests in OLS14
The estimation model of the impact of the checked bag fees on the
spillover-adjusted departure delay is shown in Eq.2.1. We use the first dataset to differentiate
between the effects of charging for one checked bag (Bag-F ee=1), respectively not
charging for a checked bag (Bag-F ee=0), and label this model Tobit1. In addition,
to concurrently disentangle the effects of charging for the first two checked bags
(Bag-F ee=2), only charging for one checked bag (Bag-F ee=1), and not charging for
a checked bag (Bag-F ee=0), we use the second dataset and label the model Tobit2.
SpAdj-Departure-Delayi = β0+β1∗(Bag-Feei = 1) +β2∗(Bag-Feei = 2) +
β3∗Routei+β4∗Origini+β5∗Carrieri+
β6∗Monthi+β7∗Day-of-Weeki+
β8∗Dep-Time-Blocki+β9∗Arr-Time-Blocki+
β10∗Dep-Congestioni+β11∗Arr-Congestioni+
β12∗Aircraft-Agei+β13∗Avg-Passengersi+
β14∗Origin-Prcpi+β15∗Dest-Prcpi+
β16∗Origin-Awndi+β17∗Dest-Awndi+εi. (2.1)
To analyze the impact of Bag-Fee on Scheduled-Block-Time, we use the second
dataset to test the model in Eq.2.2, an OLS regression model (labeled OLS1) as
Scheduled-Block-Time is not affected by censoring. Given that the scheduled block
time is typically determined several months in advance based on the estimates of the
time it takes to complete each flight [Deshpande and Arıkan, 2012], the model does
not include weather related variables.
Scheduled-Block-Timei = β0+β1∗(Bag-Fee= 1) +β2∗(Bag-Fee= 2) +
β3∗Routei+β4∗Origini+β5∗Carrieri+
β6∗Monthi+β7∗Day-of-Weeki+
β8∗Dep-Time-Blocki+β9∗Arr-Time-Blocki+
β10∗Dep-Congestioni+β11∗Arr-Congestioni+