1436
Comparison of SNR Values for Different Wavelet
Functions using Wavelet Packet Transformation
Dr Afroz
1, Imtiyaz Ahmad Wani
2Department of Mathematics1,2, MANUU, Hyderabad, India1,2
Email: [email protected]1 ,[email protected]2
Abstract- In recent years an important contribution to the world of science has been electrocardiogram (ECG). It
is no doubt an important Signal in biomedical science. This ECG is being analysed through a particular processing of wavelet transformation. It offers a reliable and valuable source of information for the expertise. It further adds the information regarding the heart disease. Among scores of techniques that are used for its analysis, wavelet transformation produces the best result and is very much acute in the diagnosis of cardiac arrhythmias. However, it needs an ECG with a minimum possible noise trapped during the processing of ECG. Recognising the importance of different methods that have been used so far, the paper intends to propose an algorithm for denoising the process of ECG. It is cogent to mention that the conduct of SNR values are noticed based on three mathematical formulae derived from an increasing function associated with threshold values. A comparison of SNR values between synthesis ECG and corresponding details coefficients is also discussed. Finally a comparison of SNR values obtained on using Haar Wavelet, Symlet-2, db-3, coef-2 and bior-1.3 wavelet in the proposed algorithm is shown. This algorithm is performed on a sample of ten ECG provide by MIT BIH Arrhythmias data base through an important transformation method namely Wavelet Packet Transformation.
Keywords-Wavelet transformation, Wavelet functions, thresholding, wavelet packet transformation
1.
INTRODUCTIONAn important and primary issue that occurs during recording of an ECG is noise addition in it[1].Therefore the morphological structure of an ECG gets disturbed and affects in proper diagnosis of diseases due to the following types of noises: power-line interference, basepower-line wander, electromyography noise, additive white Gaussian noise (AWGN) etc. Hence denoising ECG signal is of primary importance. In past, lot of techniques were applied in this aspect which banked upon type of the noise in ECG and the characteristics of noise. Wavelet domain filtering, empirical mode decomposition (EMD) based thresholding, artificial neural network[2], genetic algorithms[3], and other methods. One cardiac cycle of ECG signal consists of the P, Q, R, S and T waves along with some intervals and QRS Complex. QRS complex originally developed by Pan and Tompkins[4] The drawback in their algorithm was that the frequency variation in QRS complex negatively affects their performance. Therefore Hamilton and Tompkins developed a real time QRS detection algorithm in the C language[5]. Band pass filtering and temporal filtering [6] were also applied for QRS complex detection but did not provide simple way of selecting bandwidth of the filter and width of sliding window [7].
1437
2.
PARAMETERS TO BE USED IN THISPAPER
2.1.Wavelet
Wavelet is a mathematical function or a small wave which cuts a signal into different frequency components. The general wavelet function is defined as
( )
1
,
t
t
s
s
s
=
−
(1)
where
L R
2( )
is called mother wavelet and this set forms an orthonormal wavelet basis in the function spaceL R
2( )
‘
’ is called shifted parameter that represents the location of the window on time axis i.e. it represents part of the signal which is being analysed and ‘s’ is a scaling factor. The conditions of a function to be mother wavelet are as follows:(1) A wavelet should be of finite energy i.e.
( )
2E
=
t
(2) A mother wavelet is a function of zero average[14] i.e.
( )
t dt
0
−
=
(3) The Fourier transform of
at
=0 is Zero [15] i.e.ˆ (
0)
( )
t dt
0
−
=
=
=
Wavelets are perfectly reconstruction function with linear and higher order polynomial shapes such as rectangle, triangle, 2nd order polynomial etc. therefore wavelets are able to denoise the particular signal better than conventional filters. Different wavelets have different characteristics but there exist no universal rule in selecting a particular type of wavelet. ECG signal is non-stationary signal which demands wavelet for its analysis. It also has linear phase shift which also demands a wavelet to be symmetrical function. Since QRS has highest slope having characteristics in its shape and event is localized in time which also makes sense of applying wavelets in its analysis. In this paper we are going to use Haar wavelet, Symlet wavelet, db-3, Coef-2 which are orthogonal wavelet and one biorthogonal wavelet namely Bior-1.3 wavelet which are symmetrical and near symmetrical in nature. Also the experimentation is carried out for denoising of ECG signal in presence of power- line interference. Here the wavelets have no explicit expression except for Haar Wavelet. The Haar Wavelet is defined as
( )
1 ;
0
1 / 2
1 ;
1 / 2
1
0 ;
otherwise
x
x
x
= −
(2)The scaling function of this Haar Wavelet is
1 ; 0
1
( )
0 ; otherwise
x
x
=
(3)3. TRANSFORMATION USED IN THIS
PAPER
3.1.Continuous Wavelet Transformation
The continuous wavelet transformation of a signal
( )
f t
is defined as [16]( )
1
( )
,
ft
W
s
f t
dt
s
s
−−
=
(4)Here
is the wavelet function. The complexconjugate * is used only if wavelet function is complex function otherwise not. Also‘s’ and ‘
’ are defined in 2.1. As mentioned in introduction section that wavelet transformation is one of the best approaches for denoising signal. Here in CWT a signal (continuous function) is divided into wavelets i.e. in terms of inner product CWT is actually inner product of a time varying signal f(t) and set of waveletsψ
(t)
s,
given in [17] as1
*
t-τ
W (s, )= f,ψ
=
f(t)ψ
dt
s,
s
s
f
(5)
where ‘s’ is a scale factor and ‘
’ is a translation factor. Also * is a complex conjugate.ψ
is called mother wavelet and it generates a family of functions known as daughter wavelet by scaling and translation ofψ
. The mother wavelet is given by
1
t-τ
ψ
(t)=
ψ
s,τ
s
s
(6)where
s>0
. If s>1 then wavelets are dilated and if s<1 then wavelets are contracted. The constant1
1438
3.2. Discrete Wavelet Transformation
Discrete wavelet transformation is a wavelet transformation where wavelets are discretely sampled. i.e. DWT is in fact the continuous wavelet transformation but with discrete scale and translation. So, the wavelet transformation is evaluated on discrete values of scale and translation defined as
s=s
0iand
translation
τ=kτ s
0 0i , where i and k are integer and0
s >1
.The discrete wavelets are defined mathematically:( )
20 0 0 0
ψ
(t)=
ψ(s (t-kτ s )
i,k
i
i i
s
− −
Or
( )
2 10 0 0
ψ
(t)=
ψ(s t-kτ )
i,k
i
s
− −
(7)
Here we note that the discrete wavelet depends on
0 0
s and τ
. Whens
0is close to 1 andτ
0is small then discrete wavelets behave like continuous wavelets. The discrete wavelet transformation for a signal (function)f(x)
is given by:*
W (i,k)= f(t).ψ
(t)dt= f(t),ψ
f
(i,k)
i,k
(8)Where f can be reconstructed by mathematical formula from discrete wavelet transform as given below
( )
f(t)=A
W
i,k h
(t)
f
i,k
i k
(9)
Here A is a constant independent of signal f(t).
Since discrete wavelet transformation is discretization of continuous wavelet transformation. DWT decomposes the frequency plane into dyadic bandwidths with resolution in exponential form. But this transformation is not flexible in analysing signal for a particular frequency bandwidth. Wavelet packet transformation is generalization of wavelet transformation. This concept was introduced by Coifman, Meyer and Wickerhauser [13] in which both approximation and detail coefficients are further decomposed into approximation and details at each level that is not the case in wavelet transformation decomposition. Because it only decomposes the signal into approximation and details at the very first level then on subsequent level only approximation is decomposed further into new approximation and
details. Doing this has chances of losing information of the signal incorporated into details. That could be more important in making the expected inferences of the given signal for the investigation. Below diagrams shows the difference between the wavelet decomposition and wavelet packet decomposition.
So, in this paper we make use of wavelet packet transformation on the subject of analysis provided by MIT-BIH available on physio.net. Wavelet packet transformation is the generalization of Discrete Wavelet Transformation. It is more flexible tiling of the frequency plane arises greatly in case of analyzing for specified frequency bandwidth. This concept was brought by Coifman, Meyer and Wickerhauser [18], [19].
4. THRESHOLDING
[image:3.595.319.503.339.426.2]As we know signals carry noise with them. In order to remove noise from the signal we need some techniques which would help us to do so. In literature we do have some of the techniques[20] which helps us in denoising signal such as thresholding techniques
Fig. 1. Wavelet Decomposition h[n] is Approximation and g[n] is detail
Fig. 2. Wavelet Decomposition h[n] is Approximation and g[n] is detail
level 2
level 1
s[n]
h[n]
h[n]
g[n]
g[n]
level 2 level 1
s[n]
h[n]
h[n]
g[n]
g[n]
h[n]
[image:3.595.334.486.516.622.2]1439 which includes hard thresholding[21], soft
thresholding[21], hybrid thresholding[22], sure shrink thresholding[23] etc. In thresholding what we do is to remove small wavelet coefficients to zero which is actually noise present in the signal. This thresholding depends on a value T known as threshold value. If we take small value of T such that some coefficients which represents noise will still remain in the estimated signal. Then we don’t get the proper denoised signal. In the similar fashion on taking large Value of T will remove some wavelet coefficients which do not belong to noise will also create a problem in getting denoised signal for proper analysis. Such a problem is shown by SNR values. More is the SNR value, better is the accuracy of denoising. So we need optimal threshold value of T which maximise the SNR. Let us define a function for threshold value as given below:
( )
n
n
log
( )
N
=
(10)
where n is natural number and N is sample size i.e. size of the signal. This function is an increasing function of ‘n’. if n=2, then
T=
=
2log(N)
(11)
Where N is length of the signal and
2is the variance obtained in the finest level of detailed coefficients. Such a threshold value is known as Universal threshold value given in [24] For n=1 and 3 we get:T=
log( )
N
(12)
2
is the variance obtained in the finest of detailed coefficients.T=
3log(N)
(13)
σis the standard deviation of the noise and can be calculated from median of detailed coefficients. In this paper we apply all of them separately and then take mean of the three and compare the results to each other.
5. ALGORITHM
Step 1. A noisy ECG signal is first decomposed with the help of wavelet transform at level 3 into approximation and detail coefficients. Step 2. Obtained threshold value from detailed
coefficients at finer level with the help formula mentioned above and then their
mean for next step for the comparison purpose.
Step 3. Now apply Wavelet Packet Transformation for denoising the ECG signal at the threshold value obtained in step 2.
Step 4. Reconstruct the denoised ECG signal by inverse wavelet packet transformation through MATLAB Wavelet Tool Box. Step 5. Compare the results of SNR given by
2 1
10
2 1
( ( )
( ))
10 log
ˆ
( ( )
( ))
N
i N
i
y i
x i
SNR
x i
x i
=
=
−
=
−
(14) Where y(i) and x(i) are noisy ECG and Original ECG signal and
x i
ˆ( )
is the estimated ECG signal.6. ANALYSIS
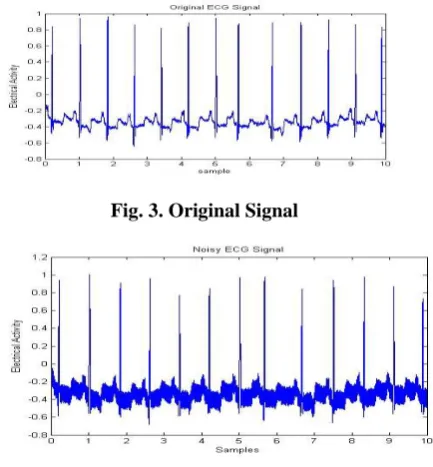
[image:4.595.314.531.429.663.2]Let us apply the algorithm for the sample ‘100m.mat’ obtained from MIT-BIH ECG arrhythmia data base having 3600 samples/ signal and sampling rate 360 Hz with recording duration of 10 seconds.
Fig. 3. Original Signal
1440
7. ANALYSIS TABLES
Table 1:
Haar Wavelet
Threshold Values from synthesised ECG
logN
2 logN 3 logN Average threshol
d
SNR 1.0874 0.7998 0.6778 0.8147
Table 2:
Haar Wavelet
Threshold Values from Detail Coefficient of ECG
logN
2 logN 3 logN Average threshold
SNR 0.9066 0.6825 0.5853 0.7248
Table 3:
Symlet-2 Wavelet
Threshold Values from Detail Coefficient of ECG
logN
2 logN 3 logN Average threshold
SNR 1.6143 0.4877 1.0857 0.8147
Table 4:
Symlet-2 Wavelet Threshold
Values from Detail
Coefficient of ECG
logN
2 logN 3 logN Averag e thresho
ld SNR 1.189
1
0.8289 0.6995 0.8147
It clearly shows from the analysis in the above four tables that more the threshold values lesser the SNR and all the tables indicate that as the value of
1
0,
2
T
, the value of SNR is good inside the interval than outside the interval from the right which is true as the noise in the signal is always lesser in the measurement than the signal values in the context of wavelet analysis. More importantly in above all tables denoising is shown better when standard deviation for getting threshold value is taken from synthesised signal than when standard deviation is taken from the details coefficients. Moreover thresholding is betterthrough the threshold value taken from
log
N
[image:5.595.319.530.356.481.2]than from
2 log
N
,
3log
N
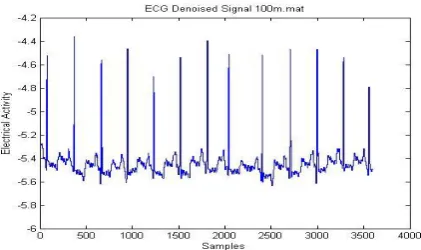
and so on. On denoising the signal so obtained after this analysis looks like in the figure given below:Fig. 5. Denoised ECG signal by above algorithm
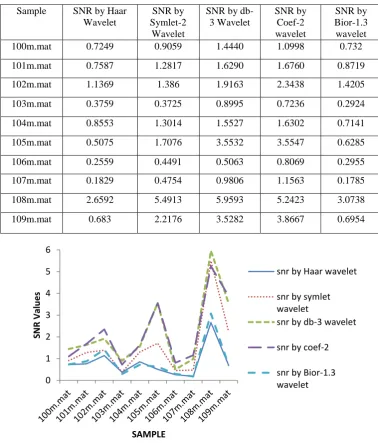
1441 The scatter plot of SNR values conveys that
the algorithm works better in coef.-2 wavelet followed by db-2, symplet-2, bior-1.3 and Haar wavelet somehow in order. This means all the wavelets under discussion works in denoising the signal but varies in results. This is because of the property difference between them. Since coef.-2, symplet and db-3 shows better SNR results than Biorthogonal may be because later is biorthogonal in nature and rest including Haar wavelet are orthogonal in nature. Haar Wavelet shows lesser denoising than Bior-1.3 may be being discontinuous in nature. Finally one should keep properties of wavelet in view in the selection of wavelet for denoising of a signal and the properties of the signal itself.
8. CONCLUSION
[image:6.595.104.483.108.552.2]In this paper, denoising algorithm is proposed and is tested on ten ECG samples provided by MIT BIH Arrhythmias database. Furthermore, a comparison of denoising is done by taking threshold values provided by mathematical functions used in different research works. Hence the results of some of the wavelet functions are compared at level 3. This comparison is shown in terms of SNR as an average of three SNR values obtained separately from given mathematical formulae by soft thresholding method. Finally denoising is found better in taking Coef-2 wavelet as a wavelet function in the algorithm than by taking other wavelets in this paper. The simulation of this whole paper is done in MATLAB.
Table 5:
Sample SNR by Haar Wavelet
SNR by Symlet-2
Wavelet
SNR by db-3 Wavelet
SNR by Coef-2 wavelet
SNR by Bior-1.3 wavelet
100m.mat 0.7249 0.9059 1.4440 1.0998 0.732
101m.mat 0.7587 1.2817 1.6290 1.6760 0.8719
102m.mat 1.1369 1.386 1.9163 2.3438 1.4205
103m.mat 0.3759 0.3725 0.8995 0.7236 0.2924
104m.mat 0.8553 1.3014 1.5527 1.6302 0.7141
105m.mat 0.5075 1.7076 3.5532 3.5547 0.6285
106m.mat 0.2559 0.4491 0.5063 0.8069 0.2955
107m.mat 0.1829 0.4754 0.9806 1.1563 0.1785
108m.mat 2.6592 5.4913 5.9593 5.2423 3.0738
109m.mat 0.683 2.2176 3.5282 3.8667 0.6954
Fig. 6. SNR Comparison in Scatter plot 0
1 2 3 4 5 6
SN
R
V
al
u
e
s
SAMPLE
snr by Haar wavelet
snr by symlet wavelet
snr by db-3 wavelet
snr by coef-2
1442
REFERENCES
[1] G. D. Clifford, F. Azuaje, and P. E. McSharry. “Advanced Methods and Tools for ECG Analysis”. 2006.
[2] A. Efros and T.Leug. “Texture Synthesis by Non Parametric Sampling”. in In Proc. Ins. Conf. Computer Vision, volume 2, pp. 1033–1038, 1999. [3] Y. Meyer. “Oscillating Patterns in Image Processing and Nonlinear Evoluation Equation”.AMS Univerity Lect. Ser., vol. 22, 2002.
[4] J. Pan and W.J. Tompkins. “A real-time QRS Detection Algorithm”.IEEE Trans. Biomed. Eng., vol. 32, pp. 230–236, 1995.
[5] P. S. Hamilton and W.J.Tompkins. “Quantitative Investigation of QRS Detection Rules Using the MIT/BIH Aarythmia Database,” IEEE Trans. Biomed. Eng., vol. 33, pp. 1157–1165, 1986. [6] H. A. N. Dinh, D.K.Kumar, N.D.Pah, and
P.Burton. “Wavelet for QRS Detection”. in proceeding of the 23rd annual EMBS iternational conference, Turkey, 2001.
[7] N.V.Thakor, J. G. Webster and W.J.Tompkins, “Estimation of QRS Complex Power Spectra for Design of a QRS Filter,” IEEE Trans. Biomed. Eng., vol. 31, pp. 702–706, 1986.
[8] A. P., “Wavelet Transform and the ECG: A review”. Physiol Meas, vol. 26, pp. 155–199, 2005.
[9] B. Singh and A. Tiwari. “Optimal Selection of Wavelet Basis Function Applied to ECG Signal Denoising”. Digital signal process, vol. 16, pp. 275–287, 2006.
[10] L.N.Sharma, S.Dandapat and A. Mahanta. “ECG Signl Denoising Using Higher Order Statistics in Wavelet Subbands”.Biomed. Signal Process. Control, vol. 5, pp. 214–222, 2010.
[11] U. Seljuq, F.Himayun and H.Rashid. “Selection of an Optimal Mother Wavelet Basis Function for ECG Signal Denoising”.IEEE Trans. Biomed. Eng., pp. 26–30, 2014.
[12] T. Sharma and K. K. Sharma. “QRS Complex Detection in ECG Signals Using Locally Adaptive Weighted Total Variation Denoising”.Comput. Biol. Med., vol. 87, no. February, pp. 187–199, 2017.
[13] R.R.Coifman,Y.Meyer and V.Wickerhauser, “Wavelet analysis and signal processing”.Wavelet Their Appl., pp. 453–470, 1992.
[14] R. S. Meena and A. Sharma. “Comparison and Analysis of Orthogonal and Biorthogonal Wavelets for ECG Comprssion”. no. 2, pp. 242– 247, 2014.
[15] A. Mertins. “Signal Analysis: Wavelets, Filter Banks, Time-frequency transforms and applications”. 1999.
[16] S. PaulAddison. “ The illustrated wavelet transform handbook”. Napier University, Edinburgh, UK, 2002.
[17] Y.sheng.“Wavelet Transform Handbook”. CRC Press Inc, 1996.
[18] R. R. Coifman, Y. Mayer and V.Wickerhauser. “Wavelet Analysis and Signal Processing”.Wavelet Their Appl., vol. 38, pp. 453–470, 1992.
[19] R. R. Coifman, Y. Meyer and M. V. Wickerhauser. “Wavelet Analysis and Signal Processing”. in Wavelets and Their Applications, 1992, pp. 153–178.
[20] K. D. Priya, G. S. Rao and P. S. V. S. Rao. “Comparative Analysis of Wavelet Thresholding Techniques with Wavelet-wiener Filter on ECG Signal”.Procedia Comput. Sci., vol. 87, pp. 178– 183, 2016.
[21] D. L. Donoho, “Denoising by Soft Thresholding”.IEEE Trans. Biomed. Eng., vol. 41, no. MAY, pp. 613–627, 1995.
[22] Chmelka and J.Kozumplik. “Wavelet-based Wiener Filter for Electrocardiogram Signal Denoising”.Comput. cardiol, vol. 32, pp. 771– 776, 2005.
[23] D.L.Donoho and I. M. Johnstone. “Adapting to Unknown Smoothness via Wavelet Shrinkage”.J.Am.Statis Ass. L., vol. 90, pp. 1200– 1224, 1995.
![Fig. 1. Wavelet Decomposition h[n] is Approximation and g[n] is detail](https://thumb-us.123doks.com/thumbv2/123dok_us/734235.1083071/3.595.334.486.516.622/fig-wavelet-decomposition-h-n-approximation-g-n.webp)