World Maritime University
The Maritime Commons: Digital Repository of the World
Maritime University
World Maritime University Dissertations Dissertations
2015
Relationship between maritime logistics
performance and international trade
competitiveness : A case study of Nigeria in Central
West African cluster of countries
Victor Isioma Onyemejor World Maritime University
Follow this and additional works at:http://commons.wmu.se/all_dissertations
Part of theTransportation Commons
This Dissertation is brought to you courtesy of Maritime Commons. Open Access items may be downloaded for non-commercial, fair use academic
Recommended Citation
Onyemejor, Victor Isioma, "Relationship between maritime logistics performance and international trade competitiveness : A case
study of Nigeria in Central West African cluster of countries" (2015).World Maritime University Dissertations. 503.
WORLD MARITIME UNIVERSITY
Malmo, Sweden
RELATIONSHIP BETWEEN MARITIME
LOGISTICS PERFORMANCE AND
INTERNATIONAL TRADE COMPETITIVENESS:
A case study of Nigeria in Central West African cluster of countries
By
VICTOR ISIOMA ONYEMEJOR
Nigeria
A dissertation submitted to the World Maritime University in partial
Fulfilment of the requirement for the Award of the degree of
MASTER OF SCIENCE
In
MARITIME AFFAIRS
(SHIPPING MANAGEMENT AND LOGISTICS)
2015
Acknowledgements
I would like to extend my sincere thanks to the people that are part of the success of
this project. Firstly, I thank the Almighty God who made it possible for me to live to
start and finish this project. My gratitude goes to the Presidency of the Federal
Republic of Nigeria for providing funds for my studies. I would like to express my
sincere gratitude to my supervisor Professor Shuo Ma, for his support, motivation,
and immense knowledge. His guidance was helpful in the research and in writing of
this dissertation. I also thank Inger Battista for her linguistic polishing of the final
draft of the dissertation.
I would like to thank the library team: Chris Hoebeke, Anna Volkova and Erik
Ponnert for ensuring that I have all the necessary materials and tools needed for my
research and in writing this dissertation. I thank Erik specially for taking time out of
his busy schedule to teach me some IT skills which enhanced this dissertation. I also
thank my M.Sc. colleagues from Nigeria: Lawrence Chukwu, Adamu Alamba,
Anthonia Uchegbulam, Christopher Oguns, Sani Abubarkar, Olusola Lawal and
Olusoji Akinbade, whose insight, guidance and advice helped in designing the
research instrument.
I am grateful to my research assistant-Mr. Owolabi Kosoko of Maersk Nigeria for his
assistance in bridging the distance gap between Nigeria and Sweden and collating
returned questionnaires in Nigeria. I would like to express my special gratitude and
thanks to my friends/colleagues in the industry: Olumide Adefisan (Damco) &
Promise Ukwunna (Damco), Anthony Iworisha (CMA-CGM/Delmas), Chukwudi
Nnanna (Bollore), and Matthew Ogieva (APMT) for giving me attention and time.
Finally, I would like to express my gratitude to my family, especially my caring,
loving, and supportive wife: Blessing Onyemejor for encouragement, great comfort
Abstract
Title of Dissertation: Relationship Between Logistics Performance and International Trade Competitiveness: A case study of Nigeria in Central West African cluster of countries
Degree: M.Sc.
This dissertation examines the relationship between logistics performance and
international trade competitiveness. It aims to identify the challenges of logistics
performance in Nigeria and analyse their effects on international trade
competitiveness. The study also seeks to identify possible solutions for improving
logistics performance for better competitiveness in foreign trade. The study takes a
trend and comparative analysis approach to providing answers to the research
questions and analyses quantitative and qualitative data, balancing established
statistical data with expert opinions from a survey administered to 100 personnel
actively involved with logistics and trade. The outcome of the survey showed that
logistics performance in Nigeria is plagued by poor state and interconnectivity of
transport infrastructure; trade disabling policies; inadequate handling equipment; and
lack of trained and qualified logistics personnel, all of which have created port and
traffic congestion issues, with negative impacts on time, cost and ease of doing
business. Establishing a significant relationship between logistics performance and
competitiveness, the study revealed that new trade-enabling policies and transport
infrastructure with improved intermodal connectivity and link to hinterlands as well
as improved and adequate facilities and equipment needs to be developed to help the
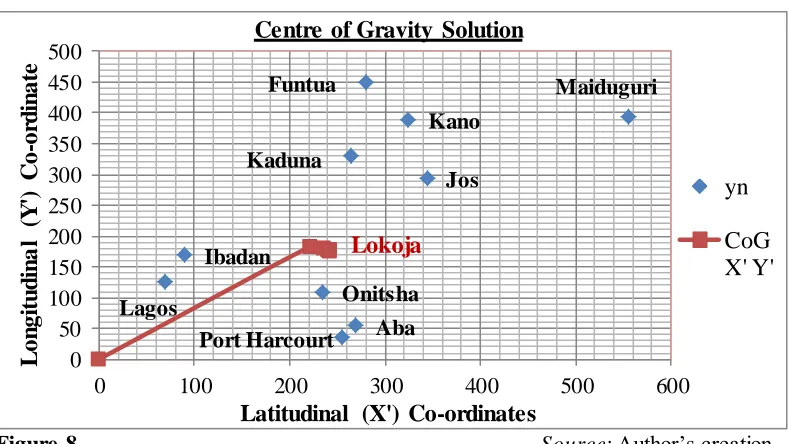
country improve its trade facilitation. Specifically, the study found and recommends
Lokoja to be the centre of gravity to site an alternative port in order to enhance
Nigeria’s international trade competitiveness. The study also found that improved
logistics performance will not only reduce inland travel time for cargo, lower
transport, inventory and trading costs, but will also yield direct gain from time and
cost saving, improve access to distant hinterland, improve productivity and local
production, and increase foreign direct investment The study concludes that logistics
determine international trade competitiveness to a large extent emphasizing that
Table of contents
Declaration ...i
Acknowledgements ... ii
Abstract ... iii
Table of contents ... iv
List of Figures ... 8
List of Abbreviations ... 10
1. INTRODUCTION ... 11
1.1 Background of Study... 11
1.2 Statement of Problem/Motivation ... 13
1.3 Aims and Objectives ... 13
1.4 Purpose of Study ... 14
1.5 Scope of Study ... 14
1.6 Research Questions ... 15
1.7 Literature Review ... 16
1.8 Methodology ... 20
1.8.1 Research Design... 21
1.8.2 Sampling Technique ... 21
1.8.3 Data Sources ... 22
1.8.4 Collation and Analysis ... 22
1.8.5 Ethical Issues and Limitations ... 23
1.9 Structure of the Study... 23
2 EXPLORATION OF THE PROBLEM (THE CHALLENGE) ... 25
2.1 Pitfalls of Logistics Performance in Nigeria ... 25
2.1.1 Poor State of Infrastructure ... 26
2.1.2 Poor Connectivity and Link to Economic Centres ... 29
2.1.3 High Cost and Complexity of Doing Business ... 31
2.1.4 Government Policies, Regulations and Restrictions ... 32
2.1.5 Insecurity: Militancy and Insurgence... 33
2.1.6 Inadequate Handling Equipment and Limited Use of Technology ... 34
2.1.7 Corruption Perception and Lack of System Consistency ... 34
2.1.8 Lack of Trained and Qualified Logistics Personnel ... 35
2.2 Logistics Performance Measures/Metrics ... 36
2.2.2 Analysis of Time, Cost and Complexity ... 37
3 DISCUSSION OF ALTERNATIVE SOLUTIONS... 42
3.1 Previous and on-going Improvements... 42
3.2 Analysis of Impacts of Previous Improvements on Trade ... 43
3.3 Analysis of Significance of Impact on Trade ... 46
3.4 Analysis of Alternative Solution ... 48
3.4.1 Infrastructure Development and Hinterland Connectivity ... 48
3.4.2 Current Situation of Existing Ports ... 49
3.4.3 Market Analysis for Port Infrastructure Location: A Gravity Solution51 3.4.4 Establishment of Dry Ports/Logistics Centre... 54
3.5 Costs-Benefit Analysis of Solution ... 55
4 ANALYSIS OF THE RESEARCH INSTRUMENT ... 57
4.1 Success of Research Instrument ... 57
4.2 Respondents’ Profiles... 57
4.3 Relationship between Trade Facilitation and Competitiveness ... 59
4.4 Time, Cost, Reliability and Complexity/Ease of Doing Business. ... 61
4.5 Major Sources of Delay of Import and Export Shipments... 65
4.6 Nigeria’s International Trade Competitiveness in Sub-Saharan Africa... 67
4.7 Challenges of Logistics Performance In Nigeria ... 69
4.7.1 Poor Quality Infrastructure ... 69
4.7.2 Government Regulations/Restrictions ... 69
4.7.3 Challenging Inland Transportation ... 70
4.7.4 Poor connectivity/link to Economic Centres ... 71
4.7.5 Limited use of technology... 71
4.7.6 High Cost of Doing Business... 72
4.7.7 Lack of Logistical Competence ... 73
4.8 Possible Solutions to Nigeria’s Logistics Performance Challenges... 73
4.8.1 Transport Infrastructure Development (port, road, rail) ... 73
4.8.2 Trade- friendly regulations/restrictions... 74
4.8.3 Technological Advancements (facilities and equipment) ... 75
4.8.4 Improved Connectivity/Linkage To Economic Centres ... 75
4.8.5 Discouragement of bureaucratic bottle-necks/red-tapism... 76
4.8.6 Discontinuation of irrelevant documentation steps ... 77
4.8.7 Ensuring that only relevant agencies operate in ports ... 77
4.9 Possible Impact of Solutions on Economic Growth and Development ... 78
4.10 Justifications for Solution... 83
5.1 Summary of Findings ... 90
5.2 Action Plan (Recommendations) ... 92
5.3 Conclusion... 96
5.4 Suggestions For Further Studies ... 97
Appendix A Letter of Introduction ... 104
Appendix B Research Instrument ... 105
Appendix C Activity Report For Export Shipment ... 108
Appendix D Activity Report For Import Shipments... 109
Appendix E Shipping Line Charges (SLC) ... 110
Appendix F Terminal Handling & Storage Charges ... 111
Appendix G Gravity Model Calculations (Iterations) ... 112
List of Tables
Table 1 Comparisons of procedures, time and cost of doing business ... 25
Table 2 Sub- indexes of some Global Competitive Index Pillars ... 26
Table 3 Import Deliveries Awaiting Return of Empty Containers (Dry) ... 30
Table 4 Import Deliveries Awaiting Return of Empty Containers (Reefer) ... 30
Table 5 Comparison of Indicators of Trading Across Borders ... 31
Table 6 Equipment availability in ports around the cluster ... 34
Table 7 Time and Cost for Export Shipments ... 37
Table 8 Time and Cost for Import Shipments ... 37
Table 9 Performance Indicators of Nigerian Ports (2000-2014) ... 38
Table 10 Laydays between stages of Export Shipments (2014/2015) ... 39
Table 11 Lay-days Between Stages of Import Shipments (2014/15) ... 40
Table 12 Cost Implications of Delays in Import Shipment ... 41
Table 13 Container traffic (TEUs) Before Concession (2000-2005)... 43
Table 14 Productivity and Service-Level Measure Indicators (Pre-Concession) ... 43
Table 15 Container Traffic (TEUs) After Concession (2006-2014)... 44
Table 16 Productivity and Service-Level Measure Indicators (Post-Concession) .... 44
Table 17 Container Traffic (TEUs) Comparison of Pre and Post Conc ession Eras .. 45
Table 18 Productivity and Service-Level Measure Indicators (Comparison) ... 45
Table 19 Observed frequencies of container Traffic ('000 TEUs) ... 46
Table 20 Expected frequencies of container traffic ('000 TEUs) ... 47
Table 21 Chi-Square Calculations ... 47
Table 22 Estimated Yard Capacity of Lagos Ports ... 49
Table 23 Longstay Discharge Import Container (Dry) ... 50
Table 24 Longstay Discharge Import Container (Reefer) ... 50
Table 25 Distance Matrix and Transportation Cost ... 51
Table 26 Location Characteristics of Target Markets... 53
Table 27 Location Calculation Results ... 53
Table 28 Distance, Time and Cost Saving By Alternative Solution... 56
Table 29 Overall Logistics Performance Index for selected countries ... 83
Table 30 GCI and LPI Overall for Nigeria and Benin ... 84
List of Figures
Figure 1Map extract showing selected countries in the cluster ... 15
Figure 2 Photo showing the state of the roads leading into and out of Lagos ports .. 28
Figure 3 Photo showing the nature of traffic on roads leading to the cargo destinations... 29
Figure 4 Chart for Sectoral Real GDP Growth ... 32
Figure 5 Incoterms used for trade in Nigeria between Q1 2012 and Q3 2013 ... 33
Figure 6 Map of Nigeria showing cities and transport-related infrastructure... 52
Figure 7 Map of Nigeria with grid- lines showing cities ... 52
Figure 8. Gravity Model Iterations Results... 54
Figure 9 Respondents’ Years of Experience... 58
Figure 10 Respondents’ Highest Educational Qualifications ... 58
Figure 11 Type of Respondents’ Company’s Business ... 59
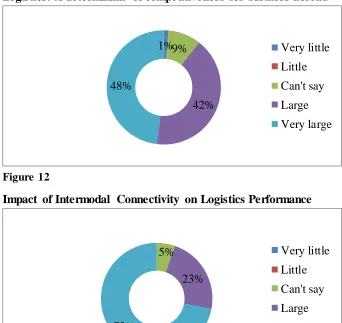
Figure 12 Logistics as a determinant of competitiveness for business abroad ... 60
Figure 13 Impact of Intermodal Connectivity on Logistics Performance ... 60
Figure 14 Impact of Improved Logistics Performance on Trade facilitation ... 60
Figure 15 Time Taken To Access Port For Pick-up/Drop-off And Exit ... 61
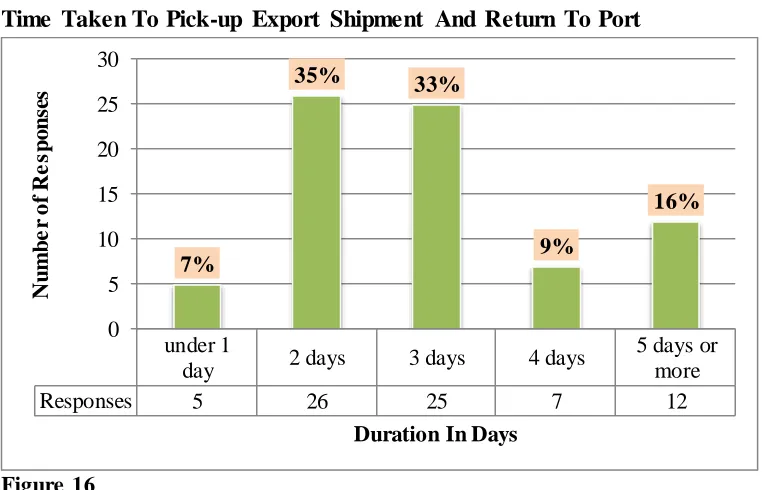
Figure 16 Time Taken To Pick-up Export Shipment And Return To Port... 62
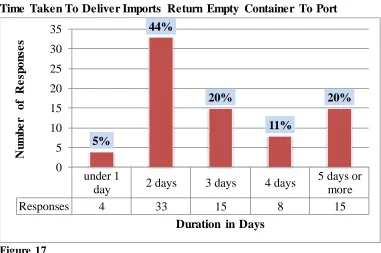
Figure 17 Time Taken To Deliver Imports Return Empty Container To Port ... 63
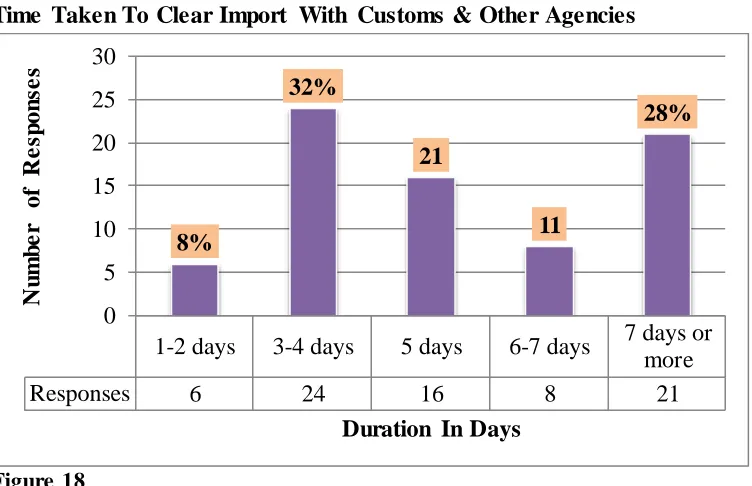
Figure 18 Time Taken To Clear Import With Customs & Other Agencies ... 64
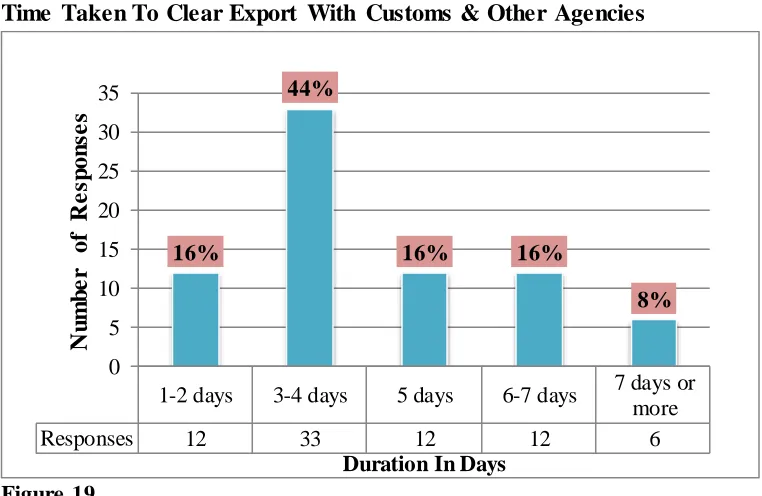
Figure 19 Time Taken To Clear Export With Customs & Other Agencies ... 65
Figure 20 Major Sources of Delay In Export Shipments... 66
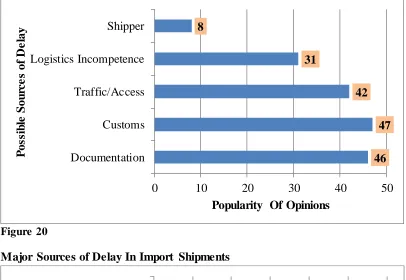
Figure 21 Major Sources of Delay In Import Shipments... 66
Figure 22 Necessity of all Agencies currently operating at the port... 67
Figure 23 Nigeria's Competitive Strength in FDI in Africa, Besides Population ... 68
Figure 24 Possible Threat Posed by Neighboring Countries (Benin, Ghana &Togo)68 Figure 25 Poor Quality Infrastructure As A Logistics Challenge ... 69
Figure 26 Government Regulations/Restrictions As Logistics Challenge ... 70
Figure 27 Challenging Inland Transportation As A Problem to Logistics ... 70
Figure 28 Poor Connectivity To Hinterland As Logistics Challenge to Logistics .... 71
Figure 29 Limited Use of Technology As A Logistics Challenge... 72
Figure 30 High Cost of Doing Business As A Logistics Challenge ... 72
Figure 31 Lack of Logistical Competence As A Logistics Challenge ... 73
Figure 32 Transport Infrastructure Development As A Solution ... 74
Figure 33 Trade- friendly Regulations/Restrictions As A Solution... 74
Figure 34 Technological Advancements As A Solution... 75
Figure 35 Improved Connectivity To Economic Centres As A Possible Solution .... 76
Figure 36 Discouragement of Bureaucratic Bottle-necks/Red-tapism ... 76
Figure 38 Opinions on Ensuring That Only Relevant Agencies Operate in Ports ... 78
Figure 39 Reduced Inland Travel Time For Cargo As A Possible Impact ... 79
Figure 40 Direct Gain From Time And Cost Saving As A Possible Impact ... 79
Figure 41 Increased Productivity & Stimulated Local Production As An Impact .... 80
Figure 42 Reduced Inventory-Related Costs As An Impact... 80
Figure 43 Improved Access To Distant Markets (Hinterlands) As An Impact ... 81
Figure 44 Lower Transport And Trading Costs As An Impact ... 81
Figure 45 Increased Foreign Direct Investment (FDI) ... 82
Figure 46 Accelerated Industrialization ... 82
Figure 47 Overall Logistics Performance Index for selected countries (2007-2014) 84 Figure 48 LPI and GCI Trend for Benin... 85
List of Abbreviations
AfDB African Development Bank
APMT APM Terminals
ATA/D Actual Time of Arrival/ Departure
CWA Central West Africa
DBI Doing Business Index
EDI Electronic Data Interchange
ETA/D Expected time of Arrival/ Departure
ETI Enabling Trade Index
FDI Foreign Direct Investment
GCI Global Competitiveness Index
GDP Gross Domestic Product
ICDs Inland Container Depo/ Inland Clearance Depo
IT Information Technology
LASTMA Lagos State Traffic Management Authority
LPI Logistics Performance Index
MIS Management Information System
NIMASA Nigerian Maritime Administration and Safety Agency
NPA Nigerian Ports Authority
OECD Organization for Economic Cooperation and Development
P & CHS Ports and Cargo Handling Services
SLC Shipping Line Charges
SMS Short Message Service
SWOT Strength, Weaknesses, Opportunities and Threats
TEUs Twenty-foot Equivalent Unit
TICT Tincan Island Container terminal
UNECE United Nations Economic Commission for Europe
WEF World Economic Forum
WTO World Trade Organization
CHAPER ONE
1. INTRODUCTION 1.1 Background of Study
The role of foreign trade in a country’s economic growth and development has
become increasingly important in recent times. This has informed widespread
development of policies, tactics or strategies by countries that desire to take the lead
in this competition in order to position thems to compete favourably in the
international scene. Huggins and Izushi (2012) confirmed this in their review of
Michael Porter’s “The Competitive Advantage of nation”, by suggesting that this
entails a competition strategy that gives a nation a competitive advantage.
According to Taner, Semra and Emin (2000), the emerging economies (within the
context of globalization) seem to be the ones that should take advantage or capture as
much as possible of the potential gains in expanding trade and investments. On the
other hand, Branch (1988) argues that international market is somewhat complex as
it crosses borders, each entity with its peculiar needs and environment. This,
therefore, points to the need for nations to analytically examine their competitiveness
to ascertain their comparative advantage which usually reflects on the nation’s ability
to facilitate trade. (Onyemejor, 2015).
The World Bank captures the measures of logistics performance by its six (6) key
dimensions of Logistics Performance Index (LPI) namely: customs, infrastructure,
international shipping, logistics competence, tracking and tracing and timeliness.
Individual impacts of the indicators jointly result in an overall index and serves as a
yardstick for measuring how individual countries and regions perform in terms of
trade facilitation. Therefore, individual countries deem it necessary to deliberately
Logistics effectiveness is an important success factor to be considered in the flow of
goods services as it touches on the cost, time and variability in trade-related
activities, which in turn determines the potential of a country to attract and retain
trade. This, as implied by Hausman, Lee, and Subramanian (2012), follows that the
time, cost and processes associated with transporting goods are important
determinants of volume of trade between trading partners. This also supports their
argument that the volume of trade between countries will naturally depend on the
attractiveness of the origin of the trade to the needs of the destination location.
Poor logistics performance can translate to lost gains and opportunities that occur
when essential materials fail to meet-up with their schedule in the manufacturer’s
supply chain. Another consequence may be increased inventory cost in form of
safety stock. Hausman, et al (2012) pointed that inefficiencies in logistics have been
highlighted as an important constraint for firm’s productivity and competitiveness in
developing countries, arguing that firms in countries with better investment climate,
including better logistics, have a higher probability of exporting to international
markets and attracting foreign direct investment.
Several researchers have attempted to establish relationship between logistics
performance and international trade competitiveness but many of them seem to lay
emphasis on selected aspects of the maritime supply chain. Some studies have based
this relationship on metrics from further analysis of the LPI or global competitive
index (GCI) while some others have depended solely on outcomes of survey, thereby
making conclusions based only on judgmental opinions with little or no statistical
background. Review of related literatures indicates that there is need to take a
wholistic approach to investigating the relationship between logistics performance
and international trade competitiveness of a country.
Therefore, this study does not seek to further analyze the LPI or the GCI, but
considers the causal relationship that exists between improvement in a country’s
trade facilitation efforts and its competitiveness, based on metrics of statistical data
Nigeria’s maritime logistics performance on its international competitiveness within
its immediate cluster in the Sub-Saharan African region in terms of foreign trade.
1.2 Statement of Problem/Motivation
According to Maritime Logistics and Trade Consulting (MLTC) (2013), Nigeria’s
current international trade is not commensurate with its population. For example,
container traffic for Nigeria is not up-to twice that of Ghana, whereas its population
is more than six times greater. This implies that Nigeria is yet maximize its economic
potentials in the regional economy of Sub-Saharan African, despite having
interesting economic indicators pointing to its greatness.
THISDAY’s Iwori (2012) and MLTC/CATRAM (2013) have argued that this situation further threatens Nigeria’s capacity to compete favourably for her deserved
share of international trade prospect into Africa as indicated by projected rise in of
container traffic to 2-3 million TEU by 2018 and 10 million TEU in 2040. These
claims are informed by the fact that Nigeria still struggles with many indicators of ,
trade facilitation, as evidenced by its low ranks in internationally published reports
relating to key drivers of international trade competitiveness
On the existing facilities, especially those relating to maritime logistics (ports, road
and rail), Nigeria barely manages to meet demand with challenging capacity reserve.
This has a weakening effect on Nigeria’s competitiveness in foreign trade and
demands that an informed enquiry be made in order to identify suitable response to
the challenges plaguing Nigeria’s logistics performance so as to boost its
international competitiveness and attract investors by improving the time, cost and
ease of doing business which is at the centre of logistics performance and trade
facilitation.
1.3 Aims and Objectives
This study seeks to examine the causal relationship between Nigeria’s maritime
logistics performance and her international trade competitiveness based on a balance
of measurable input and judgmental opinion. However, for the purposes of clarity
1. To establish the extent of relationship between trade facilitation and
international competitiveness using Logistics Performance Index (LPI) and
Global Competitiveness Index (GCI);
2. To identify and analyze possible impacts of Nigeria’s logistics performance
on its international trade competitiveness based on the causal relationship;
3. To measure the effect of specific logistics time, cost and reliability on
international trade competitiveness; and
4. To shed some light on the gaps in Nigeria’s logistics performance and
provide some recommendations for improving it for better competitiveness in
foreign trade.
1.4 Purpose of Study
The outcome of this study will enable Nigeria ascertain where it stands in terms of
international trade competitiveness among countries in Central Western Africa. It is
expected to reveal where the country ought to be and what developmental actions it
needs to take in order to take its deserved place as ‘giant’ of Africa. The outcome of
the study is expected to present the opportunities and threats so that Nigeria can
utilize its strength to suppressing its weakness, thereby becoming well-positioned to
compete favourably for trade and economic development in the region.
1.5 Scope of Study
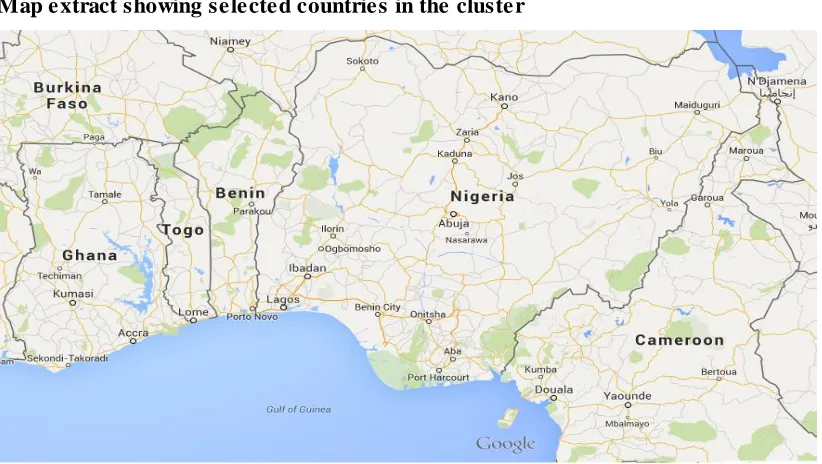
This study is restricted to Nigeria among neigbhouring countries within Central and
Western cluster in Sub-Saharan Africa. The basis for selection of the countries is that
they either inter-trade and/or compete for foreign trade involving maritime logistics
in its execution. The selected countries include Benin, Cameroun, Ghana and Togo
and the commodity focus in this study is limited to containerized cargo owing to its
role in development of globalization as argued by Institute of Chartered Shipbrokers
(2013) pointing that global economy would never have developed as far as it has
Map extract showing selected countries in the cluster
Figure 1 Source: cropped from map of the world
The study includes maritime logistics activities relating to ports (terminals, ICDs)
and their hinterland (inland transportation, intermodality, link to economic centres)
and excludes ocean freight time and cost. Essentially, the analysis will cover measure
of time and cost for logistics activities such as documentation, customs clearance,
inland transportation, reliability, as well as port productivity and service quality
indicators. This implies that the scope of this study is limited to containerized cargo
and the landside maritime logistics activities and all illustrations on trade volume or
costs are for 20-foot-equivalent- units (TEUs).
The geographical focus in this study is Lagos as its ports alone handle 90% of cargo
in and out of Nigeria. This follows that the measure of distance between Lagos and
other economic centres adopts the shortest possible distance from Lagos to such
locations. The time of travel also basis calculation on the speed limits approved by
the Federal Road Safety Commission of the Federal Republic of Nigeria, which
stipulates 50km or 60km for trailers for highway and expressway respectively.
1.6 Research Questions
In line with the stated problem and objectives, the study is generally expected to
1. What are the shortcomings of Nigeria’s logistics performance that limits
her international trade competitiveness among countries in Central West
African cluster?
2. How attractive or competitive are the time, cost and complexity metrics
of Nigeria’s logistics performance and trade facilitation?
3. What is the extent of relationship between Nigeria’s Logistics
Performance Index (LPI) and her Global Competitiveness Index (GCI)?
4. What logistics performance improvement actions could be taken by
Nigeria in order to attract and sustain foreign trade and investment that is
commensurate to her comparative advantage?
1.7 Literature Review
Stevenson (2009) defines logistics as movement of materials, services and
information in a supply chain. Many authors have defined logistics from different
perspectives but Puertas, Martí, & García (2013) acknowledges that all the
definitions recognize the fact that logistics integrates information, packaging, storage
and transport systems that fulfils demand in terms of time, quality, quantity and cost.
Supporting the argument by Hausman et al (2012) that logistics performance can
significantly impact the bilateral trade relations between trading nations, Puertas et al
(2013) added that logistics performance is crucial for competitiveness.
The WTO defines trade facilitation as the “simplification and harmonization of
international trade procedure (IISD, 2003), while the United Nations Economic
Commission for Europe (UNECE, 2002) considers it to include any efforts aimed at
ensuring that trade is conducted more timely, predictably, efficiently and
cost-effectively. According to Puertas et al (2013), all existing definitions of trade
facilitation focus on the quality of trade environment and its impact on trade
operations, attributing the ability of the Europe Union to compete with trade rivals, to
the common trade facilitation strategy adopted by the region.
On the issue of cost of doing business, Hausman et al argued that logistics
landed cost. In a similar discussion, Shuai and Sun (2006) considered logistics cost to
include monetary expression of all kinds in the course of product displacement,
which can reflect the actual condition of logistics activities using money. Agreeing
with Lean, Huang, and Hong (2014) on the significance of ratios of logistics cost and
value added by logistics industry on GDP, Shuai and Sun (2006) added that a stable
and efficient logistics network does not only affect cost but also promotes profits.
According to World Investment Report (2014), global investment trends show that
developing economies have maintained a lead, sighting Africa’s growth potential and
flow of foreign direct investment as an example. Further in this line of discussion,
the World Economic Situation and Prospects (2015) attributes the growth recorded
by Sub-Saharan Africa to investment in infrastructure among other factors. As a
matter of fact, Shuai and Sun (2006) agrees with many other researchers who believe
that development of the logistics industry will drive other industries and the entire
economy.
Among the major risks posed to the Sub-Saharan African supply chain, Agility
Emerging Market Logistics Index (2015) suggest that poor infrastructure result in
lack of physical connectedness, increased transport cost and negatively impacts a
country’s overall trade development. According to Millar (2014), Africa’s transport
infrastructure lags well behind that of the rest of the world and doing business in
Sub-Saharan Africa has remained challenging due largely to weak transport
infrastructure. This situation has greatly impeded logistics services, thereby driving
cost of doing business even higher. (Onyemejor, 2015)
Reviewing the works of previous authors, Lean, Huang, and Hong (2014) identified
the pitfalls of logistics to include undeveloped and aged infrastructure, government
regulations and other regulatory restrictions, use of archaic handling equipment, lack
of qualified logistics personnel to meet vibrant need in the economy as well as local
protectionism that restrains efficient distribution. Hausman et al (2012) argued that
usually translate to delays in movement, customs, and ports, all having cost
implications.
Acknowledging the seriousness of infrastructure deficit in Africa, Raballand, Beuran,
& Isik (2012) puts the shortfall at about $48 billion per annum, pointing that the
shortcomings impede competitiveness and economic growth in the region.
Confirming the empirical findings by Hummels & Schaur (2012), demonstrating how
longer travel time negatively impacts trade, Raballand et al. (2012), further stressed
that infrastructure gaps and high transport cost hinders growth and poverty reduction
in Sun-Saharan Africa.
Further in the discussion on impacts of delay on trade, Hummels & Schaur (2012)
argued that a day in transit is ad valorem tariff of 0.6-2.3%. Investigating further,
Hausman, Lee, & Subramanian (2012) found by calculation, that a 1% reduction
each in the distance and processing time measures would be associated with an
increase of 1.39% and 0.373% respectively, in bilateral trade, and that a 1%
reduction each in the total costs related to trade and in variability, would translate to
an increase of 0.49% and 0.24% respectively, in bilateral trade.
A similar analysis by OECD’s Ojala and Sertrans Logistics (2014) shows that a 1%
cost reduction could increase world income by USD 40 billion and that exports
potentially benefit at least as much as imports. This suggests that the efficiency of
transport systems and industry profitability are closely related. The comparative efficiency of a country’s logistics chain has a vital importance in attracting foreign
investment and enhancing industrial competitiveness. Empirical studies show that
trade and/or foreign direct investment flows more in the direction of a robust and
efficient transportation systems. (Onyemejor, 2015)
Regarding dwell time, Raballand et al. (2012) notes that ports in Sub-Saharan Africa
averages more than two weeks, adding that it does not only affect efficiency but also
worsen congestion situation with its cost implication on the economy. Reporting that
there is a proven link between the storage rate level and the dwell time of cargo as
well as port congestion, suggesting that cheap storage might be an incentive for long
dwell time. Raballand et al. (2012) also noted that the impact of dwell time on trade
has in recent times been seen as a major hindrance to the development of low-income
countries.
The Global Enabling Trade Report (2014) suggested that improving key components
can result in an increase of up to 4.7% in GDP and 14.5% in global trade
respectively. This supports the argument by Arvis et al (2014) that better logistics
spur growth, competitiveness and investment. Agility Emerging Market Logistics
Index (2015) also agree with this argument by attributing Columbia’s market size,
attractiveness and connectedness to her on-going $25Billion massive expenditure in
transport-related infrastructure.
Zhu (2006) and Shuai and Sun (2006) both agree that without effective support of a
logistical system, competitiveness will greatly be affected as service efficiency and
cost of logistics systems, to a large extent, determine the growth while greatly
affecting attainment and sustenance of a competitive strength. This competitiveness
usually implies strong advantage based on enterprise, resources, and infrastructure,
whereby supply to place of demand is made to meet customer need at most
economical expenses characterized by reduced trade and production costs.
Managing maritime logistics performances of time, cost and reliability adequately,
requires that same be arranged under maritime logistics and supply chain (Hausman
et al, 2012) and Song and Panayides (2012) points that such represents a
convergence of shipping and ports and necessitating integration of efforts
Christopher (2005) also noted that recognition of the impact logistics have helped
organizations achieve competitive advantage accruable from the various ways it
increases efficiency and productivity , adding that it contributes significantly to cost
A great deal of research has been conducted in subjects relating to trade and
international competitiveness but the majority seems to focus only on either
infrastructure or trade development factors. Some others dwell on competitive
advantage of nations with emphasis on products and pricing mix of marketing with
insufficient attention to place utility which can impact the former. Another
significant group either focuses on either performance or process of competition
neglecting the process of managing and sustaining competitiveness.
For example, Puertas, Martí, and García (2013) seemed to focus only on World
Bank’s LPI. On the other hand, Hausman, Lee, and Subramanian (2012) exhaustively
discussed the impacts of trade-related transactions (time, cost and variability in time)
on trade drawing on data set developed by the World Bank. However, their analysis
was heavy on quantitative metrics but did not capture judgmental opinion. Lean,
Huang, and Hong (2014) came close to a comprehensive approach to examining the
relationship between logistics development and economic growth but focused mainly
on the role of infrastructure.
This study will attempt to bridge these gaps by linking the identified challenges to
the opportunities that can enhance international trade competitiveness through
improved logistics performance which has not only become the key of raising
enterprise competitiveness, but it has also become the competitive advantage with
which to scramble for world markets.
1.8 Methodology
This study, as the title suggests, examines causal relationship between logistics
performance and competitiveness in foreign trade, which entails trend and
comparative analysis of quantitative and qualitative data. This section presents the
methods (approaches) used in providing answers to the research questions and it
includes: design of the research; the sampling technique; and sources of data; and
data collation and analysis. It will also include some ethical issues considered during
1.8.1 Research Design
This study adopts quantitative and qualitative methods of analysis. It is also inductive
in style as analysis is drawn largely from already established data sources balanced
by judgmental opinions from survey.
1.8.2 Sampling Technique
Based on the fact that the study will rely largely on existing data, it uses as many
samples as are available on the chosen sources. A survey instrument on the other
hand, was administered to 100 practitioners and stakeholders selected non-randomly
and framed to a heterogeneous list from shipping companies, terminal operators,
logistics and supply chain managers, freight forwarders, manufacturers/shippers and
regulators. Great care was applied in designing the survey instrument to ensure
consistency of responses. A pilot distribution was done to capture major corrections
and discrepancies before the actual distribution to respondents.
The questionnaire was backed by emails, calls, SMS and video chats on social
network (skype, WhatsApp and Viber) as a means of follow-up and support for the
respondents. It is important to state here that a few short interviews were conducted
in the course of the follow-up.
Selection of Company: The firms selected are multi-nationals either domestically registered or operating in Nigeria, that is owned fully or partly or have notable
dealings of foreign concern. The firms were also selected on the basis that they trade
(import and/or export) using sea transport (or maritime logistics) and that at least
10% of their activities are export transactions.
Selection of Traded Goods: The study restricted the goods traded to imported raw materials and exported finished or semi-finished goods. This was done in the belief
that such trade will naturally feel the impact of logistics performance and its related
costs as they are conducted under pressure to create and/or add value. More
importantly, the study focuses on cargo of significant value that can be transported in
Selection of Activities/Procedures/Process: Based on the aims and objective of the study, the activities, procedures and processes selected are those for which time and
cost can be measured in relation to importation of raw materials and exportation of
semi-finished and finished goods. These include those of port/terminal, regulatory
bodies, customs, shipping companies, Third-party logistics and transporters.
1.8.3 Data Sources
The data used in this study were drawn from secondary sources balanced by expert
opinion from administered questionnaires. The secondary sources consist of
published periodic reports as well as unpublished activity reports and operational
records of major players. The main sources of data include the following:
a. Logistics Performance Index by published by World Bank
b. Global Competitiveness Index published by World Economic Forum
(WEF)
c. Global Enabling Trade Index (published by World Economic Forum
(WEF)
d. Doing Business Index published by the World Bank
e. Operational data from logistics provider, carriers, and terminal operators
in Nigeria.
All extracted data focus on key elements, ensuring that only essential information is
presented. Sequel to this, all tables and charts are either adopted from reports or
created from activity reports and operational records for purposes of analysis.
1.8.4 Collation and Analysis
Due to the comprehensive approach the study takes, different quantitative and
qualitative methods of analysis are used depending on what method(s) suits the
aspect of the study being analyzed. The general list of the methods used is as
follows:
a. Qualitative analysis:
ii. Survey Analysis: From questionnaire responses populated in the
Google Form used for the survey.
b. Quantitative analysis:
i. Gravity Model, Descriptive Statistics, Trend Analysis,
ii. Performance Indicators (output and service), and Comparative
Analysis
1.8.5 Ethical Issues and Limitations
The market-sensitive data used in this analysis are either estimated or indexed in
respecting the source’s confidentiality. To guide against suppression and/or
misrepresentation, the sensitive data are indexed. Though the research is done with
assistance from staff of some of the companies, no part of the work or its outcome
projects any organization’s agenda. Efforts were made to ensure that the work is
completed within its relevance, at optimal cost and yielding maximum impact.
1.9 Structure of the Study
The research is organized into five (5) chapters each focusing on different aspects of
the study.
Chapter One introduces the study by beginning with the background to the study.
The chapter states the problem being investigated as well as the purpose and
objectives of the study. It also defines the scope of the study, reviews relevant related
literature and specifies the method and structure of the study.
Chapter Two explores the problems which entails the identification and discussion of
the challenges of logistics performance in Nigeria among selected countries in the
Central West African (CWA) cluster. This chapter also analyzes and discusses the
time, cost and complexity factors of logistics and trade facilitation in Nigeria.
Chapter Three discusses alternative solutions to the problem/challenges identified
and discussed in Chapter Two, beginning with an overview of previous
The chapter also presents a trade-off between cost and benefits of the alternative
solutions.
Chapter Four focuses on the analysis of the research instrument in line with the
objectives of the study. It also covers the justification for the solutions, establishment
of relationship between logistics performance and competitiveness as well as SWOT
(strengths, weaknesses, opportunities and threats) analysis of the selected countries,
with a focus on Nigeria.
Chapter Five wraps-up the study by presenting a summary of the findings, proposing
recommendations and making a conclusion. The chapter also includes some
CHAPTER TWO
2 EXPLORATION OF THE PROBLEM (THE CHALLENGE)
Nigeria’s GDP recently surpassed that of South Africa to become the largest
economy in Africa. This became possible by achieving an estimated rebased GDP of
about $650 billion representing over 6% annual growth on average, stemming from a
decade-long sustained and improving result. With Nigeria’s large (and fast growing)
population (up to 170 million people) made-up mainly of active workforce coupled
with a relatively stable democracy, one may be tempted to argue that Nigeria is
moving in the right direction. As a matter of fact, PWC (2015) projects Nigeria to
have the highest average annual real GDP growth in the world between 2014 and
2050. However, considering the many barriers to maximizing these potentials, these
statistics appear somewhat like an irony as Adeyemo (2015) describes them as
opportunities in challenges.
2.1 Pitfalls of Logistics Performance in Nigeria
Despite the fact that Nigeria offers the largest market (having approximately 70% of
the region’s population) in Africa, she is yet to occupy her deserved prime place as a
gateway to the region. This situation is attributed to several tariff and non-tariff
barriers that negatively impacts time, cost and complexity of economic activities in
Nigeria as reflected in Table 1
Table 1 Comparisons of procedures, time and cost of doing business
Indicator Lagos Sub-Saharan Africa OECD
Procedures (number) 8 7.8 4.8
Time (days) 28 27.9 9.2
Cost (% of income per capita) 31.1 56.2 3.4
These problems/challenges have made doing business in Nigeria quite difficult and
they may include: poor state of infrastructure; poor connectivity to economic centres;
insecurity and militancy; high cost of doing business; limited use of technology; lack
of trained and qualified logistics personnel; corruption, government
regulation/restrictions; to mention but a few.
2.1.1 Poor State of Infrastructure
Generally, Nigeria has had more than a fair share of dearth of basic infrastructure for
quite a long time. The summary of sub-indexes of some Global Competitiveness
Index Pillars shown in Table 2 indicates an infrastructural deficiency when compared with Cameroon for example, which is one of countries in the cluster. This
has limited the logistics industry and the resultant effects have negatively impacted
specific and overall logistics performance.
Table 2 Sub-indexes of some Global Competitive Index Pillars
Pillars Aspects Cameroun Nigeria
Infrastructure
Road 2.9 2.7
Rail 2.8 1.5
Port 3.6 3.2
Market Efficiency Prevalence of Trade Barrier 3.9 4.6
Business Sophistication
Comparative Advantage 3.2 2.8
Value Chain Breadth 4.8 3.6
Source: Author (extracted from Global Competitive Index 2014)
Table 2 reveals Nigeria’s weakness in terms of transport-related infrastructure. This worsens the state of barriers to trade, thereby narrowing the breadth of the country’s
value chain and limits her potentials in the cluster. It is noteworthy to state here that
low power generation which has driven many manufacturers out of Nigeria is also a
major concern. However, for this purpose of this study, the discussion on
infrastructures in this study would refer to those related directly to maritime logistics
(a) The State of Nigerian Ports
In recent times, Nigerian ports have gone through series of reforms which have
necessitated significant review of their operations. Though the resulting concessions
have eliminated some of the pre-reform issues and attracted funds for investments in
both infrastructure and superstructures, there still exist some challenges that have
negatively impacted their performance. These challenges may include (but not
limited to) port congestion, traffic congestion, and customs delay. The cluster of
industries and other commercial activities around the port leave it with little or no
room for expansion to accommodate the ever growing trade into and out of the
country. Poor condition of roads leading to the port as well as lack of adequate
operational capacity by operators and customs to execute their functions makes the
port even more problematic.
Onyemejor (2015) had noted that maritime analysts argue that the port of Cotonou in
Benin Republic has the potential to not only become the gateway to landlocked
countries in West Africa but may emerge as one of the alternative and potential port
of call for the shipping fraternity in the West African maritime trade lane. This
comes in the wake of the increased vessels’ dwell time caused by ever increasing congestion in Nigeria’s main ports of Apapa and Tincan. More threatening is the fact
that Benin is currently investing massively to further improve their physical
connectedness.
The former Managing Director (Mallam Abdul Salam Mohammed) of the Nigerian
Port Authority (NPA) in a press release, identified the reasons for port congestion to
include: structural deficiency with the system; lack of permanent solution to
problems; ad-hoc nature of past port development plan; non-compliance to import
guidelines by consignees; presence of multi agencies in the clearing process;
cumbersome clearing procedures; lack of efficient electronic networking between
agencies and organisations involved in clearing process; and challenges of delivering
(b)Road and Rail Modes of Transportation
Like the ports, Nigeria’s network of roads and bridges are publicly owned and quite
developed but their conditions remain a major concern for her economic
development. Only about 15,000 kilometers of the existing 80,500 kilometers are
known to be paved but many of them are in bad condition. Table 2 shows that
Nigeria ranks low in road and rail related transport infrastructures.
Photo showing the state of the roads leading into and out of Lagos ports
Figure 2 Source: Adeyemo (2015)
The image in Figure 2 shows the deplorable state of the road into and out of port in Lagos and this seem to be the case with many roads across the country. Putting it
mildly, an editorial of THISDAY Newspaper (2015) wrote that it is a serious
embarrassment, adding that the situation hampers economic activities as farm
produce and other products cannot be transported to their places of need. THISDAY
went further to note that journeys that should take only a few hours end up in days of
horrible experience and can even become impassable during rainy seasons.
The rail system has a similar story as shown in Figure 2. The network is obsolete,
poorly maintained and grossly underutilized due to years of neglect of the rolling
stock and rail track. Despite the fact that the country has great need for rail service,
the performance deficiency and poor service has made rail service unattractive
the 3,500-plus km of track Nigeria had in 1960 has shrunk to almost nothing except
for some minor refurbishment in recent times.
Several researchers have blamed the situation on the fact that the rail system was
initially designed to serve the purposes of the colonialists. On the other hand, critics
have argued that the rail system has remained unchanged and neglected (until recent
times) for over 50 years after independence, insisting that the country needs to
acknowledge this challenge and proffer solutions to remedy the situation so as to
bring about efficiency and profitability in the rail system.
Photo showing the nature of traffic on roads leading to the cargo destinations
Figure 3 Source: Author
As if the poor state of road and rail networks were not challenging enough, the fact
that the nation’s rail are not utilized mounts even more pressure of the already bad
roads with a resultant cost implication for business. This explains the traffic situation
on the Lagos-Ore-Benin highway which leaves little or nothing to be desired.
2.1.2 Poor Connectivity and Link to Economic Centres
Almost all of Nigerian ports (Apapa, Tincan, Port Harcourt, Onne, Warri and
Calabar) are located along the same coastline, mostly in the southern part.
Onyemejor (2015) argued that this geographical structure, coupled with the poor
hinterland difficult and further threatens the development of trade in Nigeria. From a
competition view-point, this makes the neighbouring countries such Benin and
Cameroon whose transport infrastructure statistics and maritime potential, combine
to enable them pose a competitive threat which THISDAY (2014) puts at a revenue
loss of $2.5 billion for Nigeria. This challenge reflects on the cost incurred as 100%
of delivered containers still await return of empty containers after 8 days of exit from
port as shown on Table 3 and Table 4.
Table 3 Import Deliveries Awaiting Return of Empty Containers (Dry) Duration
(Days)
Port/Terminal
(TEUs) Total (TEUs & %) Cost ($)
Apapa Tincan TEUs % Detention Inland/day
0-7 0 0 0 0% 0.00 0
8-14 1013 646 1659 63% 38986.50 165900
15 onwards 652 330 982 37% 28969.00 98200 Total 1665 976 2641 100% 67,955.50 264,100
Source: Carrier’s Weekly Longstay Report (Week 37, 2015)
Table 4 Import Deliveries Awaiting Return of Empty Containers (Reefer) Duration
(Days)
Port/Terminal
(TEUs) Total (TEUs & %) Cost ($)
Apapa Tincan TEUs % Detention Inland/day
0-5 0 0 0 0% 0 0
6-10 36 0 36 62% 4752 3600
11 onwards 14 8 22 38% 2904 2200
Total 50 8 58 100% 7,656 5,800
Source: Carrier’s Weekly Longstay Report (Week 37, 2015)
In addition to revenue loss, poor connectivity/link to economic centres limits inland
transportation solutions. This makes barriers to trade more prevalent, thereby
lessoning the competitive advantage Nigeria deserves among countries in the cluster
and narrows the width of the value added. This creates an inability on the part of
Nigeria to move products and services at reasonable or competitive prices. The
Economist (2015) considers this lack of decent transport links to be pervasive as the
northern part of the country, which has a great potential, has stopped producing as
2.1.3 High Cost and Complexity of Doing Business
The state of infrastructure discussed so far as well as its effects all join to make doing
business in Nigeria both complex and costly. The Doing Business Index (2015),
shows that Nigeria ranks very low in terms of getting electricity and trading across
borders. Though it is not the focus of this study, the difficulty in getting electricity is
quite a serious issue as it has driven some manufacturing companies out of Nigeria to
nearby Ghana. This happens due to the fact that power supply is erratic thereby
requiring industries to rely on electricity generators, which add up to the cost of
production. The cost elements presented on Tables 3 and 4 are also pointers to the high cost of doing business in Nigeria.
Table 5 Comparison of Indicators of Trading Across Borders
INDICATOR Lagos
Sub-Saharan
Africa OECD
Documents to export (number) 9 8 4
Time to export (days) 22 30.5 10.5
Cost to export (US$ per container) 1,380.00 2,200.70 1,080.30
Cost to export (deflated US$ per
container) 1,380.00 2,200.70 1,080.30
Documents to import (number) 13 9 4
Time to import (days) 33 37.6 9.6
Cost to import (US$ per container) 1,695.00 2,930.90 1,100.40
Cost to import (deflated US$ per
container) 1,695.00 2,930.90 1,100.40
Source: Doing Business Index (2015)
On the other hand, the low rank for trading across border reflects the ordeal faced in
serving the neighbouring landlocked countries through Nigerian borders. The high
transportation cost resulting from the poor quality infrastructure and its connectivity
will normally translate to high labour and production cost, whether or not goods are
manufactured locally. Other consequences may include high travel cost and loss of
man-hours as workers have to travel for hours to get to work resulting in lost
productivity gains. All of these explain why the contributions of Agriculture,
Manufacturing and Trade to the nation’s economy are on the lower range as shown
Chart for Sectoral Real GDP Growth
Figure 4 Source: Economic report on Nigeria (2013)
2.1.4 Government Policies, Regulations and Restrictions
Contrary to the argument by Donner (2004) that what international trade needs are
rules which facilitate trade and door-to-door transportation, there still exist in
Nigeria, some policy framework that are not suitable for facilitating international
trade, hence, its competitiveness is threatened as some trades (and traders) avoid
Nigeria’s excessive restrictions. A typical example is the government’s
implementation of 100% destination inspection of all goods bound to Nigeria, which
has resulted in long delays in clearing goods, thereby opening more doors to corrupt
practices, since the ports and customs lack adequate facilities to perform the
inspection.
Also in this regard are cumbersome documentation requirements, which negatively
impact performance for trade, transport and logistics. As if these are not challenging
enough, there also exist multiple agencies operating within the port (many of which
have no business to be there) and collecting different kind of charges all in the name
of ‘regulation’. In addition to the extra financial burden this situation creates, it
implies that exporters, importers and carriers have to submit several forms and
declarations, which takes more time and attracts more unjustifiable costs. 5%
12% -1%
8%
24%
8% 16% 11%
9% 6%
Sectoral Real GDP Growth (%)
AGRICULTURE
SOLID MINERALS
CRUDE PET
MANUFACTURING
TELECOM/POST
WHOLESALE & RETAIL
HOTEL+TOURISM
REAL ESTATE
BUSINESS/COMMERCE
Another example of such policies that are unfriendly to trade and economic
development is the rule by Nigerian Customs Service which disallows imported
cargo from being exported. This rule does not state the nature of the re-export as to
whether processed or unprocessed. This excludes Nigeria the potential of serving as
connecting link to neighbouring landlocked countries like Niger and Chad. A short
interview with one of the respondents to the research instrument revealed how a
leading logistics service provider in Nigeria had to go through Cameroun after
having spent more than 6 months in the process of moving a humanitarian cargo
through Nigeria to Chad.
Incoterms used for trade in Nigeria between Q1 2012 and Q3 2013
Figure 5 Source: Economic report on Nigeria (2013)
The loss of value rather than value-addition caused by anti-trade policies can only be
left to imagination. However, it is important to state here that these policies might be
the reason why the Export Processing Zones are not operating to their full potentials.
Some critics have also argued that the loss of value-adding opportunities may be
attributed to the commercial terms that as shown in Figure 5.
2.1.5 Insecurity: Militancy and Insurgence
The threat to life and property poses a major logistical challenge in Nigeria,
especially pockets of ethnic and religious crisis/unrest in the Northern region as well
as militancy and commercial kidnapping happening in the south. According to AfDB
(2013), the country is experiencing slowdown in portfolio and FDI inflows based on
investor expectations and risk perception of existing and potential investors. This 0
10000 20000 30000 40000 50000
V
al
u
e
of
T
rad
e
(
$
m
il
li
on
)
Periods (in quarters)
Import CIF
Export FOB
situation denies Nigeria her prime place as the choice investment destination in
Africa. Even when investors want to consider coming, they are discouraged by the
additional costs to cover for private security and insurance. This has greatly affected
bilateral trading.
2.1.6 Inadequate Handling Equipment and Limited Use of Technology
According to BIMCO (n.d.), many ships today, such as large containerships or bulk
carriers, rely entirely on shore-side cargo handling equipment to load and discharge
their cargo and some others are even equipped with systems that enable
self-sufficiency. Therefore, use of basic technology or lack of adequate equipment in
performing logistical functions becomes a limiting factor. Table 6 shows that Nigeria lacks adequate modern handling equipment to compete favourably among
other ports in the cluster.
Table 6 Equipment availability in ports around the cluster
Equipment Tema Lome Cotonou Apapa Tincan Douala
STS Gantry Cranes 3 0 4 1 0 2
Mobile Cranes 3 6 4 9 5 9
Reach Stackers >10 20 15 31 11 14
RTG Cranes 4 0 10 12 10 0
Capacity (TEUs) 500,000 350,000 220,000 850,000 450,000 500,000
Source: Extracted from MLTC/CAMTRAM Final Report (2013). Note: STS=Ship-To-Shore, RTG=Rubber Tired Gantry. Capacity is theoretical.
2.1.7 Corruption Perception and Lack of System Consistency
Though corruption is not a major consideration for this study (because it can only be
perceived but not quantified), its negative impact on logistics performance vis-à-vis
international trade competitiveness cannot be ignored. The Corruption Perception
Index (2014) scores Nigeria 27/100 (ranked 136/175), which places the country in
the top 25% of countries perceived to be corrupt. It is noteworthy to state here that
ranking is worse than those of other countries in the cluster such as Ghana, Benin,
Togo and Cameroun, who compete with Nigeria for trade into the region.
Many authors have pointed that corruption in Nigeria allows government officials to
into a gross abuse of delegated authority to deliberately delay processes, thereby
leaving their victims with a difficult choice between paying a bribe or incurring cost
due to delay. However, some players in the logistics industry have attributed this
situation to ignorance on the part of the victims and vague interpretation on the part
of authorities, which leave the people somewhat confused as to what is right or
wrong.
This situation adds to the total cost of doing business in Nigeria. For example,
clearing cargo with customs and other agencies operating within the ports in Nigeria
usually requires an un-receipted “processing fee” or “facilitation fee” estimated at
$60 for a 20-feet container and $75 for a 40-feet container. This generally
discourages investments into the country as it adds to the cost of doing business,
thereby confirming the argument by Transparency International (2014) that
corruption is threatening economic growth for all.
2.1.8 Lack of Trained and Qualified Logistics Personnel
The logistics industry in Nigeria generally lacks trained and qualified personnel to
meet the vibrant and ever growing demand of its economy. This situation results in
fundamental misunderstanding as to what logistics means and/or requires. This
translates to what the writer considers to be an “organized” incompetency, which
makes many logistics personnel perform logistical functions unprofessionally. The
writer believes that the root of this lack is the fact that no institution of learning
offers a structured programme in logistics, making it common to find personnel
having little or no idea of international trade, let alone the functions of a bill of
lading.
It is worthy of noting to state here that out of over 100 universities in Nigeria, only one offers a bachelor’s degree in Logistics Studies, which was started in the
2009/2010 academic session by an expensive private university. Oni and Okanlawon
(2010) show that only 12 tertiary institutions offer subjects in transport economics,