University of South Carolina
Scholar Commons
Theses and Dissertations
1-1-2013
Efficient Generation of Power In Medium Voltage
Direct Current Systems: Variable Speed Operation
and Rectifier Considerations
DAN LI
University of South Carolina - Columbia
Follow this and additional works at:https://scholarcommons.sc.edu/etd
Part of theElectrical and Computer Engineering Commons
Recommended Citation
LI, D.(2013).Efficient Generation of Power In Medium Voltage Direct Current Systems: Variable Speed Operation and Rectifier
E
FFICIENTG
ENERATION OFP
OWER INM
EDIUMV
OLTAGED
IRECTC
URRENTS
YSTEMS:
V
ARIABLES
PEEDO
PERATION ANDR
ECTIFIERC
ONSIDERATIONSby
Dan Li
Bachelor of Engineering Shanghai Maritime University, 2006
Master of Science
Mississippi State University, 2009
Submitted in Partial Fulfillment of the Requirements
For the Degree of Doctor of Philosophy in
Electrical Engineering
College of Engineering and Computing
University of South Carolina
2013
Accepted by:
Roger A. Dougal, Major Professor
Herbert L. Ginn III, Committee Member
Charles Brice, Committee Member
Jamil Khan, Committee Member
Abdelhamid Ouroua, Committee Member
D
EDICATIONTo my Lord Jesus Christ,
who gave me the opportunity to pursue Ph.D. in Electrical Engineering.
To my parents, Taishan Li and Shujin Wang,
who have never attended universities, but have always valued education.
To my siblings: Lydia, Grace, and Darris,
who have always taken accountability and shown your love to me.
To my brother in law, Hui and nephew Jeremy,
A
CKNOWLEDGEMENTSTo my advisor, Dr. Roger A. Dougal: You are a big thinker, who makes the best use of
every moment and opportunity! Thanks for encouraging me to think big, broadening my
mind, and being there for me whenever I need your guidance. As an engineer, a scientist,
and a professor, you are a person with strong ethics, and I thank you for passing these
values to me.
To my co-advisor, Dr. Herbert L Ginn III, what can I say? Thanks for your advisement
and challenging me to rethink my ideas since my master‟s program at Mississippi State
University in 2007. I appreciate your sending me to USC, and even continuously guiding
me through this Ph.D. program. To Mrs. Ginn, Sufang, thank you for always thinking
about me and making my whole stay in the United States more enjoyable.
To Dr. Abdelhamid Ouroua with the University of Texas at Austin, thanks for
countless discussions in spite of distance, which cleared many of my thoughts in the
process of this work. To Dr. Charles Brice and Dr. Jamil Khan, thank you for invaluable
feedback which helped me develop this work.
To Dr. Chuck Kwok and Mrs. Shirley Kwok, without your hospitality and support over
the years in Columbia, I would not have been able to finish this Ph.D.
Last and but not least, to my Lord Jesus Christ, You have blessed me with so many
A
BSTRACTBy investigating variable speed operation of an engine and different types of ac-dc
rectifier topologies, this dissertation provides procedures to develop and implement
efficient Medium Voltage Direct Current (MVDC) power systems. The research reported
here offered solutions to the following issues:
1) Efficiency improvement of a gas turbine by running it in variable speed
operation mode.
2) The advantages and disadvantages of different ac-dc rectifier topologies
considering both the efficiency and rectifier performance (dc bus voltage
regulation, weight/size/volume of passive components, number of
semi-conductor devices, displacement power factor, complexity of control strategy,
etc.)
3) Implementation of variable speed MVDC power system if variable speed
operation brings great advantages for fuel saving.
A semi-theoretical analysis was developed to address issue 1). This analysis revealed
the optimal efficiency and the corresponding optimal speed as a function of shaft load for
both single-shaft and twin-shaft gas turbines. These semi-theoretical results were
speed, for a generating plant to electrically propel a ship having powering characteristics
similar to those of a DDG-51.
A series of boost type rectifiers for applications in MVDC power systems were
compared to address issues 2). The comparison included only boost rectifiers since higher
distribution voltage leads to higher efficiency. The boost type rectifiers are diode rectifier
with boost chopper (diode rectifier), three-level diode clamped voltage source converter
(VSC), and modular multilevel converter (MMC). The comparison metrics include
complexity of control strategy, number of switching devices,
number/value/weight/volume of inductors and capacitors, the dc bus voltage performance
(peak-peak voltage ripple, overshoot, and settling time), the total harmonic distortion
(THD) of the ac side input current and voltage, displacement power factor (DPF), power
efficiency for different load conditions, and performance under variable ac frequency
operation. The comparison shows that MMC is the most efficient and provides the best dc
bus performance, by adding more capacitors (both number of capacitors and total weight),
and more complex control schemes into the system. VSC provides a relative high
efficiency and dc bus performance with less passive components, which indicates VSC is
a good choice considering both performance and cost.
A procedure to implement an integrated variable speed MVDC power system was
proposed to address issues 3). For each component of dc power generation chains, gas
turbine, synchronous generator, and ac-dc rectifier, their steady-state efficiencies and
system efficiency vs. dc load were analyzed. The relative system efficiency improvement
(an index of fuel reduction) can be up to 35% for 10% loading. The relative efficiency
procedure, a variable speed MVDC power system simulation model was developed. The
dynamic response shows that the system can track the speed command for different load
T
ABLE OFC
ONTENTSDEDICATION... ... iii
ACKNOWLEDGEMENTS ... iv
ABSTRACT... ... vi
LIST OF TABLES ... xi
LIST OF FIGURES ... xii
LIST OF SYMBOLS ... xv
CHAPTER 1INTRODUCTION ... 1
1.1CONTRIBUTIONS OF DISSERTATION ... 1
1.2MOTIVATION ... 3
1.3PROBLEM OF DESCRIPTION ... 6
1.4APPLIED SOLUTION ... 6
1.5STATE OF ART ... 8
CHAPTER 2FUEL EFFICIENCY OPTIMIZATION IN GAS TURBINE ... 11
2.1NOMENCLATURE ... 11
2.2PROBLEM STATEMENT AND SOLUTION APPROACH ... 12
2.3BACKGROUND/LITERATURE REVIEW ... 14
2.4SEMI-THEORETICAL ANALYSIS ... 16
2.5MODELING AND SIMULATION ... 22
2.6TEST ON GIVEN LOAD PROFILE ... 30
2.8DISCUSSION AND CHAPTER SUMMARY ... 34
CHAPTER 3COMPARISON OF POSSIBLE RECTIFIERS TOPOLOGIES IN MVDCPOWER SYSTEMS ... 35
3.1PROBLEM STATEMENT ... 35
3.2COMPARISON FACTORS ... 37
3.3RECTIFIER OF TOPOLOGIES AND PARAMETERS ... 38
3.4RESULSTS AND MERITS COMPARISON ... 43
3.5VARIABLE SPEED OPERATION ... 53
3.6MERITSCOMPARISON SUMMARY ... 54
3.7DISCUSSION AND CHAPTER SUMMARY ... 57
CHAPTER 4INTEGRATED MVDCPOWER SYSTEM IN VARIABLE SPEED OPERATION MODE ... 59
4.1PROBLEM DESCRIPTION AND BACKGROUND ... 59
4.2APPROACHES AND ANALYSIS RESULTS ... 63
4.3RESULTS ... 67
4.4TEST ON GIVEN LOAD PROFILE ... 71
4.5DISCUSSION AND CHAPTER SUMMARY ... 73
CHAPTER 5CONCLUSION AND FUTURE WORK ... 75
5.1CONCLUSION ... 75
5.2FUTURE WORK ... 76
REFERENCES.... ... 77
L
IST OFT
ABLESTable 2.1 Nomenclature of Chapter 2 ... 11
Table 2.2 Example of 1- day fuel consumption for constant and variable speed operation of gas turbine ... 32
Table 3.1 Recommended MVDC voltage classes in ship system [46] ... 36
Table 3.2 Data of test system ... 38
Table 3.3 Recommended requirements of voltage variations for dc system [47] ... 39
Table 3.4 Number of semi-conductor devices in rectifiers ... 43
Table 3.5 Filters components comparison ... 44
Table 3.6 DC bus voltage performance ... 51
Table 3.7 THD of phase voltage and current ... 52
Table 3.8 Merits comparison summary ... 55
Table 4.1 Data of test system ... 64
L
IST OFF
IGURESFigure 1.1 Compared merits of ac-dc rectifiers ... 2
Figure 1.2 Power flow train of dc system ... 6
Figure 1.3 impact of GT efficiency on dc system efficiency ... 7
Figure 1.4 Possible applications of variable speed operation of gas turbine ... 10
Figure 2.1 Typical SFC vs. output shaft power for a simple-cycle GT ... 13
Figure 2.2 Diagram of a single-shaft GT ... 14
Figure 2.3 Diagram of a twin-shaft GT ... 15
Figure 2.4 flow chart of the approach to solve GT governing equations ... 20
Figure 2.5 Semi-theoretical analysis of VSO on single-shaft GT efficiency ... 21
Figure 2.6 Semi-theoretical results of the impact of VSO on twin-shaft GT efficiency .. 22
Figure 2.7 Single-shaft gas turbine as modeled in GasTurb ... 23
Figure 2.8 Impact of VSO on single-shaft GT efficiency (semi-theoretical and simulation) ... 24
Figure 2.9 Relative efficiency improvement of single-shaft gas turbine at variable speed ... 25
Figure 2.10 Compressor operating at speed N= 0.83 p.u. in single-shaft gas turbine speed ... 26
Figure 2.11 Turbine operating at speed N=0.83 p.u. in single-shaft gas turbine ... 27
Figure 2.12 Compressor part load efficiency at fixed speed and variable speeds. ... 28
Figure 2.13 Impact of variable speed operation of twin-shaft gas turbine efficiency ... 29
Figure 2.17 Torque characteristics of single-shaft GT ... 33
Figure 2.18 Torque characteristics of gas generator for a twin-shaft gas turbine ... 34
Figure 3.1 Diode rectifier with single-switch boost chopper ... 40
Figure 3.2 Diode rectifier with boost chopper control structure ... 40
Figure 3.3 Three-level diode clamped VSC with LCL filter ... 41
Figure 3.4 Control structure of three-level diode clamped VSC ... 41
Figure 3.5 MMC ... 42
Figure 3.6 Control structure of MMC ... 43
Figure 3.7 Typical Vce and Ic characteristic of IGBT [58] ... 46
Figure 3.8 Typical Vf and If characteristic of diode [58] ... 47
Figure 3.9 Curve fitting of Vce as a function of Ic ... 47
Figure 3.10 Curve fitting of Vf as a function of If... 48
Figure 3.11 Efficiency of rectifiers at fixed speed ... 49
Figure 3.12 Waveforms of dc bus voltage ... 51
Figure 3.13 DPF of rectifiers ... 52
Figure 3.14 Phase current of diode rectifier in fixed frequency operation and variable speed operation ... 53
Figure 3.15 Efficiency of diode rectifier, VSC, and MMC in fixed frequency operation and variable speed operation ... 54
Figure 3.16 Total inductor volume comparison ... 56
Figure 3.17 Total capacitor weight comparison ... 57
Figure 4.1 Diagram of a MVDC power system ... 60
Figure 4.2 Power flow chart of synchronous generator ... 62
Figure 4.3 Typical efficiency curve of a synchronous generator at fixed speed ... 62
Figure 4.4 Efficiency of synchronous generator vs. electric load at different speeds ... 63
Figure 4.6 Flow chart of obtaining generator efficiency at any load and speed based on a
series of efficiency curves. ... 65
Figure 4.7 Efficiency of rectifiers vs. dc load. ... 66
Figure 4.8 Flow chart of obtaining optimal speed reference of MVDC Power System. .. 67
Figure 4.9 Efficiencies and optimal speed at integrated variable speed MVDC power system ... 68
Figure 4.10 Relative efficiency improvement of dc system vs. dc load in VSO mode .... 69
Figure 4.11 Optimal speed of variable speed MVDC Power System... 69
Figure 4.12 Phase-a voltage of generator ... 70
Figure 4.13 Phase-a current of generator ... 70
Figure 4.14 DC bus voltage ... 71
Figure 4.15 Typical propulsion speed profile of DDG-51 [13] ... 72
L
IST OFS
YMBOLSmass flow rate (kg/s).
enthalpy (J/kg)
inlet temperature (K)
outlet temperature (K)
torque (Nm)
speed (RPM)
ω speed (rad/s)
relative speed to design speed in map
beta-auxiliary coordinate useful for representing table format of maps
pressure (Pa)
pressure loss percentage
pressure ratio
pressure loss percentage
load of gas turbine in p.u.
ratio of specific heat
pressure loss percentage
ambient pressure
ambient temperature
heating value of fuel (J.kg)
conduction loss of IGBT
conduction loss of diode
resistance loss
collector-emitter voltage of IGBT
collector current
diode forward voltage
diode forward current
voltage across the resistor
current across the resistor
moment at that calculation starts (when calculating loss of rectifier)
cycle of calculating loss (rectifier)
turn on loss of IGBT
turn off loss of IGBT
reverse recover loss of diode
dc bus load power
total loss of a rectifier caused by semi-conductors and filters
Subscripts
compressor
turbine
compressor or turbine
inlet
outlet
fuel
combustor
isentropic process
gas turbine in variable speed operation
synchronous generator
L
IST OFA
BBREVIATIONSDiode Rectifier ...Diode Rectifier with Boost Chopper
DPF ... Displacement Power Factor
DC ... Direct Current
GT ... Gas Turbine
MMC ... Modular Multi-level Converter
MVDC... Medium Voltage Direct Current
PSC-PWM... Phase-shifted Carrier-based PWM
PV ... Photovoltaic
SG ... Synchronous Generator
THD ... Total Harmonic Distortion
VSC ... Three-level Diode Clamped Voltage Source Converter
CHAPTER 1
I
NTRODUCTION1.1CONTRIBUTIONS OF DISSERTATION
Developed procedures to investigate gas turbine (GT) in variable speed operation (VSO)
o Obtained the GT optimal efficiency and its corresponding optimal speed as a
function of its shaft load
o Conducted semi-theoretical analysis
o Validated by modeling and simulation
o Considered single-shaft (1-shaft) GT and twin-shaft (2-shaft) GT
o The percentage of fuel saving increasing as load decreasing
o Efficiency improvement larger for 1-shaft GT than for 2-shaft GT
o Up to 15% fuel saving for reference mission profile DDG-51 like hull
o Better torque-speed characteristic of 1-shaft GT by VSO
Provided guidelines for selection of ac-dc rectifiers for MVDC power systems.
o Boost type ac-dc rectifiers for use in MVDC systems: diode rectifier with boost
chopper (diode rectifier), three-level diode clamped voltage source converter
o Compared merits described as Figure 1.1, including system level, dc side factors,
ac side factors, complexity and cost of rectifiers, and the impact of VSO on
rectifier performance.
Figure 1.1 Compared merits of ac-dc rectifiers
o System level (efficiency): MMC is the most efficient and it remains efficient
almost independent of load conditions, while the efficiencies of VSC and diode
rectifier decreases as the load decreases.
o DC side factors: MMC has the best dc performance, including low overshoot, and
low ripple. MMC has only 3.2% voltage overshoot compared to diode rectifier‟s
18.3% and VSC‟s 26.5% following a 75% load shed.
o All of the studied rectifiers can achieve unity displacement power factor (DPF)
under rated conditions.
o The DPF of the diode rectifier decreases as the load decreases, falling to as low as
0.61 at 25% loading.
o The performances of VSC and MMC are relatively independent of speed while
variable frequency operation increases the DPF of a diode rectifier to 0.71 from
0.61 under 25% loading.
o Although the MMC has more components, it actually needs fewer switching
devices as compared to device series connections present in diode rectifier and
VSC.
o The MMC‟s capacitor weight is about 6 times that of VSC and about 8 times that
of diode rectifier. But the MMC‟s inductor is negligible compared to that of diode
rectifier and VSC.
The investigation of integrated MVDC power system with variable speed operation shows that the dc system efficiency could be improved up to 35% at 10% loading
compared to fixed speed operation.
Presented a method to implement the variable speed MVDC power system.
1.2MOTIVATION
1.2.1DCPOWER DISTRIBUTION CONCEPT
From the perspective of energy concern, the dc power distribution is becoming a trend
buildings, data centers, etc. As in [36], the potential benefits of the dc power distribution
system are summarized below:
With the increasing use of the equipments which operate on dc voltage, the dc power distribution system eliminates the corresponding ac-dc conversion which is required in
ac power distribution system.
Because of improved inverters, dc power is more efficiently and easily converted to the ac power.
The dc power delivery may enhance micro-grid system integration, operation, and performance. In dc power distribution system, the solid-state switching can quickly
interrupt faults.
In the dc power distribution system, the distributed generation devices or energy storages (other than flywheels) are able to be connected to the system without dc-ac
conversion, since those Distributed generation sources or energy storages devices are
dc voltage, such as photovoltaic (PV), fuel cells, batteries, etc.
The dc power delivery concept is greatly preferable in facilities such as data centers. As in [37], compared to ac system, dc power can improve the system efficiency up to
7% in data centers.
For marine applications, dc power distribution is even more preferable in terms of equipment weight saving because of the elimination of bulky transformers and main ac
The dc power distribution system concept enables the decoupling the engine speed from the generated terminal voltage, which makes the concept of running the engine at
variable speed feasible.
Generally, the dc system has a higher power density compared to ac system for a given generator, because in a dc power generation module speed reduction gears are not
needed and both the generator and the ac-dc converter can share the supporting
systems including cooling and noise isolation features, elimination of cabinetry and
bus cables [37].
The controlled-converter in a dc power system enables the use of permanent magnet
synchronous generators without adding extra component, by regulating dc bus voltage
to a desired value. Permanent magnet synchronous generator in dc power systems
greatly reduces the weight and volume of the synchronous generator and the ohmic
loss of the rotor resulting in less cooling demand.
Overall, the concept of dc power distribution system has great potential benefits in
terms of efficiency and ease of integration of future distribution technologies. In addition,
with the concept of running the engine and generator at variable speed, the system
efficiency will improve even more if the turbo-generators run at optimal operating speeds
for a given set of load.
1.2.2VARIABLE SPEED OPERATION OF GAS TURBINE GENERATOR SET
The dc power system makes it feasible that the gas turbine generator set runs at
1.3PROBLEM OF DESCRIPTION
The objective of this dissertation is to develop a procedure to improve the part-load
efficiency in the directly-coupled gas turbine generator dc power system topology by
adjusting the engine speed to the power demand and considering different ac-dc rectifiers.
In details, this dissertation answered three questions:
Feasibility of VSO improving a GT part-load efficiency?
o Efficiency gain
o Speed range
Recommendation of ac-dc rectifier topologies in MVDC power systems? Especially,
the impact of VSO on the rectifier performance
The way to implement a variable speed MVDC power system?
1.4APPLIED SOLUTION
Considering the power flow train of a dc system as in Figure 1.2, the dc system
efficiency depends on the gas turbine efficiency, synchronous generator (SG) efficiency,
and ac-dc rectifier efficiency.
The first step of solving the described problem in the previous section is to decide the
efficiency improvement priority of the dc system. In this work, gas turbine efficiency
improvement was considered the first priority in terms of dc system efficiency
improvement for the following reasons:
a. Gas turbine is the least efficient among the three components (GT, SG, and ac-dc
rectifier). For a simple cycle gas turbine, its efficiency is less than 35%, while for
synchronous generator and ac-dc rectifier; their efficiencies are more than 95%, or
even up to 98%. To illustrate that dc system efficiency improvement is dependent
on gas turbine efficiency improvement; Figure 1.3 shows different combinations of
gas turbine efficiency, synchronous generator efficiency, and ac-dc rectifier
efficiency. The first row of the table is the reference case when the system runs at
fixed speed. By increasing gas turbine efficiency 1% and decreasing SG efficiency
and ac-dc rectifier efficiency 1%, it gives total dc system efficiency 27.39%. By
decreasing gas turbine efficiency 1%, and increasing SG and ac-dc rectifier
efficiency 1%, it gives total dc system efficiency 26.73%. Figure 1.3 indicates that
improving gas turbine efficiency is the key to improve dc system efficiency.
b. The part-load efficiency of the gas turbine decreases much more dramatically
compared to synchronous generator and ac-dc rectifier, as seen in Figure 2.1 and
the following secretions.
c. With gas turbine efficiency improvement as first priority, the control of
implementation of such system is less challenged compared to the case of
considering all the three components‟ efficiency improvement (GT, SG, and ac-dc
rectifier) equally important.
The second step of the solution is the investigation of gas turbine variable speed
operation which is presented in Chapter 2. The third step of the applied solution is about
recommendation of ac-dc rectifier solutions in MVDC power systems as described in
Chapter 3. The last step of the solution is the applied method to implement the variable
speed MVDC power system illustrated in Chapter 4.
1.5STATE OF ART
For variable speed operation of gas turbine, there are two representative references.
One is about semi-theoretical analysis by N. Zhang, and R. Cai [4]; and the other one is
about gas turbine modeling and simulation by W. I. Rowen [9]. Ref [4] illustrated their
work for the mechanical engineering audience without details of procedures. Compared to
Ref [4], this dissertation improved
Gas turbine and generator have two ways for connecting their respective shafts, one is
through a gear box; the other is through direct coupling. The gearbox needs internal
inspection and long-time overhaul examination which momentarily reduce power
generation capacity. Furthermore, in a gas turbine power system, the gear box is one of the
most important factors of decreasing overall efficiency. Roughly, the gearbox loss will be
2% of the total output power of gas turbine [71]. Direct coupling eliminates the gear box
for weight and volume reduction, as well as efficiency improvement.
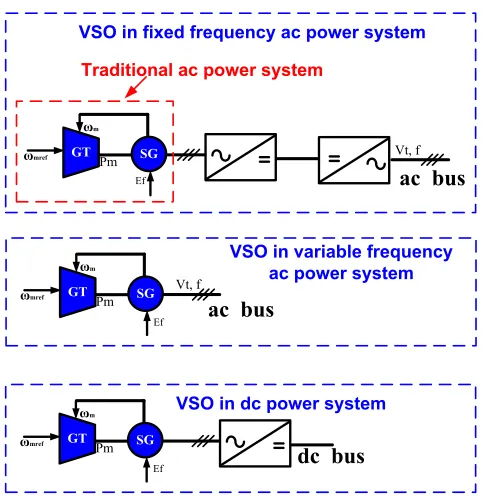
Without gearbox, variable speed operation (VSO) has three possible applications as
shown in Figure 1.4. In fixed frequency ac power system: ac-ac conversion is required to
match generator frequency to fixed system frequency. Another application of VSO is in
variable frequency ac power systems, which allows power system frequency to vary and
eliminates the inefficiency of the converters. The feasibility of VSO in variable frequency
ac power system depends on the line loads, and the speed range. The third application of
VSO is in dc power systems, the rectifier decouples the engine speed from the dc bus
distribution voltage. The total dc system efficiency depends on the efficiency of gas
turbine, synchronous generator, and ac-dc rectifier. This dissertation is focused on the
Figure 1.4 Possible applications of variable speed operation of gas turbine
There is no literature about efficient generator of power in MVDC systems by VSO of
GT.
Ref [5] with E.ON Energy Research Center at Aachen, Germany, investigated VSO in
fixed frequency ac power system with permanent magnet synchronous generator
connected to a diode rectifier and a three level neutral-point-clamped inverter. The results
of ref [5] shows VSO increased the 10 MVA system efficiency by 2.5% at 40% load.
This dissertation covers variable speed operation in MVDC system and comparisons of
possible ac-dc rectifiers. GT Ef SG Pm ωm ωmref GT
dc bus
Ef SG Pm ωm ωmref Vt, f
ac bus
Traditional ac power system
VSO in fixed frequency ac power system
VSO in dc power system
GT Ef SG Pm ωm ωmref
VSO in variable frequency ac power system Vt, f
ac bus
GT Ef SG Pm ωm ωmref GT
dc bus
Ef SG Pm ωm ωmref Vt, f
ac bus
Traditional ac power system
VSO in fixed frequency ac power system
VSO in dc power system
GT Ef SG Pm ωm ωmref
VSO in variable frequency ac power system Vt, f
ac bus
GT Ef SG Pm ωm ωmref GT
dc bus
Ef SG Pm ωm ωmref Vt, f
ac bus
Traditional ac power system
VSO in fixed frequency ac power system
VSO in dc power system
GT Ef SG Pm ωm ωmref
VSO in variable frequency ac power system Vt, f
CHAPTER 2
F
UELE
FFICIENCYO
PTIMIZATION ING
AST
URBINE2.1NOMENCLATURE
Table 2.1 Nomenclature of Chapter 2
Variable Meaning
mass flow rate (kg/s)
enthalpy (J/kg)
inlet temperature (K)
outlet temperature (K)
torque (Nm) speed (RPM)
ω speed (rad/s)
relative speed to design speed
in map efficiency
beta-auxiliary coordinate useful for representing table format of maps
pressure (Pa)
pressure loss percentage
pressure ratio
load of gas turbine in p.u. ratio of specific heat ambient pressure ambient temperature
HV heating value of fuel (J/kg)
temperature correction factor
pressure correction factor
Subscripts
compressor turbine
compressor or turbine
HT high pressure turbine (gas
generator)
LT low pressure turbine (free
power turbine) load
inlet
outlet
fuel
combustor
. isentropic process
2.2PROBLEM STATEMENT AND SOLUTION APPROACH
For electrical power generation, the output shaft of gas turbine typically runs at a fixed
speed, the design speed that matches the generator speed to the frequency of the ac
distribution system, typically 50 or 60Hz. Despite the previously mentioned advantages of
gas turbines, the well-known disadvantage is their low efficiency when operating at
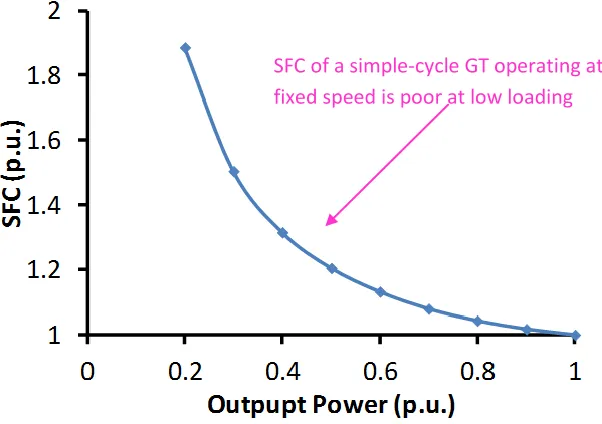
part-load [4] [5]. Figure 2.1 shows a typical variation of specific fuel consumption (SFC) with
turbine output power in p.u., indicating SFC is poor at low output power. For this
particular curve, when the load is 20% of rated power, the specific fuel consumption is
about 1.9 times the rated SFC. This fast deterioration of efficiency at part load is an
Figure 2.1 Typical SFC vs. output shaft power for a simple-cycle GT
However variable speed operation is emerging as a viable method to improve part-load
efficiency, where it has been explored for fuel cell gas turbine hybrid systems [33] [34].
For power generation using turbogenerators, variable speed operation can be realized for
both ac and dc systems. In dc systems, a controlled rectifier can maintain the desired dc
bus voltage as the speed varies. In ac systems, the desired ac bus voltage can be achieved
by the combination of an ac-dc rectifier (either controlled or uncontrolled) with a dc-ac
inverter. Of course excitation field control can also be applied in both cases, except in the
case of permanent magnet machines. Ref [5] described the part-load efficiency
improvement possible for a gearless medium voltage variable speed gas turbine ac system
where the desired ac bus voltage was controlled by the inverter only and the rectifier was
an uncontrolled diode bridge. That work did not describe modeling of gas turbines, which
is critical to understanding and quantifying the variable speed operating mode. A general
discussion on this topic is provided in the next paragraph.
2.3BACKGROUND/LITERATURE REVIEW
2.3.1GAS TURBINE OVERVIEW
Gas turbines are widely used in both mechanical drive applications and electrical power
generation as prime movers for their advantages in weight, compactness, fast response to
load changes, and flexibility of fuel choices [1][2][3]. Because of these advantages, gas
turbines are largely used in remote and autonomous power plants where space is at
premium, by utilities as peak power sources, by the aerospace industry, and in marine
applications to power the propulsion system and generate electricity. According to the
configuration of the shafts of gas turbines, they are categorized as single-shaft and
twin-shaft gas turbines. For single-twin-shaft gas turbine, both the compressor and the turbine share
the same shaft as shown in Figure 2.2. The twin-shaft gas turbine consists of a single-shaft
gas turbine, called the gas generator (or high pressure turbine), driving a free power
turbine (or low pressure turbine), as depicted in Figure 2.3. Single-shaft gas turbines and
gas generator sections of twin-shaft turbines may also consist of multiple-shafts forming
two or more spools and referred to as multi-spool gas turbines.
Shaft
Compressor
Combustor
Fuel
Air
intake
Shaft
Turbine
Exhaust
Figure 2.3 Diagram of a twin-shaft GT
2.3.2METHODS OF GAS TURBINE MODELING
An overview of gas turbine models was given in [6] which refers to physical models
[14], [16]-[21], time constant-based models[9], IEEE standard models[22][23],
aero-derivative models[7], GAST model [24], WECC/GGOV1 model [25]-[28], CIGRE model
[29], and frequency dependent models [30][31]. Physical models derive mathematical
equations for each engine stage based on the laws of thermodynamics. Some models, [9],
[22], and [23], are accurate only over a very narrow range of speeds such as those
representing heavy duty gas turbines for power generation. Models of aero-derivative
engines, as described in [7], have been developed for twin-shaft gas turbines, but can also
be applied to the situation where the speed of the free power turbine is fairly constant. The
other models are all similar to the model described in [9] in terms of control schemes,
which are all limited to a fairly constant speed range too. In the area of gas turbine
modeling, a lot of work [7] [8] involves design point modeling [9], which provides
mathematical equations for torque, speed, and fuel flow rate near the design operating
free power turbine
point. The coefficients of the mathematical equations are tuned based on field
measurement data from real gas turbine power plants [8] [10]. There is another approach
[11] to develop gas turbine models for both design and off-design performance analysis.
This approach consists of constructing artificial performance maps of compressors and
turbines which are constructed from the generalized maps found in the literature [32] with
appropriate scaling techniques. Similar to other techniques, it is to be validated with test
measurement data from real plants because of the uncertainty in assumptions that are
necessarily made to produce the artificial maps.
2.4SEMI-THEORETICAL ANALYSIS
In this work, artificial turbine maps were used to model the gas turbine with the
commercial software GasTurb [12], to evaluate its off-design performance. A
semi-theoretical analysis of gas turbine off-design performance was also conducted for
comparison with the modeling and simulation results. The semi-theoretical analysis
includes thermodynamic equations that govern gas turbine engine operation to evaluate its
off-design performance.
Gas turbine off-design performance is analyzed by using basic thermodynamic
equations that govern gas turbine operation, and typical compressor and turbine
characteristic maps. The characteristic maps describe relationships among pressure ratio,
efficiency, mass flow rate, and rotational speed. Manufacturer‟s characteristic map data of
a particular gas turbine component available from the literature, are scaled and used for a
particular engine configuration [35]. This analysis is termed as semi-theoretical with
2.4.1ASSUMPTIONS
In this semi-theoretical analysis, the thermodynamic equations are developed based on
the following assumptions:
o There is no bleed, which means that mass flow consists of air intake at the
compressor, fuel input at the combustor, and hot gas exhausts through the
exhaust ducts only.
o Pressure losses in the compressor, turbine, and ductings are neglected.
o Mechanical losses in pumps and bearings are neglected.
o Pressure loss across the combustion chamber is a constant small percentage of
the combustor inlet pressure.
(2.1)
2.4.2COMPATIBILITIES OF COMPONENTS AND THERMODYNAMIC EQUATIONS
All off-design equilibrium running points are calculated by satisfying the
compatibilities of rotational speeds, mass flow, and work among the various gas turbine
components as discussed below [14].
Speed Compatibility: for a single shaft gas turbine, the compressor and turbine are
directly coupled giving (2.2):
(2.2)
For a twin-shaft gas turbine, the compressor is coupled with the gas generator while the
free power turbine is connected to the load. The relations are expressed as (2.3) and (2.4).
(2.4)
Mass Flow Compatibility: without bleed effect, mass flow at the turbine inlet is the
sum of compressor outlet air mass flow and fuel mass flow at the combustor as (2.5).
(2.5)
Power Flow Compatibility: neglecting losses, the power generated by the turbine is
consumed by the compressor and load as (2.6) and (2.7).
(2.6)
(2.7)
The enthalpy variation with temperature is available in the literature. In this work, the
curve fitted correlation of enthalpy and temperature from the software GasTurb [12] to
calculate the enthalpy and power therefrom, are used. The outlet temperatures of
compressor and turbine are calculated as (2.8) and (2.9).
(2.8)
(2.9)
The pressure ratio, mass flow, and efficiency are functions of speed, and auxiliary
coordinate β [12] as (2.10) to (2.12) below. The auxiliary coordinate β prevents ambiguity
between vertical and horizontal speed line characteristics representation of the map, and
thus helps with data retrieval from the map table.
(2.11)
(2.12)
where
(2.13)
(2.14)
With the scaling laws (2.15) to (2.17) below which help generalize the use of available
component maps to different configuration [35], the pressure ratio, mass flow rate, and
isentropic efficiency are given by
(2.15)
(2.16)
(2.17)
Finally, the gas turbine efficiency and torque are calculated as (2.18) and (2.19).
(2.18)
(2.19)
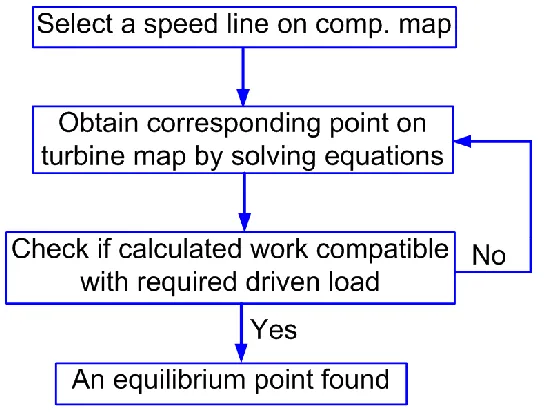
An iterative approach is needed to solve the governing equations (2.2) to (2.19) and
follows the procedure, for a single-shaft gas turbine, as described below [14] with its
o Select a speed line on the compressor map.
o The corresponding point on the turbine characteristic is obtained from
consideration of compatibility of rotational speed and mass flow.
o With matched compressor and turbine characteristics, check whether the
generated work corresponding to the selected operating point is compatible with
the required driven load.
Figure 2.4 flow chart of the approach to solve GT governing equations
For twin-shaft gas turbine, the matching of gas generator and free power turbine is also
needed. In this work, multivariable Newton Raphson iteration method is used to do the
iterative calculations until an equilibrium running point is found.
2.4.3SEMI-THEORETICAL RESULTS OF SINGLE-SHAFT GAS TURBINE
available compressor and turbine characteristic maps. The output data were analyzed and
fitted for the optimal efficiency and speed as a function of load.
(2.20)
(2.21)
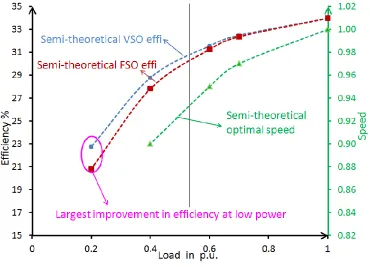
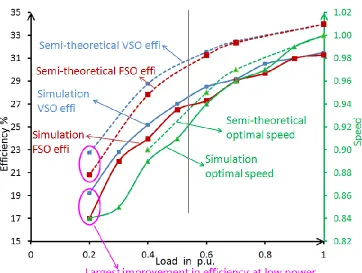
These results (dashed lines) are plotted on Figure 2.5 to show the impact of VSO on
single-shaft gas turbines efficiency from semi-theoretical analysis. The green curve is the
optimal speed corresponding to the optimal efficiency. For a given output shaft power,
VSO can always bring higher efficiency by running the engine at the optimal speed other
than fixed speed. The improvement increases as the load decreases. And the largest
improvement happens at the lowest load, in this case in Figure 2.5, 20% loading.
2.4.4SEMI-THEORETICAL RESULTS OF TWIN-SHAFT GAS TURBINE
Similarly, following the same procedure of solving single-shaft gas turbine, the
semi-theoretical results for a 0.96MW 20000RPM twin-shaft gas turbine are presented as in
(2.22) and (2.23). Because of very limited access to the characteristic maps and data of a
particular gas turbine, a twin-shaft gas turbine with different rating from single-shaft gas
turbine was investigated.
(2.22)
(2.23)
These results (dashed lines) are plotted on Figure 2.6.
Figure 2.6 Semi-theoretical results of the impact of VSO on twin-shaft GT efficiency
2.5MODELING AND SIMULATION
The traditional linear modeling of gas turbine [7] [8] [9] are only valid for a small
range around the design speed. In addition, modeling parameters are determined from
tedious calculations and a tuning process using data obtained from field measurements. To
study the wide range of operating speed other than the design speed, as well as part load
condition, the gas turbine is modeled in GasTurb to verify the results obtained by the
semi-theoretical analysis method described in the previous section. To determine the
maximum efficiency points at different load conditions, from 0.2 to 1.0 p.u. both
single-shaft and twin-single-shaft gas turbines were simulated for a range of single-shaft speed, 0.8 to 1.2 p.u.
with increment of 0.01 p.u.
2.5.1SINGLE-SHAFT GAS TURBINE MODELING
Figure 2.7 is the model set-up in GasTurb for a 5.71MW, 15808RPM single-shaft gas
turbine power generation unit. The simulation results show, the impact of variable speed
operation on single-shaft gas turbine efficiency as illustrated in Figure 2.8. To compare the
results from semi-theoretical analysis, Figure 2.8 shows the results from both simulation
and semi-theoretical analysis.
Figure 2.8 Impact of VSO on single-shaft GT efficiency (semi-theoretical and simulation)
In Figure 2.8, the green curve is the optimal speed corresponding to the optimal
efficiency as indicated on the figure. The fixed speed efficiency curve is part-load
efficiency at design speed, N=1.0 p.u. As can be seen on Figure 2.8, for lower power load
demand, the gas turbine is more efficient at lower speed, as compared to fixed design
speed. The semi-theoretical analysis results have similar trend as the simulation results,
but the curves of semi-theoretical results being on the higher side in Figure 2.8.
The semi-theoretical analysis results were subjected to some modeling assumptions
simulation were bleed, inlet/outlet losses, combustor part load calculation, shaft efficiency,
component geometric properties, and other standard loss calculations. Otherwise, the
overall graphical comparison shows an improvement of part-load efficiency for variable
speed operation as compared to fixed-speed operation.
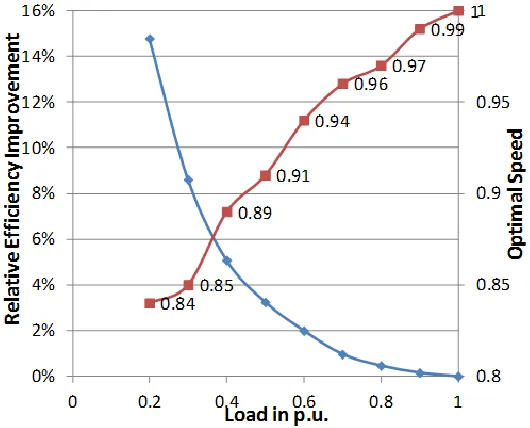
To better quantify the effect of variable speed operation, a variable, relative efficiency
improvement is defined as
(2.24)
The relative efficiency improvement vs. output power of gas turbine is shown
in Figure 2.9 and the blue line is the corresponding optimal speed.
Figure 2.9 Relative efficiency improvement of single-shaft gas turbine at variable speed
For this specific single-shaft gas turbine, in simulation results as in Figure 2.8, the
maximum absolute efficiency gain is 2.47% and its relative efficiency increased 14.77% at
every gas turbine has its allowable specific operating speed range. For this modeled
single-shaft gas turbine, the shaft cannot run at speed lower than 0.84 p.u. which shows up
as non-convergences in simulation as indicated in the compressor map as Figure 2.10 and
the turbine map as Figure 2.11. N means speed in p.u.; contours of constant efficiency are
indicated with red dotted lines and corresponding numbers The upper red dashed line is
the surge line, which confines the feasible engine operating points. Also in Figure 2.10
and Figure 2.11, the green dot is the design point and the red dot is the operating point at
speed of 0.83 p.u. The part-load efficiency improvement would be higher if the
compressor had a wider range of operating speeds.
Figure 2.10 Compressor operating at speed N= 0.83 p.u. in single-shaft gas turbine speed
0 2 4 6 8 10 12 14 16
5 7.5 10 12.5 15 17.5 20 22.5
P re ss u re R a ti o
Mass Flow (kg/s)
Compressor efficiency line (red dot contours) Non-converged point
(red dot)
Surge line (red dashed line)
Design point (green dot)
Figure 2.11 Turbine operating at speed N=0.83 p.u. in single-shaft gas turbine
Because almost two thirds of power generated by the turbine is used by the compressor,
the turbine efficiency is relatively high as compared to the compressor efficiency.
Therefore, adjusting the speed of the compressor corresponding to the load is the key to
improve the part-load efficiency of the whole gas turbine. With different load conditions,
the efficiency of the compressor running at fixed speed (design speed 1.0 p.u.) decreases
along the speed line as can be seen in Figure 2.12. But in variable speed operation mode,
the compressor efficiency decreases much less compared to fixed speed operating mode as
shown in Figure 2.12, where the green dots are the optimal speed operating points and the
green dashed line indicates variable speed operating trend for optimized efficiency when
Figure 2.12 Compressor part load efficiency at fixed speed and variable speeds.
2.5.2TWIN-SHAFT GAS TURBINE MODELING
Similarly to the modeling of single-shaft gas turbine, a 0.96MW 20000RPM twin-shaft
gas turbine was modeled and variable speed operation of the free power turbine was
simulated as well. The impact of variable speed operation on efficiency is illustrated in
Figure 2.13. Compared to the modeled single-shaft gas turbine feasible operating speed
range, from 0.84 to 1.2 p.u., the modeled twin-shaft gas turbine has a wider feasible
operating speed range, from 0.8 to 1.2 p.u.
0
2
4
6
8
10
12
14
16
5
7.5
10
12.5
15
17.5
20
22.5
P re ss u re R a ti o
Mass Flow Rate (kg/s)
optimal speed operating points (green dots)
Fixed speed operating points (yellow dots)
Varia ble sp
eed
opera ting t
Figure 2.13 Impact of variable speed operation of twin-shaft gas turbine efficiency
Figure 2.13 shows that the maximum efficiency gain is 0.77% which increases from
15.03% to 15.8% at 20% of rated load with optimal speed N=0.8 p.u. For this load
demand, running at variable speed operation may save up to 5.11% of fuel consumption.
Running the free power turbine at variable speed operation only benefits the free power
turbine itself, since the gas generator already runs at variable speed automatically based on
the shaft load demand. The small change in efficiency with speed can also be explained by
the free turbine power-speed curve shown in Figure 2.14 [14] which exhibits a speed
range where power changes very little and which results in a small change in efficiency as
Figure 2.14 Free power turbine speed curves [14]
2.6TEST ON GIVEN LOAD PROFILE
To further quantify the impact of variable speed operation of the single-shaft gas
turbine, a load profile that illustrates the inherent part-load characteristics of propulsion in
a navy ship is used to calculate total fuel consumption for constant and variable speed
operations. Figure 2.15 (directly copied from [13]) shows a typical speed profile of a
DDG51 ship (the speed profile is used as a surrogate for the electric power consumption
profile on the basis that the propulsion system consumes the largest fraction of total
electric power in an electrically-powered ship). The corresponding power profile is shown
in Figure 2.16, in p.u., to illustrate the typical variation of propulsion power with ship
speed. While the top speed of 30 knots requires full propulsion power, the time spent at
that speed is less than 1%. This indicates that for the majority of the time, propulsion
operates at part-load which will have a major impact on fuel consumption, and using
variable-speed operation in this case has potential for significant fuel saving. The
(2.25)
Figure 2.15 Typical propulsion speed profile of DDG-51 [13]
By scaling the load profile in Figure 2.16 to the rated power of the single-shaft gas
turbine studied earlier, i.e. 5.71MW, and by constructing a 24-hour load profile that
satisfies the speed and power profile shown in Figure 2.15 and Figure 2.16, total fuel
consumption can be calculated for constant and variable speed operation of the gas
turbine. For the load profile given in Figure 2.15, the total 1-day fuel consumption at
variable speed and fixed speed operations are in Table 2.2. If a similar load profile was
used, but with different power rating, the absolute fuel consumption reduction may be
lower, but it is still 15.02% fuel consumption reduction per day as compared to the
original fixed speed operation. The results are summarized in Table 2.2.
Table 2.2 Example of 1- day fuel consumption for constant and variable speed operation of gas turbine
Operation Mode Fuel (kg)
Fixed Speed (N=1 p.u.)
Variable Speed
Fuel Consumption Reduced: 15.02% ( kg)
The calculation performed here, with a single-shaft gas turbine, was to illustrate the
difference in fuel consumption between the two modes of gas turbine operation using a
given load power profile that exhibits part-load characteristics as an example. It is
important to note that in a typical ship there are several prime movers with different power
ratings which can be adjusted so as to minimize fuel consumption when the load changes.
variable speed operation mode may not improve fuel saving as compared to the single
engine case. However, if there is redundancy requirement in the system, then the variable
speed operation would be very beneficial in terms of fuel saving like the investigated
single-shaft turbine.
2.7TORQUE CHARACTERISTIC COMPARISON
The impact of variable speed operation on the torque speed characteristics of
single-shaft engines and on the gas generator of twin-single-shaft gas turbines are described in Figure
2.17 and Figure 2.18. The gas generator torque-speed characteristic for the twin-shaft gas
turbine is similar to that of a single shaft gas turbine running at variable speed operation,
which also explains in fixed speed operation, why the twin-shaft gas turbine gives
relatively higher part-load efficiency compared to that of single-shaft gas turbines.
Figure 2.18 Torque characteristics of gas generator for a twin-shaft gas turbine
2.8DISCUSSION AND CHAPTER SUMMARY
Variable speed operation has great benefit in improving part-load efficiency of a
single-shaft gas turbine. It also provides better torque-speed characteristic for the reason that the
compressor speed is adjusted to the power output. In contrast, the twin-shaft gas turbine
doesn‟t benefit from variable speed operation as much as the single-shaft gas turbine
because only the free power turbine itself benefits from the additional speed freedom – the
gas generator already normally operates at variable speed. Considering that two thirds of
the power produced by the gas turbine is consumed by the compressor and the turbine
itself operates in a relatively high efficiency range, improving only the efficiency of the
free turbine doesn‟t contribute significantly to improve the whole twin-shaft gas turbine
efficiency. But in general, the variable speed operation does improve the part-load
CHAPTER 3
C
OMPARISONO
FP
OSSIBLER
ECTIFIERST
OPOLOGIES INMVDC
P
OWERS
YSTEMSIn the dc power generation chain, the dc system efficiency is decided by the gas turbine
efficiency, the synchronous generator efficiency, as well as the rectifier efficiency.
Chapter 2 presents the work about improving gas turbine efficiency by running it in
variable speed operation mode. The synchronous generator efficiency improvement is
described in Chapter 4, along with the integrated MVDC power system in variable speed
operation mode. This chapter is a description of comparison of different rectifier
topologies in MVDC power systems.
3.1PROBLEM STATEMENT
DC power distribution offers several advantages over ac systems such as elimination of
bulky transformers and the potential for variable speed operation which improves
efficiency for part-load conditions, as described in the previous chapter. Medium voltage
dc power distribution system is particularly suited for ship power systems because it
provides high power density and the decoupling of generator speed and bus voltage [38].
Power generation modules in MVDC power systems typically consist of an ac power
generation unit, such as a gas turbine coupled to a synchronous generator and an ac-dc
rectifier. All these components have a significant effect on system efficiency and other
performance metrics. The previous work presented in last chapter investigated the
variable speed operation [56]. This chapter addresses factors affecting the selection of the
ac-dc rectifier for ship MVDC power systems including variable speed operation
condition.
We consider only rectifiers that are appropriate for the voltage ranges typical for ship
MVDC power systems. In MVDC ship power systems, dc bus voltages fall in the range of
1 to 35kV. IEEE Standard P1709/D11 (see Table 3.1) identifies preferred dc bus voltage
levels [46]. For gas turbine driven generators, the recommended rated terminal voltages
include 6.9kV, 11.5kV, 12.5kV, 13.8kV, and 14.4kV for 60Hz ac power systems [43]. We
only consider boost type rectifiers to increase distribution voltage which leads to higher
efficiency as compared to low voltage distribution systems. These factors suggest that a
boost ac-dc rectifier, one having output dc voltage higher than the peak line-line ac
voltage, is likely to be used in ship MVDC applications.
Table 3.1 Recommended MVDC voltage classes in ship system [46]
Variable Maximum MVDC Class
Rated Voltage (kg)
Already established classes or
or
Future design classes
3.2COMPARISON FACTORS
First, the following factors that affect the complexity and cost of the rectifiers are
considered:
o Complexity of rectifier control
o Number of switching devices
o Number/size of capacitors
o Number/size of inductors
We then examine several electrical performance factors, identified by Siebert, et. al.
[42], as important when selecting ac-dc rectifiers for power systems. These factors fall
into three categories: system level, dc side, and ac side.
The system level factor is:
o Rectifier efficiency (rated load and part load)
The dc side factors are associated with the quality of power provided to loads and
include:
o dc voltage
o regulation constancy of dc bus voltage
o ripple of dc bus
o voltage regulation speed (overshoot and settling time in response to step load
change)
The ac side factors include:
o power factor (or displacement power factor)
o ac voltage variation (magnitude, phase angle, and frequency)
Each of these factors except ac voltage variation (magnitude, phase angle and
frequency) is considered. The factor of ac voltage variation is excluded because in a ship
dc power system [38][41], the generators are not synchronized and the frequency and
generator terminal voltage is not required to be fixed if a controlled rectifier is applied.
3.3RECTIFIER OF TOPOLOGIES AND PARAMETERS
There are three types of boost ac-dc rectifiers available: diode rectifier with boost
chopper (diode rectifier), three-level diode clamped voltage source converter (VSC), and
modular multilevel converter (MMC). These three rectifiers are modeled and tested for a
MVDC system with the parameters listed in Table 3.2. It is noted that here an available
4.16 kV synchronous generator is used. These parameters are typical of an electrical ship
MVDC power system [38] [46]. Part-load efficiency is evaluated at 20% from rated
frequency [56]; hence we analyzed the three models under ac side frequency of 0.8 p.u.
Table 3.2 Data of test system
Parameters Value
rated line frequency (Hz)
line-to-line voltage (kV)
rated power (MW)
dc bus voltage(kV)
load change (p.u.) to
The THD of the converters is an important design factor because it causes losses and
impacts the generator life [54] [55], and affects the sizing of filter elements in the
converters. For this study, the three rectifiers considered are designed to have an ac side
THD less than 5% under rated condition.
The maximum ripple and steady state voltage tolerance and deviation for the dc bus
voltage are taken from IEEE standard 1662 [47] and listed in Table 3.3.
Table 3.3 Recommended requirements of voltage variations for dc system [47]
Parameters Variations
Voltage tolerance (continuous)
Voltage cyclic variation deviation
Voltage ripple (ac root-mean-square over steady dc voltage) 10%
3.3.1DIODE RECTIFIER AND ASSOCIATED CONTROL
The diode rectifier with boost chopper first introduced in [48] is a two-stage ac-dc
rectifier where a diode rectifier is connected with a dc-dc boost converter as in Figure 3.1.
It consists of an input LC filter and , a boost inductor , a three-phase diode
rectifier, an active power factor stage, and a dc link capacitor. Among the three reviewed
rectifiers, the diode rectifier with boost chopper has the simplest control structure as in
Figure 3.1 Diode rectifier with single-switch boost chopper
Figure 3.2 Diode rectifier with boost chopper control structure
3.3.2VSC AND ASSOCIATED CONTROL
The three-level diode clamped voltage source converter [49] has six more diodes and
one more capacitor to clamp the output terminal potentials to the neutral point. It produces
fewer harmonics than that of a two level voltage source converter by using extra diodes
and capacitor. The controllers applied in the rectifier with LCL filter are synchronous PI
controller [50] as in Figure 3.3. The corresponding control diagram is shown in Figure 3.4. 1 a L a V b V c V 1 b L 1 c L dc I dc V Load 2 a L 2 b L 2 c L f
C Cf Cf
_
d C 7 D 1 T
+
PI Controller
*
dc
V
-+dc
v
ref
v
Figure 3.3 Three-level diode clamped VSC with LCL filter
Figure 3.4 Control structure of three-level diode clamped VSC
3.3.3MMC AND ASSOCIATED CONTROL
MMC, illustrated in Figure 3.5, was first introduced in 2001 [51]. It has three legs
(corresponding to each phase) and each leg has two arms, upper arm and lower arm. Each
arm has a total number of „n‟ sub-modules and one inductor. Due to the modular structure,
it can be extended to any level of power and voltage, and any number of voltage steps
which then permits low THD of the input current. Sub-modules in one arm need not be
a V b V c V dc I
+
_
11S S21
12 S 11 D dc I dc V
+
Load 22 S 21 D 31 S 32 S 31 D 13 S 12 D 14 S 1 C 2 C 23 S 22D D32 S33
34 S 24 S f L f L f L c L c L c L f
C Cf Cf
d
R Rd Rd
switched on or off at the same time so the stresses on the devices are significantly reduced
which increases reliability of semiconductor devices [52]. For 25MW, 10kV MVDC
system we modeled a 10-level MMC, which brings the sub-module voltage to 1kV- easily
achievable with current semiconductor topologies Figure 3.6 is the control diagram
including dc voltage controller and inner current controller. The applied modulation
scheme is phase-shifted carrier-based PWM (PSC-PWM) with reduced
switching-frequency voltage balancing algorithm [53].
Figure 3.5 MMC
0 L a V b V c V 1 s L 1 s L ... . SM 1 SM 2 SM n ... . SM 1 SM 2 SM n ... . SM 1 SM 2 SM n 0 L 0 L ... . SM 1 SM 2 SM n ... . SM 1 SM 2 SM n ... . SM 1 SM 2 SM n 0
L L0 L0
c
V
1
T D1
2
T D2
Figure 3.6 Control structure of MMC
3.4RESULSTS AND MERITS COMPARISON
3.4.1COMPARISON OF NUMBER OF SEMI-CONDUCTOR DEVICES
Table 3.4 lists the numbers of semi-conductors for the three configurations of rectifiers.
The diode rectifier (6-pulse) theoretically needs 1 IGBT and 7 diodes; the VSC
theoretically needs 12 IGBTs and 6 diodes; and the MMC needs 120 IGBTs (for 10 level).
However, because of the high power rating required, the diode rectifier needs 9 IGBTs
and 140 diodes; the VSC needs 96 IGBTs and 48 diodes; and the MMC keeps the same
number of IGBTs, 120. Even though, the base configuration of MMC requires more
devices, it ends up with fewer devices for high power applications, which results in lower
power losses as will be demonstrated next.
Table 3.4 Number of semi-conductor devices in rectifiers
Diode Rectifier VSC MMC
IGBTs Diodes IGBTs Diodes IGBTs
Type StakPak 5SNA ABB HiPak 5SLD ABB HiPak 5SNA ABB HiPak 5SLA ABB HiPak 5SNA ABB
2000K451300 1200J330100 3600E170300 3600E170300 3600E170300 # per
stage 1 7 12 6 120
# of
stages group of 3 in series,
group of 4 in series,
group of 4 in series,
group of 4 in
series, 1
3 groups in parallel
5 groups in parallel
2 groups in parallel
groups 2 in
parallel
Total 9 140 96 48 120
3.4.2COMPARISON OF INDUCTORS AND CAPACITORS
Table 3.5 describes the numbers and values of inductors and capacitors required for
each rectifier. It is noted that a 10 level MMC needs total 60 sub-module capacitors and 6
arm inductors. Considering that dc side capacitors are electrolytic type, the corresponding
weight is approximated as 0.2 kJ/kg [60][61]; and the ac side capacitors are polymer film
type, with weight approximated as 0.4 kJ/kg [60][61]. As expected, MMC has the most
total capacitors weight among the three rectifiers due to each submodule needing one
capacitor. Assuming air core type with single layer [62], the total length for the
corresponding inductor values are listed in Table 3.5. Diode rectifier has the longest wire
(heaviest in mass), due to the high inductance value for ac side filter.
Table 3.5 Filters components comparison
System Parameter Diode rectifier VSC MMC
N/A
N/A
N/A
N/A N/A
N/A N/A
N/A N/A
3.4.3RECTIFIER EFFICIENCY
The losses in the three reviewed rectifiers include losses in semi-conductor devices
(IGBT and diode), and equivalent resistance losses of inductors. Losses in semi-conductor
devices include conduction losses and switching losses. The conduction losses of IGBT
and diode are calculated as (3.1) and (3.2). The resistance loss is calculated as (3.3):
(3.1)
(3.2)
(3.3)
conduction loss of IGBT
conduction loss of diode
resistance loss
collector-emitter voltage of IGBT
collector current
diode forward voltage
diode forward current
voltage across the resistor
moment at that calculation starts
the cycle of calculation
According to datasheet [58] for a particular semi-conductor device, as shown in Figure
3.7, the collector-emitter voltage of IGBT, is a function of collector current, which is
approximated as a polynomial function of using curve fitting as in (3.4). Figure 3.9
displays that this polynomial equation represents the relationship of and very well.
(3.4)
Figure 3.8 Typical Vf and If characteristic of diode [58]
Figure 3.9 Curve fitting of Vce as a function of Ic
0 600 1200 1800 2400 3000 3600 4200 4800 5400 6000 6600 7200
0 0.5 1 1.5 2 2.5 3 3.5 4 4.5 5
Ic (A)
Vce
(
V
)