Pilot Study of Wire EDM on Cryo-treated H13
Tool by using RSM
Khapre Supriya Pramod1, Shelke Rahul D2, Navnath S Kalyankar3
P.G. Student, Department of Mechanical Engineering, D.S.Q. College of Engineering & Technology, Aurangabad,
Maharashtra, India1
Head o Department of Mechanical Engineering, D.S.Q. College of Engineering & Technology, Aurangabad,
Maharashtra, India2
Associate Professor, Department of Mechanical Engineering, D.S.Q. College of Engineering & Technology,
Aurangabad, Maharashtra, India3
ABSTRACT:This paper untangle the sequel of individual process parameters of Wire Electrical Discharge Machining
(WEDM) like Pulse On (TON),Pulse Off (TOFF), Peak Current (IP) which has been scrutinized to ramification on surface roughness(RA) of Cryo-treated H13 tool steel on WEDM by using Response surface methodology (RSM). The Box Behnken Design (BBD) was used for preparing the experiments. The optimum set of input parameters for maximum surface roughness (RA) has been determined. It has been rummage that, Pulse on evinces prominent performance for increasing RA. Cryogenic treatment helps to transform retained austenite into martensite. The result was analyzed by Regression method using analysis of variance (ANOVA) method.
KEYWORDS: ANOVA, BBD, Cryogenic treatment, RA, RSM
I. INTRODUCTION
As manufacturers solicit materials that consist bountiful service life, wear-resistances, toughness, superior thermal conductivity and insensitiveness to hot cracking and more efficient. Hence it is easy to perceive that such materials should be highly advanced to achieve elaborate productivity. The difficulty is to choose such material which emerges in form of efficiency and commendable service life. The best credible solution to this issue is adhering to cryogenic treatment. Exploiting Cryogenic treatment can obtain enhancing hardness, toughness and tool life leads to fine microstructure. The innumerable use of WEDM dueto ability to make complex shapes with hard materials and alloys. To investigate WEDM performance measures such Surface roughness (RA). To implement the intendresearch problem, we are going to outline experiments by using BBD method and analysis by ANOVA. This exercise consists of innumerable of control factors and their stochastic nature owing to which it is a challenging task to achieve optimal performance against the in tail response.[4] [16]
II. RELATEDWORK
speed (300 m/min). In addition, thelowest Fc and Ra values were obtained in the turning of the CTT samples due to the decreases in hardness and improvements in mechanical and micro-structure.[1]Mahdi et al [3] explainedCryogenic treatment at -72 0C and deep cryogenic treatment at -196 0C was applied and it was found that by applying the subzero treatments, theretained austenite was transformed to martensite. As the temperature was decreased more retained austenitewas transformed to martensite and it also led to smaller and more uniform martensite laths distributedin the microstructure. The deep cryogenic treatment also resulted in precipitation of moreuniform and very fine carbide particles. The micro structural modification resulted in a significantimprovement on the mechanical properties of the H13 tool steelthe most important effect of tempering the deep cryogenicallytreated samples was the improving of the wear properties of theH13 tool steel.[3]In deep cryogenic treatment (DCT) -1960 C for 24 hours have been shows significant improvement on micro structural modification and mechanical properties of H13 tool steel. [1-4],[9]. Cryogenic treatment shows improvement in wear resistance. [12]. in micro-structural modification treatment reduces the retain austenite content is very convenient as it enhances dimensional stability [4]. Experimentally investigationthe effect of various input parameters of WEDM on RA and MRR. Relationship between responses and input parameters are analysed by using ANOVA.[5-7] The fundamental and analytical of Box Behnken Design (BBD).Harvinder et al [5] have experimentally investigated the effects of various WEDM variables on Surface Roughness of AISI H13 using ANOVA method. The effect of all the input parameters on the output responses have been analyzed using analysis of variance (ANOVA). Plots of S/N ratio have been used to determine the best relationship between the responses and the input parameters. The surface roughness was found to be minimum with diffused wire and maximum with plain brass wire. The surface roughness increases with increase in pulse on time. The surface roughness decreases with increase in pulse off time, peak current, servo voltage, and flushing pressure. As the wire tension increases, the surface roughness first decreases and then increases with further increase in wire tension. As the wire feed rate increases, the surface roughness first increases and then decreases. As the servo feed rate increases, the surface roughness initially decreases and then increases with increase in servo feed rate [5]J.Udaya et al [6]hadapproached for optimization on WEDM variables on multiple performance characteristics of AISI H13 using ANOVA method. The effect of all the input parameters on the output responses have been analyzed using analysis of variance (ANOVA). [6]Pathya et al [7] explainsoptimization of recast of layer thickness the surface roughness simultaneously in a WEDM process by using Taguchi method with Fuzzy LOGIC has been applied of AISI H13 STEEL with multiple performance characteristics such as MRR & SR [7]
As the summery of related work is most of research was done on study of different types of heat treatments on H13 tool steel, changes in microstructure as well as properties of H13 tool steel. Almost research paper shows the effect of input parameters on RA and MRR of Non Cryo –Treated H13 tool steel on WEDM by using taguchi method and Optimization was performed by ANOVA .
III.EXPERIMENTALDETAILS
3.1Material Selection
Cryo-treated H13 hot work tool steel has high ardent tensile strength, fiery wear-resistance and toughness. Good thermal conductivity and insensitiveness to hot cracking. it is the exercise of treating material to cryogenic temperatures -196°c for 24 hr [1][3][4] to remove residual stresses and improve wear resistance on steels. The procedure has a extensive range of applications from industrial tooling to improvement of musical signal transmission.[14]
TABLE NO.1.1: CHEMICAL COMPOSITION OF CRYO TREATED AISI H13 TOOL STEEL
El C Mn Si Mo Cr V S P Ni C
u Fe
% 0.320 To 0.450
0.200 To 0.500
0.800 to 1.200
1.100 To 1.750
4.750 To 5.500
0.800 To 1.200
Table No. 1.1 shows various chemical composition of AISI H13 tool steel.It is the process of treating material to cryogenic temperatures (-196°C) for 24 hr to remove residual stresses and improve wear resistance on steels.
3.2 Schematic of Machining
The experiments were conduct on a wire-cut EDM machine ELEKTRA SPRINTCUT 734.The size of work – piece is 10mm*10mm*16 mm. The brass wire with 0.25 mm diameter was used as electrode in experiment.
Table No.1.2 WEDM Specifications
Design: Fixed column, moving table Table size: 440 x 650 mm
Max. work piece height: 200 mm Max. Work-piece weight: 500 kg
Main table traverse (X, Y): 300, 400 mm
Auxiliary table traverse (u, v) : 80, 80 mm
Wire Electrode diameter: 0.25 mm (Standard)
Generator: ELPULS-40 A DLX
Controlled axes: X, Y, U, V Simultaneous: independent
Interpolation: Linear & Circular Input Power supply: 3 phase, AC 415 V, 50 Hz
Connected load: 10 KVA Average power consumption: 6 to 7 KVA
Table No. 1.2 exhibits WEDM’s miscellaneous specifications such as design, table’s size, Max. Work piece height & weight, table traverse, wire Electrode diameter, controlled axes etc that are used to effectuate this experiment.
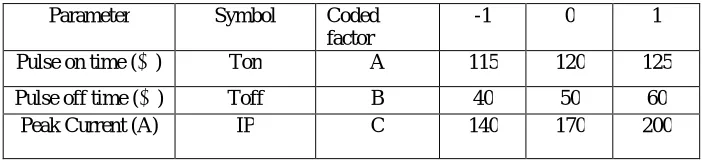
Table No.1.3: Different coding input variables
Parameter Symbol Coded factor
-1 0 1
Pulse on time (μs) Ton A 115 120 125
Pulse off time (μs) Toff B 40 50 60
Peak Current (A) IP C 140 170 200
The different coding variables are used in the experiment are depicted in TableNo 1.3 In the experiments conducted with the combination of machining parameter are presented in Table No.1.3.
IV.RESPONSESURFACEMETHODOLOGY(RSM)
4.1 B ox B ehnken Design (BB D)
The Box Behnken Design (BBD) has been implemented for this study with three variables in total 15 runs. [15] By using Minitab 18 software.
FACTORS: 3 REPLICATES: 1
BASE RUNS: 15 TOTAL RUNS: 15
BASE BLOCKS: 1 TOTAL BLOCKS: 1
CENTRE POINTS:3
TABLE NO.1.4DESIGN TABLE
Run Blk A B C
1 1 -1 -1 0
2 1 1 -1 0
3 1 -1 1 0
4 1 1 1 0
5 1 -1 0 -1
6 1 1 0 -1
7 1 -1 0 1
8 1 1 0 1
9 1 0 -1 -1
10 1 0 1 -1
11 1 0 -1 1
12 1 0 1 1
13 1 0 0 0
14 1 0 0 0
15 1 0 0 0
V. EXPERIMENTALRESULTSANDDISCUSSION
5.1 Analysis of RA
REPONSE SURFACE REGRESSION:RA VERSUS TON,TOFF&IP
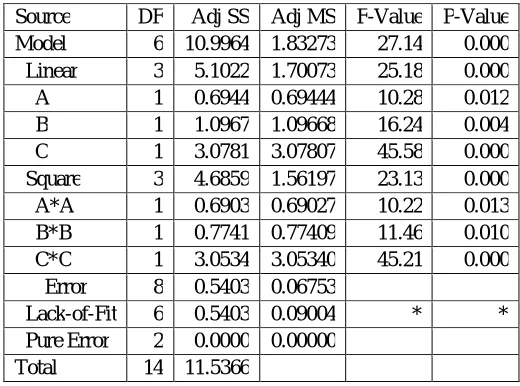
TABLE NO.1.5ANALYSIS OF VARIANCE OF RA
Source DF Adj SS Adj MS F-Value P-Value Model 6 10.9964 1.83273 27.14 0.000 Linear 3 5.1022 1.70073 25.18 0.000 A 1 0.6944 0.69444 10.28 0.012 B 1 1.0967 1.09668 16.24 0.004 C 1 3.0781 3.07807 45.58 0.000 Square 3 4.6859 1.56197 23.13 0.000 A*A 1 0.6903 0.69027 10.22 0.013 B*B 1 0.7741 0.77409 11.46 0.010 C*C 1 3.0534 3.05340 45.21 0.000
Error 8 0.5403 0.06753 Lack-of-Fit 6 0.5403 0.09004 * * Pure Error 2 0.0000 0.00000 Total 14 11.5366
Table No. 1.5 shows contribution of TON, TOFF and IP on surface roughness (RA). It also shows error, lack of fit, pure error and total effect of individual and combine input parameter on RA .
Table No. 1.6 Model Summary
S R-sq R-sq(adj) R-sq(pred) 0.259868 95.32% 91.80% 81.27%
Table No. 1.6 gives model summary of ANVOA of Ra vs TON, TOFF and IP
Table No. 1.7 Coded Coefficients
Term Coef SE Coef T-Value P-Value VIF Constant -261.4 78.6 -3.32 0.010 A 4.16 1.30 3.21 0.012 4993.00 B -0.546 0.136 -4.03 0.004 217.67 C 0.3455 0.0512 6.75 0.000 279.30 A*A -0.01730 0.00541 -3.20 0.013 4993.01 B*B 0.00458 0.00135 3.39 0.010 217.68 C*C -0.001010 0.000150 -6.72 0.000 279.31
Table No. 1.8Fits and Diagnostics for Unusual Observations
Obs RA Fit Resid StdResid
9 2.835 3.290 -0.455 -2.48 R
Table No. 1.8 gives observations for fits and diagnostics
Regression Equation in Uncoded Units
RA = -370 + 0.999 A - 0.0592 B + 0.01190 C - 0.000692 A*A + 0.000046 B*B - 0.000001 C*C
Table demonstrates the ANOVA for RA and it is recommended that the square – linear quadratic model is statically significant for analysis of RA. Table demonstrate the value of R2, adjusted R2and predictedR2is more than 81%. It means the paradigm acquired can be avail for future outgrowth. The difference between adjusted R2and predicted R2is less than 20%.This dissimilarity manifests unimpeachable results. The p-value for the exemplar is lower than 0.05 which indicate that the exemplary apprise to be statically outcome.
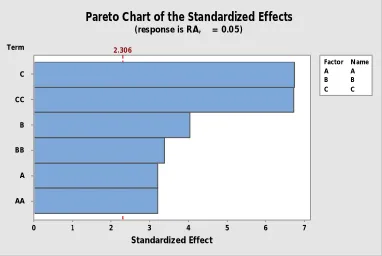
Chart No1.1 Pareto Chart of the Standardized effect on RA
Chart No1.1 Pareto Chart of the Standardized effect on RAaccording the ascending order as IP, TOFF and TON
Chart 1.2 Residual Plots for RA Term AA A BB B CC C 7 6 5 4 3 2 1 0 A A B B C C FactorName Standardized Effect 2.306
Pareto Chart of the Standardized Effects
(response is RA, α = 0.05)
0.50 0.25 0.00 -0.25 -0.50 99 90 50 10 1 Residual P e rc e n t 4 3 2 0.4 0.2 0.0 -0.2 -0.4 Fitted Value R e si d u a l 0.2 0.0 -0.2 -0.4 8 6 4 2 0 Residual F re q u e n cy 15 14 13 12 11 10 9 8 7 6 5 4 3 2 1 0.4 0.2 0.0 -0.2 -0.4 Observation Order R e si d u a l
Normal Probability Plot Versus Fits
Histogram Versus Order
Chart 1.2 Residual Plots for RA shows nature of probability, range of residual and observation order.
(a) (b) (c)
Chart 1.3Surface plot of Surface Roughness (RA)(a) RA vs TON, TOFF, (b) RAvs TON, IP, (c) RAvs TOFF, IP The outcome diversion of pulse on time on RA is exhibit in chart 1.3 (a) it conveys that the pulse on time parameter has undeviating impact accelerate RA but pulse off time decelerate RA. (b) When increasing pulse off and peak current direct attention to astonishing response on RA As exhibit in chart 1.3 (c) when escalate peak current RA amplifies but as the interaction sequel of pulse on testify resistances on aggravate in RA.
VI. CONCLUSION
It is sequitur from ANOVA that prototype is eloquent the value of R2 and adjusted R2 are 95.32%and 91.80% respectively. Hence reproducibility of results is excellent. The quadratic model of RA developed by RSM gives a lot of information with 15 number of experiment by using Box behenan design method. The model developed by RSM were rationally appropriated can be used for the predication of response within given limit of the factor from ANOVA. It is found the pulse on time outgrowth maximum percentage contribution while processing Cryo- treated H13 tool steel as compared to pulse off time and peak current.
REFERENCES
1.Adem and Fuatkara, “Evaluation of machinability of hardened and cryo-treated AISI H13 hot work tool steel with ceramic inserts”,Int. Journal of Refractory Metals and Hard Materials, Vol. 41, pp 461–469 ,2013
2. Amit and rahul“Effect of thermal treatment on the performance of H13 tool steel” International Journal of application or innovation in engineering and management, 6 June 2014
3. MahdiKoneshloua, KavehMeshinchi“Effect of cryogenic treatment on microstructure, mechanical and wear behaviours of AISI H13 hot work tool steel”Cryogenics Vol .21 pages 55–61, 2011
4. Marcos Pérez, Francisco Javier Belzunce, “Materials Science & Engineering” Vol. 624 pp1-306,17 November 2014
5. Harvinder and Goyal“Experimental Investigation of WEDM Variables on Surface Roughness of AISI H13” Manufacturing Science and Technology Vol.1 (2)pp: 23-30, 2013 http://www.hrpub.org DOI: 10.13189/mst.2013.010201
6.Udhya and R.ramkumar“Parametric space optimization of WEDM on AISI H13 TOOL STEELInt Journal of applied engineering research (2015) 7.Pathya and Bobby “ Optimization of recast layer thickness and SR in WEDM process of AISI H13tool steel using taguchi and fuzzy logic “
Laboratory of mech. Process, mech. Dept. Indonesia, 2014 International Journal of Current Engineering and Technology E-ISSN 2277 – 4106, P-ISSN 2347 – 5161 ©2018 INPRESSCO®, All Rights Reserved Available at http://inpressco.com/category/ijcet
5 12 1 0 0 2 2 3 4 4 0 5 115 0 6 A A R B B ,A s v A R f o t ol P e c af r u S 0 6 0 5 2 3
1 04 4 0 6 1 0 4 0 8 1 0 0 2 B A R C C , B s v A R f o t o l P e c a fr u S 5 12 1 0 0 2 2 3 4 1 4 0 6 1 0 8
1 115
8.S. Datta and S. S. Mahapatra, “Modelling, Simulation and Parametric Optimization of Wire EDM Process Using Response Surface Methodology Coupled with Grey-Taguchi Technique”, International Journal of Engineering, Science and Technology,pp 162-183 ,2010.
9. D.N.Collins, “Deep Cryogenic Treatment of Tool Steels : a Review”, Heat Treatment of Metals, Vol.2, pp 40-42 ,1996
10.AhmetHasçalýk, “Experimental study of wire electrical discharge machining of AISI D5 tool steel”, Journal of Materials Processing Technology, Vol.. 148 (2004)pp 362–367, accepted 20 February 2004.
11.D. Khedekar, S.Patil and C.Gogte “Mechanical Characterization of Hardness and Surface Roughness for Cryo Treated 7075 Aluminium Alloy”, ICCASP/ICMMD-2016. Advances inIntelligent Systems Research.The authors - Published by Atlantis Press paper
Vol. 137, Pp. 160-164. © 2017.
12. P.SekharBabu“A Study cryogenic treatment of tool steels to improve wear resistance”in Trans stellar , IJMPERD ISSN2249-6890, VOL 3, , pp131-136 ,Issue 2,June 2013.
13.S.L.C. Ferreia, R.E Bruns “Box Behnken design : An alternative for the optimization of analytical methods”inElsevir ,AnalyticaChimicaActa 597 (2007) 179-186 accepted on 3 July 2007
14.Neeraj Sharma, Ajit Singh, Renu Sharma, Deepak “Modelling the WEDM Process Parameters for Cryogenic Treated D-2 Tool Steel by integrated RSM andGA” titled paper in 12th GLOBAL CONGRESS ON MANUFACTURING AND MANAGEMENT, GCMM 2014 Procedia