University of South Carolina
Scholar Commons
Theses and Dissertations
1-1-2013
Investigating the Predictive Validity of A
Domain-Specific Versus Global Measure of Life Satisfaction
In the Context of School
Rachel Long
University of South Carolina - Columbia
Follow this and additional works at:https://scholarcommons.sc.edu/etd Part of thePsychology Commons
This Open Access Dissertation is brought to you by Scholar Commons. It has been accepted for inclusion in Theses and Dissertations by an authorized
administrator of Scholar Commons. For more information, please [email protected].
Recommended Citation
INVESTIGATING THE PREDICTIVE VALIDITY OF A DOMAIN-SPECIFIC VERSUS GLOBAL MEASURE OF LIFE SATISFACTION IN THE CONTEXT OF
SCHOOL by
Rachel Freeman Long Bachelor of Arts
University of South Carolina, 2007
Master of Arts
University of South Carolina, 2010
Submitted in Partial Fulfillment of the Requirements For the Degree of Doctor of Philosophy in
School Psychology College of Arts and Sciences University of South Carolina
2013 Accepted by:
Eugene S. Huebner, Major Professor Kimberly J. Hills, Committee Member
Richard J. Nagle, Committee Member Mitchell L. Yell, Committee Member
ii
© Copyright by Rachel Freeman Long, 2013
iii
ABSTRACT
This study compared the utility of a global versus a domain-specific measure of life satisfaction in predicting behavioral and achievement outcome variables among a sample of adolescents in the context of school. The sample included 694 middle school students
(7th and 8th grade) from a suburban school district located in the Southeastern United
States who completed self-report measures of life satisfaction, engagement, behavior, and grades. Actual grade point average (GPA) and standardized MAP test scores were
iv
TABLE OF CONTENTS
ABSTRACT ... iii
LIST OF TABLES ...v
CHAPTER 1: INTRODUCTION ...1
CHAPTER 2: METHOD ...21
CHAPTER 3: RESULTS ...32
CHAPTER 4: DISCUSSION ...47
REFERENCES ...56
APPENDIX A: STUDENTS’ LIFE SATISFACTION SCALE (SLSS) ...78
APPENDIX B: MULTIDIMENSIONAL STUDENTS’ LIFE SATISFACTION SCALE (MSLSS) ...79
APPENDIX C: STUDENT ENGAGEMENT INSTRUMENT-FUTURE GOALS AND ASPIRATIONS SCALE (SEI-FG) ...80
APPENDIX D: SCHOOL ENGAGEMENT SCALE-BEHAVIOR SUBSCALE (SEI-B) ...81
v
LIST OF TABLES
Table 3.1. Descriptive statistics for predictor and criterion variables ...40 Table 3.2. Intercorrelations between predictor and criterion variables at T1 and T2 ...41 Table 3.3. Comparisons of magnitude of correlations between global life satisfaction and
school satisfaction domains at T1 and T2 ...42 Table 3.4. Hypothesis 5: Incremental contribution of SS in predicting school related
outcomes at T1 ...43 Table 3.5. Hypothesis 5: Incremental contribution of SS in predicting school related
outcomes at T2 ...44 Table 3.6. Hypothesis 6: Incremental contribution of global LS in predicting school
related outcomes at T1 ...45 Table 3.7 Hypothesis 6: Incremental contribution of global LS in predicting school
1
CHAPTER 1
INTRODUCTION
Our understanding of the nature and structure of psychological well-being has been steadily evolving over the past several decades. Historically, the field of psychology has taken a deficit-based approach to psychological functioning and has been heavily focused on negative states; psychological well-being has been viewed as the mere absence of psychopathology. At the same time, interventions have been directed primarily towards repairing those weaknesses. This has also extended to the school setting where educators have sought to define “good students” as those who are free from academic deficits and behavioral problems. However, professionals across the disciplines of education and psychology have acknowledged that a deficit-based approach, in and of itself, is insufficient to explicate the complexity of human functioning (e.g., C NYD, 2001; Department of Education and Early Childhood Development, 2011; Hoyt, 1996; Huebner & Gilman, 2003; Kaplan, 1999; Kretzman & McKnight, 1993; Rhee, Furlong, Turner & Harari, 2001; Rutter 1990). This has led to an increased interest in the research and application of approaches that emphasize the promotion of positive well-being among children and adolescents.
2
thinking (Terjeson, Jacofsky, Froh, & DiGiuseppe, 2004). Positive psychology seeks tobalance the historical foci on negative indicators, pathology and dysfunction with positive indicators of well-being and strengths (Seligman & Csikszentmihalyi, 2000). Not only does positive psychology seek to understand what helps people thrive and flourish, but also what aspects of institutions and communities, such as schools, help them experience the best in life (Lopez, Snyder, & Rasmussen, 2003; Seligman & Csikszentmihalyi, 2000).
As our conceptualization of psychological functioning expands, researchers are presented with the challenge of developing measures that accommodate its conceptual evolution. As such, there is a need for well-validated approaches to the measurement of psychological well-being that blend the identification of negative states with those that are strengths-based and focused on identifying facets of human flourishing, and that are developmentally appropriate for use with different populations and age groups, including children and adolescents. In addition, such measures should demonstrate utility in treatment planning and outcome assessment in a range of different settings, including the school setting. As such, a major tenet of the current study is to contribute to this gap in research by investigating the predictive validity of measurement instruments designed to assess psychological well-being specifically in the context of school.
3
components that comprise SWB, there is no overall consensus as to what the concept actually means, how it should be defined and in what manner the indicators should be constructed (Man, 1991). Diener et al. (1999) proposed a model of SWB which has been well researched and established in the literature (e.g., see Busseri & Sadava, 2011 for a review). It posits that SWB is comprised of three components: the frequency with which people experience positive emotions (e.g., joy, interest), the infrequency with which they experience negative emotions (e.g., depression, fear) and life satisfaction (LS), which is an overall cognitive appraisal of the quality of one’s life (Diener et al., 1999) over and above judgments of specific domains (e.g., family, friends) (Huebner, 1991a). Although not orthogonal, the components have been demonstrated to be distinct in adults and children (Diener et al., 1999; Huebner, 1991c; McCullough, Huebner, & Laughlin, 2000) suggesting that each component adds its own unique variance to the overarching
construct. Life Satisfaction
4
Larsen, & Griffin, 1985; Frisch, 1999; Shin & Johnson, 1978). Whereas, objective indicators (e.g., socioeconomic status, neighborhood characteristics) of well-being have been found to contribute to the quality of one’s life, positive reports of perceived LS has been identified as a necessary, though not sufficient, component of positive mental health (Diener et al., 1999). Whereas LS reflects both objective life circumstances and the subjective perception of these, it is considered to be a construct worthy of investigation in and of itself, and is often a central focus of studies investigating well-being. Similarly, adolescent LS is the focus of the current study, and specifically in the context of school.
Conceptual Models of LS. Measures of LS are typically derived from two
conceptual models or frameworks: unidimensional (i.e., global and general LS) and multidimensional (Huebner, 2004). Measures representative of unidimensional models present an overall total score to indicate one’s level of LS (Proctor, Linley, & Maltby, 2009) while multidimensional measures provide a profile of LS scores calculated for each domain (Huebner, 2004). The two unidimensional models differ in that for the global model, the total score is derived from items that are free of a situational or contextual frame of reference (e.g., I have a good life). This presses the respondent to integrate their satisfaction with life domains by combining aspects of the situation as he or she normally would (Ironson, 1989), according to his or her own unique criteria (Pavot & Diener, 1993). In doing so, different values or “weights” may be assigned to different domains, thereby influencing overall LS (e.g., Diener et al., 1985; Van Praag, Frifters, & Ferrer-i-Carbonell, 2002; Wu & Yao, 2006a). In contrast, the general model of LS is
5
predetermined by the researcher, and considered crucial to the contribution of overall LS (Beatty & Tuch, 1997; Gilman & Huebner, 2000; Huebner, 2004; Mookherjee, 1992).
Although both unidimensional measures use a single score to represent LS, research suggests that both personal and environmental variables may serve to
differentially influence satisfaction judgments in various life domains (Gilman, Huebner, & Laughlin, 2000; Huebner, 1994). As such, multidimensional models represent LS as a profile of satisfaction judgments across multiple domains of life (Proctor et al., 2009). Multidimensional scales consist of items that provide the respondent with a
situational/contextual frame of reference, thereby restricting their evaluation to only events and judgments associated with a particular domain (e.g., School is interesting, I like being in school, I learn a lot in school). The restriction is thought to reduce the
influence of heuristics by diminishing the level of abstract thinking required to answer the question (Schwarz & Strack, 1999; Schwarz, Strack, Kommer, & Wagner, 1987). Unlike unidimensional models, the domain specific scores are not combined in a weighted fashion to represent one’s satisfaction with life as a whole; rather, the various domain scores are considered independently, providing distinct measures of the domains of interest (Antaramian, Huebner, & Valois, 2008). This approach enables the respondent to report high levels of LS in one domain and low levels of LS in another, thereby
potentially yielding more differentiated information (Gilman & Huebner, 2003; Shaffer, 2006).
6
concluded that higher levels of LS were related to occupational success, positive mental and physical health, and satisfying interpersonal relationships. Research indicates that people who report high levels of LS also perceive the world as safer, feel more confident, make decisions more easily, rate job applicants more favorably and are more cooperative, creative, tolerant, and altruistic (Lyubomirsky et al., 2005; Cohen & Pressman, 2006).
Similarly, lower levels of LS have been related to a variety of negative life outcomes including psychiatric morbidity (Koivumaa-Honkanen, 1998), depressive symptoms (Koivumaa-Honkanen, Kaprio, Honkanen, Viinamaki, & Koskenvuo, 2004), total mortality (Koivumaa-Honkanen, Kaprio, & Koskenvuo, 2000), suicide throughout a 20-year follow-up period (Koivumaa-Honkanen, Honkanen, Viinamaki, Heikkila,
Kaprio, & Koskenvuo, 2001), fatal unintentional injury deaths (Koivumaa-Honkanen, Honkanen, Koskenvuo, Viinamaki, & Kaprio, 2002) and premature work disability due to somatic and psychiatric causes (Koivumaa-Honkanen et al., 2004) in follow-ups of over a decade.
7
al., 2004). Findings in the field of neuroscience have demonstrated strong correlations between LS reports and objective measures of positive or negative brain activity (Layard, 2003; Urry et al., 2004).
In contrast to the adult literature, there is substantially less research investigating the construct of LS among younger populations. Whereas nearly one-third of the world’s population is below the age of 15, little is known about what affects their well-being (Carlson, Lampi, Li, & Martinsson, 2011). This has been due, in part, to the lack of measures appropriate for younger populations. However, over the past few decades, there has been an increased focus in the literature on the state of children and adolescents and the importance of their well-being and satisfaction with life (e.g., Ben-Arieh, 2000; Huebner & Colleagues) which has resulted in the development of a number of measures appropriate for screening and research purposes in children ages eight and above (Gilman & Huebner, 2000). At the same time, the era of educational accountability has yielded concomitant federal legislation (No Child Left Behind Act, 2002; IDEA, 2004)
highlighting the role of social and emotional functioning in academic performance and successful school experiences.
Life satisfaction is one such social-emotional functioning variable (Suldo, Riley,
& Shaffer, 2006). In fact, several key links between LS and school-related variables have been indicated in the research to date (e.g., see for a review, Gilman & Huebner, 2003; Proctor et al., 2009; Suldo et al., 2006). This suggests the benefit of adding valid measures of LS to psychological and educational evaluations to develop a more
domain-8
based LS, specifically school satisfaction. The following sections provide a review of the cross-sectional and longitudinal correlates of LS and school satisfaction, focusing on key facets of school-related variables (e.g., behavior, achievement, engagement, and social relationships).
Internalizing and Externalizing Behavior.Similar to findings with adults, global LS has proven to be an important construct for child and adolescent well-being and has been associated with a host of positive school-related outcomes. LS serves as a key indicator of positive development and a broad enabling factor that promotes positive social, emotional and psychological functioning (You et al., 2008), and the maintenance of optimal health (Park, 2004). Research demonstrates that high LS functions as a
protective factor that buffers against the effects of significant, stressful life events (Suldo & Huebner, 2004). This may be especially beneficial during adolescence, a
developmental period often characterized by a variety of unique stressors (e.g., academic pressures, increasing independence from parents) (Gilman & Huebner, 2003) and a time when youth often report feelings of alienation, disenfranchisement and dissatisfaction (Larson, 2000).
Higher LS is positively associated with important facets of positive mental
9
compared students reporting very high and very low levels of LS on measures of internalizing and externalizing behaviors. Among students reporting very low LS, 23% also reported clinical levels of internalizing behaviors and 13% reported clinical levels of externalizing behaviors. In contrast, none of the students reporting very high LS reported clinical levels of externalizing or internalizing behaviors.
Research finds low global LS to predict future externalizing and internalizing behaviors among adolescents (Haranin, Huebner, & Suldo, 2007; Huebner & Alderman, 1993; Huebner, Funk, & Gilman, 2000; Suldo & Huebner, 2004a, 2004b; Zimmerman, Salem, & Maton, 1995), including increased symptoms of anxiety and depression (Huebner et al., 2006; Suldo & Huebner, 2006). In fact, Haranin, et al. (2007) found that low scores on two different LS measures (MSLSS; SLSS) significantly predicted the presence of internalizing and externalizing behaviors across a three-year time span. Other symptoms associated with decreased adolescent LS include loneliness, insomnia,
emotional disturbance and suicide-related behaviors (Valois, Zullig, Huebner, & Drane, 2004).
cross-10
sectionally to behavioral, cognitive, and emotional disengagement in school, and also related longitudinally to cognitive engagement. These findings are important because a high level of student engagement has been related to important student academic
outcomes (e.g., GPA) (Lewis et al., 2011; Lewis, Huebner, Reschly, & Valois, 2009), and considered to be an important outcome in and of itself (Furlong, et al., 2003).
Risk-taking behaviors. Many adolescents have difficulties dealing with the
changes and demands that develop during this period of development, and thus it is not uncommon for adolescents to experience a decrease in LS during this tumultuous stage of life (Suldo & Huebner, 2004). This situation can be further complicated by a lack of well-developed coping strategies and problem-solving skills. As a result, adolescents with low LS may choose to engage in high-risk behaviors that may impact schooling in an effort to improve their satisfaction with life (Zullig, Valois, Huebner, Oeltmann, & Drane, 2001). Illegal substance abuse (e.g., cocaine, marijuana, nicotine, steroids and binge drinking) and an earlier onset of first use (i.e., age 13 or younger) (Newcomb, Bentler, & Collins, 1986; Raphael, Rukholm, Brown, Hill-Bailey, & Donato, 1996; Zullig et al., 2001), physical fighting, aggression, violence, delinquency, carrying a weapon to school (MacDonald, Piquero, Valois, & Zullig, 2005; Suldo & Huebner, 2006; Valois, Zullig, Huebner, & Drane, 2001), sexual risk-taking behaviors (e.g., having unprotected intercourse and an earlier age of first intercourse) (Valois, 2002) and suicide ideation (Thatcher, Reininger, & Drane, 2002; Valois et al., 2004) are all risk-taking behaviors that have been significantly and positively associated with low adolescent LS.
11
adolescent LS. Illegal substance use increases as adolescent LS decreases (Zimmerman et al., 1995; Zullig et al., 2001).
Academic Achievement.Achievement outcomes and their relationship to global LS have been investigated using both objective (i.e., school-reported GPA, standardized academic achievement test scores) and subjective (i.e., self-reported grades, I am doing well in school) outcome measures. Zero-order correlations from these studies range from
modest to moderate. Among these studies, LS was most strongly associated with subjective measures of achievement; similar findings have been demonstrated among students from both the USA (Gilman & Huebner, 2006) and the United Kingdom (Proctor et al., 2010). In terms of objective measures of achievement, a number of studies have demonstrated positive, concurrent relationships between school grades and global LS among students from the USA (Huebner & Gilman, 2006; Suldo, Shaffer, & Riley, 2008) and the United Kingdom (Cheng & Furnham, 2002); however, other studies have found non-significant relationships (e.g., Huebner, 1991b).
Utility of contextualized approach. Most studies of LS among children and
adolescents have investigated the predictors and correlates of global evaluations of LS. However, recent studies have begun to investigate the utility and meaningfulness of a more contextualized approach, although the multidimensional nature of LS is not a new concept. For example, an earlier study conducted by Huebner (1994) demonstrated the ability of youth, as young as eight years old, to distinguish among specific domains in their lives (i.e., family, friends, school, living environment, self).
12
indicators of LS. For example, in a study investigating the relationship between family structure and optimal adolescent functioning, Antaramian et al. (2008) found effects of differing family structures (intact vs. non-intact) on measures of satisfaction with family and living environment, but not on measures of general LS. This finding suggests that general LS scores may, at times, mask important relationships. As such, the use of multidimensional instruments may allow for greater sensitivity to differences in specific domains that may not be fully understood through summary reports (Gilman, 2003). Nevertheless, little research has investigated the possible differential validity of global versus domain-based reports of LS.
The aforementioned studies support the importance of further evaluating the utility of context-specific measurement of LS. Other studies have extended this idea, demonstrating the presence of dimensions of adolescent LS unique to the context. A number of studies have demonstrated a moderate to strong relationship between global LS and various important domains (Huebner, Gilman, & Laughlin, 1999; Kozma, Stone, & Stones, 2000; Schwarz, Strack, & Mai, 1991). Of particular interest to the current study is the domain of school. Most studies in the extant literature have indicated only a moderate relationship between SS and global LS (e.g., Huebner, 1991b; Seligson, Huebner, & Valois, 2003; Suldo et al., 2008), suggesting the separability of the
13
live (Baker et al., 2003; Long et al., 2012; Masten & Coatsworth, 1998), with one of those important environmental contexts being that of the school.
School Satisfaction.
Schooling is a primary activity in childhood and adolescence. Students spend a
large portion of their time in school – the typicalstudent spends approximately 1,180
hours a year in school (U.S. Department ofEducation 2005a); thus one of the most
important extra-familial environments in adolescence may be school (Cohen & Cohen, 1996). SS has been compared to job satisfaction among adults in many respects; thus SS is important in and of itself (Huebner, Ash, & Laughlin, 2001). Similar to the job setting for an adult, the school is the single out-of-family environment where a major portion of time is spent (Epstein & McPartland, 1976). In addition, success in both settings is facilitated by commitment to tasks, positive relations with authority figures and daily mental health (Epstein & McPartland, 1976). Due to the amount of time spent in the
school setting, students’perceptions, or cognitive evaluations of their satisfaction with
their school lives (i.e., SS) (Huebner, 1994), are thought to potentially impact their school functioning, including behavioral and academic performance (DeSantis-King, Huebner,
Suldo, & Valois, 2006; Huebner & Gilman, 2006), perhaps moderated by theimportance
of schooling in a given culture (Park & Huebner, 2005).
Research on the SS of children and adolescents has been increasing during the past few years, but remains sparse. Findings related to key school-related correlates of students’ SS are summarized below.
Internalizing and externalizing behavior. Studies have shown important linkages
14
and drop-out) as well as current and future symptoms of psychopathology (e.g.,
depression, suicidality and psychosomatic complaints) (e.g., Ainley, Foreman, & Sheret, 1991; Locke & Newcomb, 2004; Natvig, Albreksten, Anderssen, & Qvarnstrom, 1999; Reyes & Jason, 1993). In one study, Eamon (2002) found that students who were more satisfied with school exhibited fewer current symptoms of depression while another study
found that adolescents with higher levels of SS had less suicide ideation as adults(Locke
& Newcomb, 2004). SS has also been associated with rebellion at school and adolescent problem drinking (Treiman & Beck, 1996), and has been shown to predict future
behavior related to drug and alcohol abuse (Newcomb & Bentler, 1987), with more satisfied students engaging in less substance abuse in adulthood (Locke & Newcomb, 2004).
Academic Achievement. There is a dearth of research examining the relationship
15
difference in reports of SS among a sample of gifted and average middle school students. Furthermore, Epstein and McPartland (1976) found that students who had high report card grades and low achievement were more satisfied with school than students who had low report card grades and high achievement.
Both LS and SS appear to be related to a variety of important student school-related variables, such as interpersonal behaviors, risk-taking behaviors, school
engagement, academic performance and mental health. Nevertheless, it remains unclear as to whether LS or SS may be the better predictor of important school-related variables. The current study sought to add clarity to this issue by comparing the predictive validity of two such measures across two different adolescent samples. The theoretical framework for the hypotheses of the current study was developed in light of findings in the attitude and trait literature, particularly as related to the study of the self-concept and self-esteem. The following section provides a discussion of the theoretical underpinnings related to the current measurement study.
Specificity Matching. The conceptualization of LS (unidimensional versus
multidimensional) has clear implications for how its consequences should be assessed. This point is related to insight garnered from research in the trait and attitude literature
involving the specificity matching principle.The principle posits that there are multiple
factors, other than the predictor variable of interest, which are present in natural settings and may serve as rivals in influencing (i.e. mediating or moderating) the
16
measures (e.g., math self-concept) should be used to predict domain-specific outcomes (e.g., math grades) and global measures (e.g., global self-esteem) should be used to predict global outcomes (e.g., depression) (Swann, et al., 2007). Furthermore, different levels of analysis (global and domain-specific) should associate differently with
convergent and divergent constructs, depending on the level of the construct of interest (Carver & Scheier, 2001).
Relationships between specificity matching and increased predictive validity of measurement instruments have been demonstrated in studies investigating the importance of self-views (e.g., self-concept, self-esteem), and particularly in studies employing a construct validity approach (Pajares, 1996). A number of studies have found substantial relationships between academic self-concept and various relevant academic outcomes (e.g., academic achievement), but not for global self-esteem and non-academic components of self-concept (e.g., physical appearance, physical ability, parent
relationships and peer relationship self concepts) (e.g., Byrne, 1996a; Marsh, 1993a; see also Marsh & Craven, 2006 for a review), demonstrating the importance of content specificity of variables of interest in fully understanding the nature of self-concept (Marsh, 1992).
As a specific example, Marsh, Trautwein, Ludtke, Köller, and Baumert (2006) investigated the predictive validity of multiple dimensions of self-concept, including a global measure of self-esteem, in relation to nine different academic outcomes
17
mathematics, German, or English). Results found that global self-esteem was nearly uncorrelated with the nine academic outcomes, but there were large and systematic patterns of relations between domain specific self-concepts (math, German, and English self-concepts) and corresponding, relevant outcomes, including grades.
Statement of the Problem
Although the study of adolescent LS (both global and domain specific) and schooling has only recently been undertaken (over the last two decades) (Suldo, Huebner, Freidrich & Gilman, 2009), important insights into these relationships have been
garnered (and continue to amass), though they are still not fully understood. The
literature indicates modest to moderate relationships between global measures of LS and school-related variables though findings have been mixed, especially in the area of academic achievement. SS has also been linked to school-related variables, though studies investigating SS and school performance have been more limited than studies of global LS. In fact, few studies to date have examined the relationships between
adolescent’s academic abilities and their SS (Suldo et al., 2006). Clearly, more research is needed that further investigates and clarifies the strength and significance of the
relationships between global LS, SS, and school-related variables, and to determine which construct may be the better predictor.
Purpose of Study. The current study draws on insight garnered from the
18
& Russell, 1993). As such, when comparing the measurement benefits of different
instruments (that measure similar constructs), researchers can benefit from examining the degree to which the different instruments produce results consistent with the nomological network (Cronbach & Meehl, 1955) that encompasses the construct being measured (Messick, 1989).
Although a number of self-report instruments have been developed to assess LS among children and adolescents (Proctor et al., 2009), researchers and practitioners face a critical decision when choosing a LS measure because the choice of instrument will have implications for the validity, interpretation, and generalizability of results (Flett &
Hewitt, 2002). The choice of instrument seems especially important in studies examining the relationship between LS and school-related outcomes because researchers and
practitioners are often faced with choosing measures in the context of limited time and resources. Given limited resources, it is important to evaluate both the feasibility and the utility of a measure. Therefore, the purpose of the current study was to directly compare the concurrent and predictive utility of using a domain based (i.e. contextualized) versus global (i.e., context-free) measure of LS in the school setting. In view of previous work, the following hypotheses will be tested:
19
2. Global LS will also be significantly, positively related to standardized MAP scores for language, math and science.
Hypothesis 2: SS will be significantly, positively related to the criterion variables of self-reported grades, school-reported GPA, and measures of cognitive and behavioral engagement, and significantly, negatively associated with measures of school-related internalizing and externalizing behaviors at Time 1 and Time 2. SS will also be significantly, positively related to standardized MAP scores for language, math and science.
Hypothesis 3: SS will be more strongly related than global LS to the criterion variables of self-reported grades, school-reported GPA, measures of cognitive and behavioral engagement, and measures of school-related internalizing and externalizing behaviors at Time 1 and Time 2. SS will also be more strongly related than global LS to standardized MAP scores for language, math and science.
20
Hypothesis 5: Global LS will not add significant variance above and beyond SS in the prediction of self-reported grades, school-reported GPA,
21
CHAPTER 2
METHOD
Participants
The dataset analyzed in the current study was collected from students at a large middle school in a suburban school district in the Southeastern United States by school administrative personnel during the Fall of 2008 (T1) and the Spring of 2009 (T2) as part of a school-wide longitudinal survey of student engagement and well-being. Of the 1025 students recruited to participate at T1, 12 parents denied consent, 1 teacher failed to participate (N = 25) and 79 students were absent on the day of the survey administration removing these students from the participant pool. The final sample included 864
students (84%) of the total school population.
The student sample for T1 (N = 864) ranged from 7th (50.7%) to 8th (49.3%) grade with a
mean age of 12.68 (SD = .67). Of the participants, 396 (45.8%) were male and 455 (52.7%) were female. A total of 1.5% did not report their gender. The majority of
22
Concerning family status, 63.3% of students lived with their biological mother and father, 19.5% lived in single parent homes, 16.0% of students lived with another combinations of adults, and 1.2% of students did not report their family status.
During the T2 administration, students from 7th grade (N = 405) and 8th grade
(N = 375) (an 85% return sample), age 11 to 15 (M = 13.01, SD = .75) completed survey questionnaires. Of the participants, 366 (46.9%) were male and 414 (53.1%) were female. The majority of students identified themselves as Caucasian (59.4%) or African
American (28.3%), 3.1% identified themselves as Asian American or Pacific Islander, 2.1% identified themselves as Hispanic or Latino, 0.6% identified themselves as Native American or Indian and 6.5% identified themselves as “other”. Free and reduced lunch (self-reported) was used as an estimate of socio-economic status. Of the student sample, 20.3% reported that they received free or reduced lunch; 4.7% did not indicate whether or not they received free or reduced lunch. Concerning family status, 63.6% of students lived with their biological mother and father, 18.8% lived in single-parent homes, 16.8% of students lived with another combinations of adults, and 0.8% of students did not report their family status.
A series of chi-square tests between the student characteristics of the longitudinal sample and the participants lost to attrition was conducted to test for potential effects of sample attrition. First, chi-square tests compared demographic characteristics of T1 participants (N = 864) to those subjects remaining at T2 (N = 780). There was no
association between administration time and ethnicity (2
(1) = .24, p >.05) or time and
gender (2
23
demographic variables. There was a statistically significant association found for parental status (χ2 (1) = 8.60, p < .01) and SES (χ2 (1) = 8.56, p < .01). These results indicate that students who withdrew from the longitudinal sample were less likely to be living with their mother and father, and less likely to be of a lower SES than those students who remained in the study at Time 1 and Time 2.
Next, differences in global LS, SS, behavioral engagement, cognitive
engagement, internalizing behavior and externalizing behavior, self-reported grades and school-reported GPA were analyzed using independent-samples t tests. These analyses indicated that participants who remained in the study across time (N = 780) and students lost to attrition (N = 84) did not significantly differ on mean levels for SS: t (809) = -1.99, p =.05, cognitive engagement: t (815) = -1.81, p = .07, internalizing behavior: t (784) =
24
A significant difference was also found for mean levels of self-reported grades, t (832) = 2.81, p = .00, d = 0.33, with students lost to attrition reporting lower grades (M = 2.03, SD = .83) than students who remained in the study across time (M = 1.76, SD = .79). A significant difference was found for mean levels of school-reported GPA as well, t (862) = -4.96, p = .00, d = -0.53l with students lost to attrition having lower GPA’s (M =
2.64, SD = .89) than students who remained in the study across time (M = 3.08, SD = .76). In terms of standardized test scores, a significant difference was found for mean scores on the MAP standardized test for math, t (809) = -4.56, p = .00, d = -0.51, with students lost to attrition scoring lower (M = 63.32, SD = 26.10) than students who
remained in the study across time (M = 75.54, SD = 21.96). A significant difference was found for mean scores on the MAP standardized test for science, t (811) = -3.37, p = .00, d = -0.38 with students lost to attrition scoring lower (M = 55.54, SD = 30.05) than did
students who remained in the study across time (M = 66.11, SD = 25.62). Finally, a significant difference was found for mean scores on the MAP standardized test for language, t (726) = -2.99, p = .00, d = -0.36 with students lost to attrition scoring lower (M = 57.36, SD = 28.79) than did students who remained in the study across time (M = 67.25, SD = 25.27).
25 Measures
The Multidimensional Students’ Life Satisfaction Scale (MSLSS; Huebner, 1994; Huebner et al., 1998) was designed to provide a multidimensional profile of child and adolescent LS judgments. The MSLSS is a 40-item self-report scale which measures the overall LS of children and adolescents in important life domains including family,
friends, school, self and living environment. Each item is rated on a 4-point scale ranging from 1 = never to 4 = almost always to indicate the extent to which the respondent has felt this way in the indicated time frame.
The MSLSS has also been shown to have favorable psychometric properties including high internal consistency (Dew & Huebner, 1994; Greenspoon & Saklofske, 1997; Huebner, 1994; Huebner, et al., 1998), factorial validity, and temporal stability (Dew, 1996; Huebner et al., 1997; Terry & Huebner, 1995). Convergent and discriminant validity have also been demonstrated through predicted correlations with other self-report well-being indexes (Gilman et al., 2000; Greenspoon & Saklofske, 1997; Huebner, 1994; Huebner et al., 1998), parent reports (Dew & Huebner, 1994; Gilman & Huebner, 1997), and social desirability scales (Huebner et al., 1998).
For the purposes of this study, only the School subscale of the MSLSS was used. The School subscale was designed for students in grades three through twelve and consists of five items that measure students’ overall satisfaction with school related experiences. The responses are rated on a 6-point Likert scale ranging from 1 = strongly agree to 6 = strongly disagree. The reliability of the School subscale has been shown to
26
has been shown to demonstrate concurrent validity with other self-report measures of satisfaction with school experiences (Huebner, 1994). In a study of preadolescent
students, the School subscale correlated 0.68 with the Quality of School Life Scale (QSL; Epstein & McPartland, 1976). The reliability of the measure for this sample was .89 at T1 and .90 at T2.
The Students’ Life Satisfaction Scale (SLSS; Huebner, 1991b) was designed to provide an overall picture of satisfaction with life among children (Huebner, 1991b) and adolescents (Suldo & Shaffer, 2008). The SLSS is a 7-item self-report scale that
measures the general evaluations of children and adolescents regarding life as a whole rather than in specific domains (e.g., school, family). Each item is rated on a 6-point Likert scale ranging from 1 = strongly disagree to 6 = strongly agree with higher ratings indicating higher levels of global LS.
The SLSS has been demonstrated as a reliable and valid measure for use with students in elementary, middle, and high school (for a review, see Bender, 1997). The SLSS has been shown to possess high internal consistency, yielding coefficient alphas ranging from .82 to .89 (e.g., Antaramian, 2010; Gilman & Huebner, 1997; Huebner, 1991b). In this study, the coefficient alpha was .83 for the total sample at T1 and .86 at T2. High test-retest reliability has been demonstrated among early adolescents over a 2 week period (r = .74; Terry & Huebner, 1995), a 4 week period (r = .64; Huebner, 1991b) and over a 1 year period (r =.53) among a sample of high school students, demonstrating stability among late adolescence (Suldo & Huebner, 2004). The SLSS has also
27
Huebner, 1997), and teacher ratings of classroom behavior problems (Huebner & Alderman, 1993).
Cognitive Engagement. The Future Aspirations and Goals subscale of the Student
Engagement Instrument (SEI: Appleton, Christenson, Kim, & Reschly, 2006) was used to
assess students’ cognitive engagement. The SEI is a 35-item self-report measure designed to assess various facets of student engagement, including cognitive engagement. The Future Aspirations and Goals subscale consists of 5-items asking about school’s importance for students’ future and their desire to continue their education after high school (i.e. School is important for achieving my future goals). Each item is rated on a 4-point scale ranging from 1 = strongly agree to 4 = strongly disagree, with higher ratings indicating higher levels of cognitive engagement in school.
The Future Aspirations and Goals subscale has been found to be a reliable and valid measure of cognitive engagement among adolescents. It has been shown to possess adequate internal consistency (α = .78) (Appleton et al., 2006). In this study, the
coefficient alpha was .80 for the total sample at T1 and .87 at T2. The Future Aspirations and Goals subscale has also demonstrated convergent validity through positive
correlations with GPA and standardized test performance and negative correlations with school suspensions (Appleton, 2006).
Behavioral Engagement. Students’ behavioral engagement was assessed by the
Behavior subscale of the School Engagement Scale (SES-B; Fredricks, Blumenfeld,
28
of the time, with higher ratings indicating higher levels of behavioral engagement in
school. For the purposes of the current study, only four of the five subscale items were used. The item, When I am in class, I just act as if I am working, was demonstrated during pilot testing to lower the internal consistency of the measure because it was frequently misunderstood by respondents. The removal of this item increased the alpha coefficient of the subscale from .61 to .70.
The Behavior subscale has been found to be a reliable and valid measure of behavioral engagement. It has been shown to possess good internal consistency, with coefficient alphas ranging from .72 to .77 in prior research (Fredricks et al., 2005). The Behavior subscale has also demonstrated convergent validity through positive
correlations with other school-related attitudes and behaviors (e.g., work orientation, task challenge, school attachment and perceptions of school value) and teacher’s reports of student behavior (Fredricks et al., 2005). In this study, the coefficient alpha was .74 for the total sample at T1 and .78 at T2.
29
For the purposes of the current study, only the Internalizing and Externalizing subscales of the SRCS were used. The Externalizing subscale consists of 5 items that measure how often one focuses efforts on venting negative emotions (e.g., such as getting
mad and throwing or hitting things) in response to stressful life events. Alternatively, the
Internalizing subscale consists of 7 items that measure how often one manages negative
emotional reactions to stressful life events by directing them inward (e.g., becoming so
upset that one cannot talk to anyone). Responses to both subscales are rated on a 5-point
Likert scale ranging from 1 = never to 6 = always.
The SRCS is a widely used measure of coping responses among children and adolescents that has demonstrated adequate reliability and validity. The Internalizing and
Externalizing subscales have demonstrated internal consistency reliabilities ranging from
.66 to .76 in previous studies (Causey & Dubow, 1992; Roecker-Phelps, 2001). Internal
consistency reliabilities for the current study were .75 and .80 for Internalizing at T1 and
T2, respectively, and .72 and .78 for Externalizing at T1 and T2, respectively. Adequate
test-retest reliabilities ranging from .59 to .78 for both subscales has been demonstrated
across a 2- week period (Causey & Dubow, 1992). The two subscales have also demonstrated predictive relationships with measures of self-reported anxiety and behavioral conduct problems (Causey & Dubow, 1992).
Academic Achievement: Self-Reported Grades. In the current study, academic
30
Academic Achievement: School-Reported Actual Grade Point Average (GPA). At
the time of survey administration, student’s cumulative GPAs were obtained from school records. In order to calculate a student’s cumulative GPA, numerical values were
assigned to letter grades earned for academic performance. Letter grades of A, B, C, D, and F were converted to numerical scores of 4, 3, 2, 1, and 0, respectively. The values were then summed and the scores were averaged across all classes.
Academic Achievement—Standardized Achievement Test Scores. Standardized
achievement test scores were usedas additional measures of students’ academic
achievement. TheMeasures of Academic Progress (MAP) is a computerizedassessment
system that measures academic progress in readingand language usage, mathematics,
and science. All students inthe participating schools completed MAP testing in the fall
and spring of T1 and T2 administration. MAP tests yield numerical RIT scores that
indicatestudents’ level of achievement in each subject area (NorthwestEvaluation
Association, n.d.). Students’ scores on fall MAPtesting were obtained from school
records. Procedures
The data for this study involved archival data provided by a public middle school. A passive consent procedure was used by the school in which parents were given the opportunity to deny permission for their children to participate in the school-wide survey. Regular classroom teachers administered the pencil and paper measures during
31
students answered a brief series of demographic questions regarding their age, grade, gender, race, and family structure. School-reported lunch status (free or reduced lunch) was used as a measure of student SES. Prior to providing access to the data, all student names were removed from the surveys and replaced with numerical codes to ensure student confidentiality.
Data Analysis Plan. The statistical analysis was carried out using SPSS, version
19.0. To address the proposed research questions, initial descriptive statistics were
computed to examine the central tendencies, variability, and distributional qualities of the variables of interest. Subsequently, zero-order correlations were calculated to determine the level and direction of relationship between constructs. Correlations were also
examined to determine whether demographic variables would be included in subsequent regression analyses. The interpretation of the correlation coefficient was considered according to Burns and Grove (1997); a correlation coefficient of 0.3 to 0.5 showed a moderate linear relationship and above a 0.5 a strong linear relationship. Finally, two sets of hierarchical regression analyses were conducted to examine the incremental
32
CHAPTER 3
RESULTS
Missing Data. Participants who had completed less than 75% of one or more
subscale were removed from the dataset and excluded from subsequent analyses. A total of 86 students (9.0%) were removed based on this criterion for excessive missing data. It is unknown as to what accounts for this lack of completion due to the fact that this was archival data, and teachers not affiliated with this study administered the measures. For participants who had completed at least 75% of each subscale, expectation maximization (EM; Dempster, Laird, & Rubin, 1977), a maximum likelihood approach, was used to estimate missing scores for descriptive analyses; expectation maximization is a standard missing data imputation strategy demonstrated in the literature to provide “unbiased and efficient” parameters (Graham et al., 2003, p. 94). Accordingly, EM was considered to be an appropriate method for addressing missing data in the present study. The percentage of participants needing this data substitution procedure ranged from 0.3% to 2.5% for the various subscales. Prior research suggests that the specific technique used to handle missing data is inconsequential when the amount of missing data is low as biases and loss of power are both likely to be inconsequential (Buhi, Goodson, & Neilands, 2008;
Graham, 2009; Roth, 1994; Schafer, 1999).
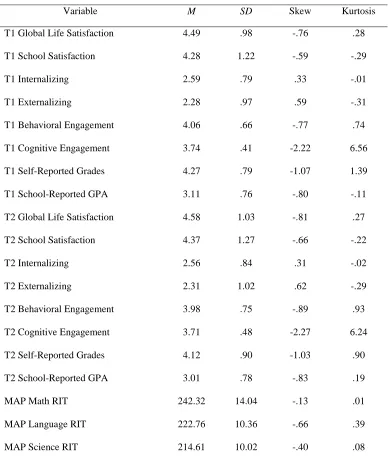
Descriptive Statistics. Table 1 displays the means and standard deviations for all
33
.98; T2 M = 4.58, SD = 1.03) indicate a mild to moderate degree of global LS among students in the current sample. These scores are similar to levels reported in previous research with middle school students (Suldo & Huebner, 2004). The mean scores on the School Satisfaction subscale (T1 M = 4.28, SD = 1.22; T2 M = 4.37, SD =1.27) indicate a mild to moderate degree of SS among participants in the current sample; these scores are higher than levels reported in previous research (Gilman et al, 2000; Huebner, 1994; Huebner et al., 2001). The mean scores on the Behavioral Engagement scale (T1 M = 4.06, SD = .66; T2 M = 3.98, SD = .75) indicate that students are “sometimes” to “often” behaviorally engaged with school, which is similar to levels reported in previous research
with 3rd to 5th grade students (Fredricks et al., 2005). The mean scores on the Future
Goals and Aspirations scale (T1 M = 3.74, SD = .41; T2 M = 3.71, SD = .48) indicate that students tend to “agree” that school is important for their future aspirations, which is similar to findings reported in previous research with adolescents (Reschly, Huebner, Appleton, & Antaramian, 2008). Overall, mean levels of behavioral and cognitive engagement, and internalizing behavior decreased across the school year while mean levels of global LS, SS and externalizing behavior increased across the school year.
34
study variables ranged from -2.27 to 0.62 and the kurtosis values ranged from -.31 to 6.56. Only one of the fifteen variables, the cognitive engagement variable of Future Aspirations and Goals, exhibited questionable normality based on its skew and kurtosis values (T1 skewness = -2.22, T1 kurtosis = 6.56; T2 skewness = -2.27, T2 kurtosis = 6.24). Correlational analyses of this variable was conducted using both inverse transformed data and non-transformed data. Because no differences were observed, analyses of the non-transformed data were reported.
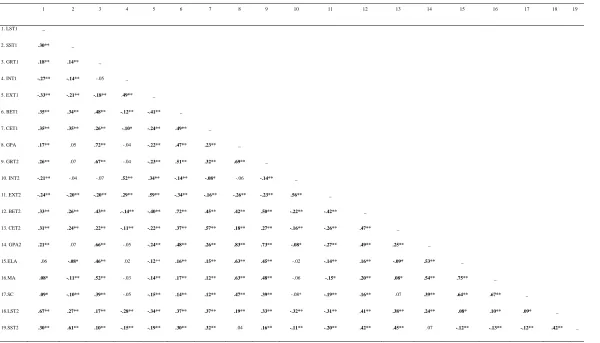
Correlational Analysis. Zero-order correlations were conducted among the
predictor (SS and global LS) and criterion (internalizing and externalizing behavior, self-reported grades, school-self-reported GPA, standardized test scores, and cognitive and behavioral engagement) variables at T1 and T2. Demographic relationships were also examined as possible covariates for subsequent regression analyses. The zero-order correlations among predictor and criterion variables are presented in Table 2.
Table 2 provides the data necessary to test Hypotheses 1, 2, and 3: Hypothesis 1 predicted that global LS would be significantly positively related to the criterion variables of self-reported grades, actual school-reported GPA, measures of student cognitive and behavioral engagement, and significantly negatively related to measures of school-related internalizing and externalizing behaviors at T1 and T2. It was also posited that global LS would be significantly, positively related to standardized MAP scores for language, math and science.
35
= .33, p < .01) and cognitive engagement (r = .35, p < .01; r = .31, p < .01) at T1 and T2, respectively, and standardized MAP scores for science (r = .09, p < .05), math (r = .08, p < .05). Significant negative correlations were found between global LS and school-related internalizing (r = -.27, p < .01; r = -.21, p < .01) and externalizing (r = -.33, p < .01; r = -.24, p < .01) behaviors at T1 and T2, respectively. In addition, a non-significant relationship was found between global LS and standardized MAP scores for language (r = .06, p > .05).
Hypothesis 2 predicted that SS would be significantly positively related to the same criterion variables at T1 and T2. In support of Hypothesis 2, significant positive correlations were found between SS and self-reported grades (r = .14, p < .01) at T1, and school-related behavioral (r = .34, p < .01; r = .26, p < .01) and cognitive engagement (r = .35, p < .01; r = .24, p < .01) at T1 and T2, respectively. Significant negative
correlations were found between SS and school-related internalizing behavior (r = -.14, p < .01) at T1, school-related externalizing behavior (r = -.21, p < .01; r = -.20, p < .01) at T1 and T2, respectively, and standardized MAP scores for science (r = -.10, p < .01), math (r = -.11, p < .01), and language (r = -.08, p < .05). Non-significant relationships were found between SS and school-reported GPA (r = .05, p > .05; r = .07, p > .05) at T1 and T2, respectively, and school-related internalizing behavior (r = -.04, p > .05) at T2.
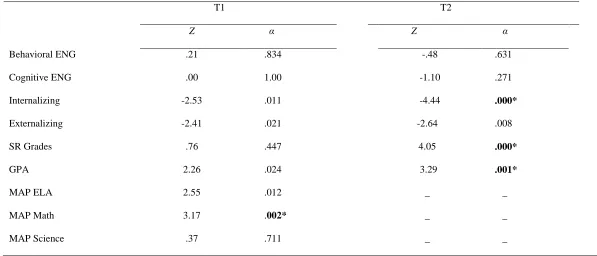
36
SS measure. In order to evaluate differences in the magnitude of correlations between the criterion measures and global LS versus SS, Fisher’s Z-transformation was used (Howell, 2002). Employing a Bonferroni-corrected alpha level (.05/9 = .005, α < .005),
standardized MAP scores for math and three of the nine comparisons, internalizing behavior, self-reported grades and school-reported GPA, were significant at T2. In all three cases, the coefficients were lower for the SS domain. As shown in Table 3, these results did not support Hypothesis 3.
Multiple Regression. A series of regression analyses were tested in order to
examine study Hypotheses 4 and 5. Before testing these models, the assumptions of multiple regression were examined, including normality, homoscedasticity, linearity and multicollinearity (Cohen, Cohen, West, & Aiken, 2003).
Detection of multivariate outliers was conducted by checking for Mahalanobis
distance values (D2) of concern and conducting a collinearity diagnosis. Seven extreme
multivariate outlier were identified using a criteria of α = .001 and a critical value of 27.88 (Tabachnik & Fidell, 2001). None of the outliers were identified as influential data points as they all yielded Cook distances < 1, and were therefore retained in the study (Tabachnik & Fidell, 2001).
37
2.5 and tolerance levels exceeded .40 (Allison, 1999), indicating the data to be suitably correlated for analysis using multiple linear regression.
The assumptions of normality, linearity and homoscedasticity were checked by plotting the standardized residuals against the standardized predicted values. A visual examination of the scatterplots indicated that the residuals were normally distributed and that the aforementioned assumptions were satisfied.
Hierarchical Regression Analyses. Two sets of hierarchical multiple regression
analyses were employed to examine the incremental contribution of global LS and SS in predicting important related outcome variables (i.e., self-reported grades, school-reported GPA, standardized test scores, internalizing and externalizing behavior, and behavioral and cognitive engagement (Cohen & Cohen, 1973) at T1 and T2. The first set of regression analyses assessed the relative contribution of global LS above and beyond that of SS and relevant covariates (i.e., significantly correlated demographic
characteristics) at T1 and T2. The second set of analyses assessed the contributions of SS above and beyond that of global LS and the covariates at T1 and T2. In this manner, the unique contribution to variance of each predictor variable on each outcome variable was obtained, while controlling for the other predictor variable.
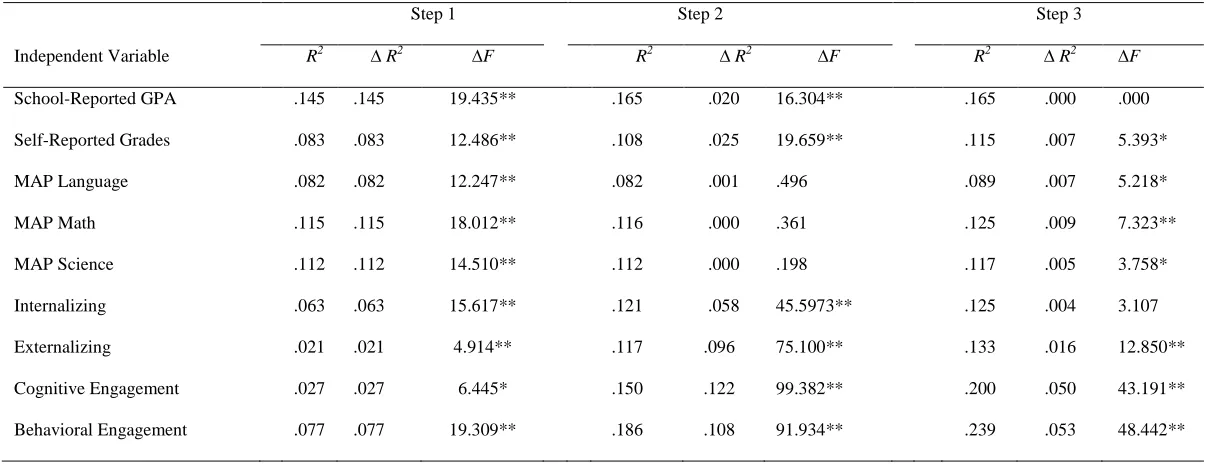
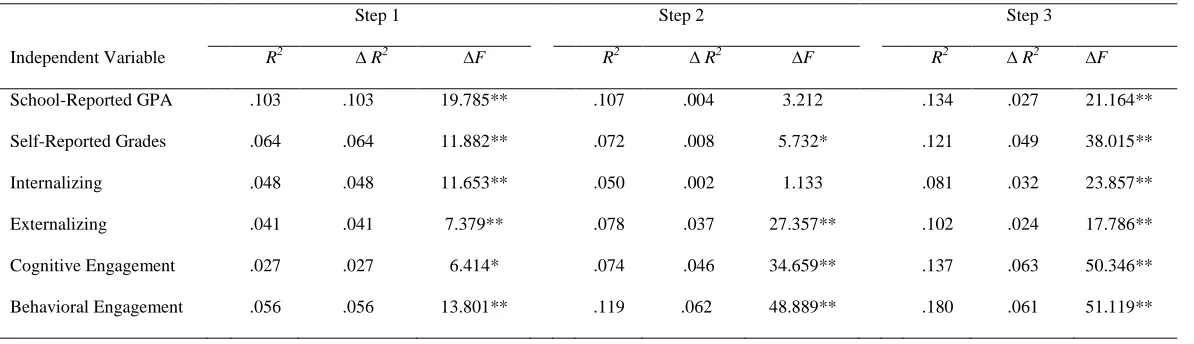
Hypothesis 4: Incremental Contribution of SS. Hypothesis 4 posited that SS
38
variables with which it was found to be significantly related to in the previous
correlational analysis; these variables were entered into the model simultaneously. Global LS was added to the model at Step 2, and SS was added at Step 3. The statistical results for T1 are presented in Table 4, and the statistical results for T2 are presented in Table 5.
Results indicated partial support for Hypothesis 4. SS accounted for incremental variance beyond the covariates and global LS in the amount of 13.3% and 10.2% for externalizing behavior, 20% and 13.7% for cognitive engagement, 23.9% and 18% for behavioral engagement at T1 and T2, respectively, as well as 11.5% for self-reported grades at T1, 12.5% for MAP math scores, 8.9% for MAP language scores, and 11.7% for MAP science scores.SS did not add incremental variance beyond the covariates and global LS for the following criterion variables: school-reported GPA at T1 and T2, self-reported grades at T2, and school-related internalizing behavior at T1 and T2.
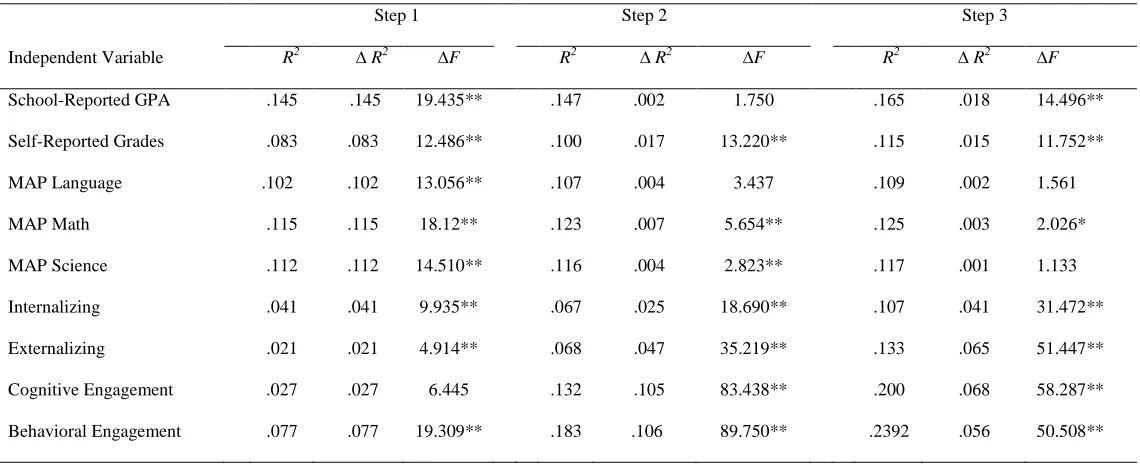
Hypothesis 5: Incremental Contribution of Global LS. Hypothesis 5 posited that
global LS would fail to add significant variance above and beyond SS in the prediction of self-reported grades, school-reported GPA, school-related internalizing and externalizing behaviors, and cognitive and behavioral engagement in school at T1 and T2, and
standardized MAP test scores for language, math and science. The incremental contribution of global LS was also assessed in three steps: At Step 1, the criterion
39
The results partially supported Hypothesis 5. Global LS added incremental variance beyond the covariates and SS in the amount of 16.5% and 13.4% for school-reported GPA, 11.5% and 12.1% for self-school-reported grades, 10.7% and 8.1% for
40
Table 3.1 Descriptive Statistics for Predictor and Criterion Variables
Note. N = 694. T1 = Time 1. T2 = Time 2. Grade Point Average = GPA. MAP = Measure of Academic Progress. Rasch Unit Score = RIT.
Variable M SD Skew Kurtosis
T1 Global Life Satisfaction 4.49 .98 -.76 .28
T1 School Satisfaction 4.28 1.22 -.59 -.29
T1 Internalizing 2.59 .79 .33 -.01
T1 Externalizing 2.28 .97 .59 -.31
T1 Behavioral Engagement 4.06 .66 -.77 .74
T1 Cognitive Engagement 3.74 .41 -2.22 6.56
T1 Self-Reported Grades 4.27 .79 -1.07 1.39
T1 School-Reported GPA 3.11 .76 -.80 -.11
T2 Global Life Satisfaction 4.58 1.03 -.81 .27
T2 School Satisfaction 4.37 1.27 -.66 -.22
T2 Internalizing 2.56 .84 .31 -.02
T2 Externalizing 2.31 1.02 .62 -.29
T2 Behavioral Engagement 3.98 .75 -.89 .93
T2 Cognitive Engagement 3.71 .48 -2.27 6.24
T2 Self-Reported Grades 4.12 .90 -1.03 .90
T2 School-Reported GPA 3.01 .78 -.83 .19
MAP Math RIT 242.32 14.04 -.13 .01
MAP Language RIT 222.76 10.36 -.66 .39
Table 3.2 Intercorrelations Between Predictor and Criterion Variables at T1 and T2
Note. N = 694. T1 = Time 1. T2 = Time 2. LS = Global Life Satisfaction. SS = School Satisfaction. GR = Self-Reported Grades. IN = Internalizing. EX = Externalizing. BE = Behavioral Engagement.
CE = Cognitive Engagement. GPA = Grade Point Average. *p < .05, **p < .05
1 2 3 4 5 6 7 8 9 10 11 12 13 14 15 16 17 18 19
1. LST1 _
2. SST1 .30** _
3. GRT1 .18** .14** _
4. INT1 -.27** -.14** -.05 _
5. EXT1 -.33** -.21** -.18** .49** _
6. BET1 .35** .34** .48** -.12** -.41** _
7. CET1 .35** .35** .26** -.10* -.24** .49** _
8. GPA .17** .05 .72** -.04 -.22** .47** .23** _
9. GRT2 .26** .07 .67** -.04 -.23** .51** .32** .69** _
10. INT2 -.21** -.04 -.07 .52** .34** -.14** -.08* -.06 -.14** _
11. EXT2 -.24** -.20** -.20** .29** .59** -.34** -.16** -.26** -.23** .56** _
12. BET2 .33** .26** .43** .-.14** -.40** .72** .45** .42** .50** -.22** -.42** _
13. CET2 .31** .24** .22** -.11** -.22** .37** .57** .18** .27** -.16** -.26** .47** _
14. GPA2 .21** .07 .66** -.05 -.24** .48** .26** .83** .73** -.08* -.27** .49** .25** _
15.ELA .06 -.08* .46** .02 -.12** .16** .15** .63** .45** -.02 -.14** .16** -.09* .53** _
16.MA .08* -.11** .52** -.03 -.14** .17** .12** .63** .48** -.06 -.15* .20** .08* .54** .75** _
17.SC .09* -.10** .39** -.05 -.15** .14** .12** .47** .39** -.08* -.19** .16** .07 .39** .64** .67** _
18.LST2 .67** .27** .17** -.28** -.34** .37** .37** .19** .33** -.32** -.31** .41** .38** .24** .08* .10** .09* _
19.SST2 .30** .61** .10** -.15** -.19** .30** .32** .04 .16** -.11** -.20** .42** .45** .07 -.12** -.13** -.12** .42** _
4
Table 3.3 Comparison of Magnitude of Correlations Between Global Life Satisfaction and School Satisfaction Domains at T1 and T2
T1 T2
Z α Z α
Behavioral ENG .21 .834 -.48 .631
Cognitive ENG .00 1.00 -1.10 .271
Internalizing -2.53 .011 -4.44 .000*
Externalizing -2.41 .021 -2.64 .008
SR Grades .76 .447 4.05 .000*
GPA 2.26 .024 3.29 .001*
MAP ELA 2.55 .012 _ _
MAP Math 3.17 .002* _ _
MAP Science .37 .711 _ _
Note. Comparison based on a Bonferroni corrected alpha level of .005. LS = Life Satisfaction. SS = School Satisfaction. T1 = Time 1. T2 = Time 2. Z = Fisher’s Z Score Transformation. ENG = Engagement. SR = Self-reported GPA = Grade Point Average. ELA = English Language Arts.
* p < .005
4
Table 3.4 Hypothesis 5: Incremental Contribution of SS in Predicting School Related Outcomes at T1
Step 1 Step 2 Step 3
Independent Variable R2 ∆ R2 ∆F R2 ∆ R2 ∆F R2 ∆ R2 ∆F
School-Reported GPA .145 .145 19.435** .165 .020 16.304** .165 .000 .000
Self-Reported Grades .083 .083 12.486** .108 .025 19.659** .115 .007 5.393*
MAP Language .082 .082 12.247** .082 .001 .496 .089 .007 5.218*
MAP Math .115 .115 18.012** .116 .000 .361 .125 .009 7.323**
MAP Science .112 .112 14.510** .112 .000 .198 .117 .005 3.758*
Internalizing .063 .063 15.617** .121 .058 45.5973** .125 .004 3.107
Externalizing .021 .021 4.914** .117 .096 75.100** .133 .016 12.850**
Cognitive Engagement .027 .027 6.445* .150 .122 99.382** .200 .050 43.191**
Behavioral Engagement .077 .077 19.309** .186 .108 91.934** .239 .053 48.442**
Note. N = 694. Step 1 = Demographic Covariates. Step 2 = Global Life Satisfaction. Step 3 = School Satisfaction. *p < .05, **p < .01.
Table 3.5 Hypothesis 5: Incremental Contribution of SS in Predicting School Related Outcomes at T2
Step 1 Step 2 Step 3
Independent Variable R2 ∆ R2 ∆F R2 ∆ R2 ∆F R2 ∆ R2 ∆F
School-Reported GPA .103 .103 19.785** .133 .0301 24.461** .134 .000 .043
Self-Reported Grades .0 .064 11.852** .120 .056 34.024** .121 .000 .089
Internalizing .048 .048 11.653** .081 .033 24.826** .081 .000 .229
Externalizing .041 .041 7.379** .084 .043 32.782** .102 .018 13.475**
Cognitive Engagement .027 .027 6.414* .120 .093 73.287** .137 .016 12.928**
Behavioral Engagement .056 .056 13.801** .155 .099 80.815** .180 .024 20.463**
Note. N = 694. Step 1 = Demographic Covariates. Step 2 = Global Life Satisfaction. Step 3 = School Satisfaction. *p < .05, **p < .01.
4
Table 3.6 Hypothesis 6: Incremental Contribution of Global LS in Predicting School Related Outcomes at T1
Step 1 Step 2 Step 3
Independent Variable R2 ∆ R2 ∆F R2 ∆ R2 ∆F R2 ∆ R2 ∆F
School-Reported GPA .145 .145 19.435** .147 .002 1.750 .165 .018 14.496**
Self-Reported Grades .083 .083 12.486** .100 .017 13.220** .115 .015 11.752**
MAP Language .102 .102 13.056** .107 .004 3.437 .109 .002 1.561
MAP Math .115 .115 18.12** .123 .007 5.654** .125 .003 2.026*
MAP Science .112 .112 14.510** .116 .004 2.823** .117 .001 1.133
Internalizing .041 .041 9.935** .067 .025 18.690** .107 .041 31.472**
Externalizing .021 .021 4.914** .068 .047 35.219** .133 .065 51.447**
Cognitive Engagement .027 .027 6.445 .132 .105 83.438** .200 .068 58.287**
Behavioral Engagement .077 .077 19.309** .183 .106 89.750** .2392 .056 50.508**
Note. N = 694. Step 1 = Demographic Covariates. Step 2 = Global Life Satisfaction. Step3 = School Satisfaction. *p < .05, **p < .01.
4
Table 3.7 Hypothesis 6: Incremental Contribution of Global LS in Predicting School Related Outcomes at T2
Step 1 Step 2 Step 3
Independent Variable R2 ∆ R2 ∆F R2 ∆ R2 ∆F R2 ∆ R2 ∆F
School-Reported GPA .103 .103 19.785** .107 .004 3.212 .134 .027 21.164**
Self-Reported Grades .064 .064 11.882** .072 .008 5.732* .121 .049 38.015**
Internalizing .048 .048 11.653** .050 .002 1.133 .081 .032 23.857**
Externalizing .041 .041 7.379** .078 .037 27.357** .102 .024 17.786**
Cognitive Engagement .027 .027 6.414* .074 .046 34.659** .137 .063 50.346**
Behavioral Engagement .056 .056 13.801** .119 .062 48.889** .180 .061 51.119**
Note. N = 694. Step 1 = Demographic Covariates. Step 2 = Global Life Satisfaction. Step3 = School Satisfaction. *p < .05, **p < .01.
4
47
CHAPTER 4
DISCUSSION
Noddings (2003) theorized that the relationship between LS and education is an inseparable one. Research in the field of positive psychology over the past two decades has yielded some evidence to support this proposition. Most pertinent to the current study are findings that have linked adolescent global LS and SS to significant achievement and behavioral outcomes in school (Suldo, et al., 2009), pointing to their relevance in
educational functioning (Suldo et al., 2008). On the contrary, other studies have
demonstrated modest to no significant relationships between global LS or SS and school-related outcomes among adolescents; thus, findings have been somewhat mixed,
especially in relation to achievement (i.e., grades, school-reported GPA, and standardized test scores). In addition, few studies have examined the predictive outcomes (school-related) of global LS and SS among adolescents. The current study contributes to this gap in the literature by directly investigating the ability of global LS and SS to predict
adolescent achievement and behavior in school, utilizing a context-specific approach to measurement
Theoretical and measurement advances in the self-concept literature have created potential conceptual linkages to the study and measurement of LS via the specificity matching principle which proposes that the predictive power of a measurement
48
concept of specificity matching to the predictive measurement of school-related outcomes in the context of school. More specifically, the current study compared the predictive utility of a global versus a domain- specific measure of LS among a sample of
adolescents in the context of school, and to the author’s knowledge is the first study to do so.
On the basis of previous research and the guiding theoretical principle, specificity matching, this study made several propositions. For one, this study proposed that global LS and SS would be significantly correlated with the school-related variables of interest (self-reported grades, school-reported GPA, engagement [cognitive and behavioral], internalizing and externalizing behavior, and standardized MAP scores), and moreover that SS would be more strongly correlated with these variables than global LS. These propositions were not fully supported by the data. As expected, SS was significantly related to most of the school-related variables. Contrary to expectations, no significant relationships were found between SS and school-related internalizing behavior at T2, school-reported GPA at T1 or T2, self-reported grades at T2. On the other hand, global LS significantly correlated with all study variables except standardized MAP scores for language, and to a greater degree than SS for all study variables, except standardized MAP scores for science and math.
To further examine these associations, zero order correlations with the nine criterion variables were calculated separately for both satisfaction domains at T1 and T2, and the magnitude of these differences were then compared. The majority of the
comparisons were found to be fairly similar. Indeed, testing for differences in the