OPEN LEARNER MODELS FOR
SELF-REGULATED LEARNING: EXPLORING THE
EFFECTS OF SOCIAL COMPARISON AND
GRANULARITY
by
Julio Daniel Guerra Hollstein
Bachelor in Computer Sciences, Universidad Austral de Chile
Submitted to the Graduate Faculty of
the School of Information Sciences, University of Pittsburgh in
partial fulfillment
of the requirements for the degree of
Doctor of Philosophy
University of Pittsburgh
2018
UNIVERSITY OF PITTSBURGH
SCHOOL OF INFORMATION SCIENCES
This dissertation was presented
by
Julio Daniel Guerra Hollstein
It was defended on
October 24th 2017
and approved by
Dr. Peter Brusilovsky, School of Computing and Information, University of Pittsburgh
Dr. Rosta Farzan, School of Computing and Information, University of Pittsburgh
Dr. Yu-Ru Lin, School of Computing and Information, University of Pittsburgh
Dr. Christian Schunn, Learning Research and Development Center, University of
Pittsburgh
Dissertation Director: Dr. Peter Brusilovsky, School of Computing and Information,
OPEN LEARNER MODELS FOR SELF-REGULATED LEARNING: EXPLORING THE EFFECTS OF SOCIAL COMPARISON AND
GRANULARITY
Julio Daniel Guerra Hollstein, PhD
University of Pittsburgh, 2018
Open Learner Models (OLM) show the learner the internal model that the computer-based adaptive or tutoring system maintains. In the context of Self-Regulated Learning, where the learner is able to make decisions about what to learn and how to learn, OLM bring a wide variety of supporting features, ranging from metacognitive support, to navigational support, to engagement with the learning content. In prior work using OLM which featured social comparison features (OSLM), I have discovered interesting effects from these systems, regarding engagement with the system, encompassing considerable variations across different studies.
My thesis deepens the understanding of OLM and OSLM by a series of studies in which I evaluate different versions of Mastery Grids, incorporating features that were designed to match different motivational profiles, which are grounded in theories of Self-Regulated Learning and Learning Motivation. A large classroom study with more than 300 active students was conducted to deepen the exploration of the social comparison features in terms of engagement and navigation within the system. The results of this study confirmed the positive effects of the social comparison features and also brought insights into why certain students are influenced, based on their motivational orientations and prior-knowledge. A second large classroom study expanded the exploration by deploying the Rich-OLM, an extension of Mastery Grids featuring coarse- and fine-grained information about the learner model, which was designed to help students navigate the content contained in the system.
Results showed that students exposed to the fine-grained components took comparatively less time navigating the interface with higher rates of attempting content that they had opened. Results also raised concerns about increasing the complexity of the interface by integrating fine-grained visualization and social comparison features.
My work contributes to the understanding of the effects of Open Learner Models and ad-ditional features that provide social comparison and detailed information. It also contributes bringing learning motivation aspects into the understanding of Open Learner Models. Learn-ing motivation in the context of self-regulated learnLearn-ing, provides a valuable theoretical basis to study how different students react and use learning tools.
TABLE OF CONTENTS
PREFACE . . . xvii
1.0 INTRODUCTION . . . 1
1.1 MOTIVATION . . . 1
1.2 EXPLORING OLM AND OSLM WITH INDIVIDUAL DIFFERENCES 4 1.3 GRANULARITY: EXTENDING NAVIGATIONAL SUPPORT . . . 5
1.4 OVERVIEW AND RESEARCH QUESTIONS . . . 6
1.5 THESIS ORGANIZATION . . . 9
2.0 BACKGROUND AND RELATED WORK. . . 11
2.1 OPEN LEARNER MODELS . . . 11
2.2 SELF-REGULATED LEARNING AND LEARNING MOTIVATION . . 15
2.3 SOCIAL COMPARISON ORIENTATION . . . 17
3.0 MASTERY GRIDS OSLM . . . 19
3.1 SMART CONTENT IN MASTERY GRIDS . . . 23
3.1.1 Annotated Examples . . . 25 3.1.2 Animated Examples . . . 26 3.1.3 Parameterized Problems . . . 27 3.1.4 Parsons Problems . . . 28 3.2 SYSTEM ARCHITECTURE . . . 30 3.3 ACTIVITY LOG . . . 34
4.0 PREVIOUS STUDIES AND FINDINGS . . . 35
4.1 INITIAL MASTERY GRIDS STUDIES . . . 35 4.2 THE VALUE OF SOCIAL FEATURES: STUDY IN DATABASE COURSE 37
4.3 MASTERY GRIDS WITH SOCIAL COMPARISON: A STUDY IN A
JAVA COURSE . . . 43
4.4 CONCLUSIONS OF THIS CHAPTER . . . 50
5.0 RESEARCH FRAMEWORK, OVERALL DESIGN AND STUDIES 52 5.1 RESEARCH FRAMEWORK. . . 52
5.2 CLASSROOM STUDIES AND CONTROLLED STUDIES . . . 56
5.3 COMMON MEASURES AND VARIABLES . . . 58
5.3.1 Prior knowledge and learning. . . 58
5.3.2 System activity: engagement, navigation and performance . . . 58
5.3.2.1 Engagement variables . . . 58
5.3.2.2 Navigation variables . . . 59
5.3.2.3 Performance in self-assessment variables . . . 60
5.3.3 Learning Motivation. . . 61
5.3.4 Social Comparison Orientation . . . 63
5.4 EDUCATIONAL CONTEXT OF THE CLASSROOM STUDIES. . . 63
6.0 CLASSROOM STUDY 1: SOCIAL COMPARISON FEATURES ON A COARSE-GRAINED OLM . . . 65
6.1 MOTIVATION . . . 65
6.2 STUDY DESIGN . . . 66
6.2.1 Treatment groups . . . 67
6.2.2 Data collection. . . 69
6.2.3 Approach followed in the analyses . . . 69
6.3 DATA OVERVIEW AND PRE-PROCESSING . . . 70
6.3.1 Data collected . . . 70
6.3.2 Questionnaire Reliability and Factor Analyses . . . 74
6.3.3 Statistics of questionnaire . . . 80
6.4 PRIOR AND POST KNOWLEDGE DIFFERENCES . . . 83
6.5 THE IMPACT OF PRIOR KNOWLEDGE IN STUDENT ENGAGEMENT 86 6.6 HIGH PRETEST STUDENTS ARE EARLY STUDENTS . . . 90
6.7.1 Regression analyses . . . 94
6.7.2 Effects on engagement . . . 95
6.7.3 Effects on performance . . . 98
6.7.4 Effects on navigation . . . 99
6.8 THE ROLE OF SOCIAL COMPARISON ORIENTATION . . . 100
6.9 THE ROLE OF LEARNING MOTIVATION . . . 105
6.9.1 Mastery Approach Orientation . . . 106
6.9.2 Performance Approach Orientation . . . 106
6.9.3 Do motivation orientations explain the selective effect of pretest in Social group? . . . 111
6.10 THE CHANGE OF MOTIVATION . . . 113
6.11 CONCLUSIONS OF THIS CHAPTER . . . 117
7.0 DESIGNING A FINE-GRAINED OLM . . . 120
7.1 THE UNDERLYING LEARNER MODEL . . . 121
7.2 INTEREST FOR DETAILED LEARNER MODEL . . . 122
7.3 STUDY 1: COMPARING DESIGN OPTIONS FOR A FINE-GRAINED OLM . . . 126
7.3.1 Motivation and set up. . . 126
7.3.2 Study 1 results. . . 129
7.4 THE RICH-OLM . . . 131
8.0 EVALUATION OF RICH-OLM . . . 139
8.1 STUDY DESIGN . . . 139
8.1.1 Visualizations and the system . . . 139
8.1.2 Pretest . . . 143
8.1.3 Introduction and general Instructions . . . 144
8.1.4 Tasks . . . 145
8.1.5 Task Survey . . . 146
8.2 RESULTS . . . 148
8.2.1 Data collected . . . 148
8.2.3 Behavior differences among treatments . . . 151
8.2.4 Relations between survey and log variables . . . 154
8.2.5 Overall perception of the visualizations . . . 154
8.3 CONCLUSIONS OF THIS CHAPTER . . . 155
9.0 CLASSROOM STUDY 2: THE EFFECTS OF RICH-OLM . . . 157
9.1 MOTIVATION . . . 157
9.2 STUDY DESIGN . . . 158
9.2.1 Course context . . . 158
9.2.2 Treatment groups . . . 159
9.2.3 Data collection. . . 162
9.3 DATA OVERVIEW AND PRE-PROCESSING . . . 164
9.3.1 Data collected . . . 164
9.3.2 Questionnaire Reliability and Factor Analyses . . . 167
9.3.3 Statistics of questionnaire . . . 172
9.3.4 Initial motivation across groups . . . 174
9.4 PRIOR AND POST KNOWLEDGE DIFFERENCES . . . 175
9.5 EFFECT OF SYSTEM PRACTICE ON POST-KNOWLEDGE . . . 177
9.6 THE IMPACT OF PRIOR KNOWLEDGE IN STUDENT ENGAGEMENT179 9.7 EFFECTS ON SYSTEM ACTIVITY . . . 180
9.7.1 Overall differences . . . 180
9.7.2 Regression analyses . . . 183
9.7.3 Effects on engagement . . . 183
9.7.4 Effects on navigation . . . 185
9.7.5 Effects on performance . . . 188
9.8 ACTIVITY TROUGH THE TERM . . . 188
9.8.1 The effects ofGauge in coming back to the system . . . 188
9.8.2 Regularity, level of activity andgauge . . . 190
9.9 THE ROLE OF SOCIAL COMPARISON ORIENTATION . . . 191
9.10 THE ROLE OF LEARNING MOTIVATION . . . 192
9.10.2 The role of Performance Approach . . . 198
9.11 THE CHANGE OF MOTIVATION . . . 201
9.12 CONCLUSIONS OF THIS CHAPTER . . . 205
9.12.1 Overall effects on system activity . . . 207
9.12.2 Individual differences . . . 208
9.12.3 Change of motivation . . . 210
10.0 ANALYSES ACROSS STUDIES . . . 211
10.1 DIFFERENCES BETWEEN STUDY IMPLEMENTATION . . . 211
10.2 PRIOR AND POST KNOWLEDGE. . . 212
10.3 ENGAGEMENT WITH THE PRACTICE SYSTEM . . . 213
10.4 NAVIGATION AND PERFORMANCE . . . 217
10.5 MOTIVATION . . . 221
10.6 CHANGE OF MOTIVATION . . . 223
11.0 CONCLUSIONS AND DISCUSSION . . . 225
11.1 THE EFFECTS OF SOCIAL COMPARISON FEATURES . . . 226
11.2 THE EFFECTS OF FINE-GRAINED OLM . . . 227
11.3 THE ROLE OF INDIVIDUAL DIFFERENCES . . . 230
11.4 THE CHANGE OF MOTIVATION . . . 233
11.5 LIMITATIONS AND FUTURE WORK . . . 234
APPENDIX A. PRETEST AND POSTTEST . . . 236
APPENDIX B. MOTIVATION QUESTIONNAIRE . . . 241
B.1 LEARNING ACTIVATION . . . 241
B.1.1 Fascination . . . 241
B.1.2 Competency Beliefs . . . 242
B.1.3 Values . . . 242
B.2 ACHIEVEMENT-GOAL ORIENTATION . . . 243
APPENDIX C. SOCIAL COMPARISON ORIENTATION QUESTION-NAIRE . . . 244
APPENDIX D. CONCEPT SPACE. . . 245
LIST OF TABLES
1 System activity in OSM and OSSM . . . 41
2 System activity statistics . . . 45
3 Number of students in the study . . . 71
4 Summary statistics of performance measures . . . 71
5 Raw count of activity performed in the system . . . 72
6 General statistics of engagement variables . . . 73
7 Factor analyses on SCO . . . 77
8 Reliability on motivational questionnaire . . . 77
9 Factor analyses on Learning Activation . . . 78
10 Factor analyses on Achievement-Goal orientations . . . 79
11 Basic statistics of motivational factors.. . . 81
12 Mann-Whitney U Test on performance between groups. . . 83
13 Regressions on Posttest with predictors Pretest and mg completion . . . 85
14 Regressions on posttest with interaction . . . 85
15 Regression on mg completion . . . 87
16 Early and late students . . . 91
17 System activity by treatment.. . . 93
18 Regressions on system activity variables . . . 96
19 System activity in low and high Social Comparison Orientation groups . . . . 102
20 Regressions considering Social Comparison Orientations . . . 104
21 Activity in low and high Mastery (MAp) and Performance (PAp) groups . . . 107
23 Regressions considering Performance Approach . . . 109
24 T-tests on motivation at the beginning and end of the term . . . 115
25 Regressions on motivational factors . . . 116
26 Study 1, the best and worst visualizations . . . 130
27 Usefulness and self-reflection task survey. . . 147
28 NASA-TLX survey. . . 148
29 Statistics of task surveys . . . 149
30 Log activity summary. . . 152
31 Survey 2 summary . . . 153
32 Number of students in the study . . . 164
33 Summary statistics of performance measures . . . 165
34 General statistics of engagement variables.. . . 166
35 Factor Analyses on Social Comparison Orientation . . . 168
36 Reliability analyses of the Motivation questionnaire. . . 169
37 Factor Analyses on the Learning Activation . . . 170
38 Factor analyses on Achievement-Goal . . . 171
39 Basic statistics of motivational factors.. . . 172
40 Mean and Standard Deviation of motivational factors . . . 175
41 Kruskal-Wallis test on motivational factors . . . 175
42 Non-parametric test on performance measures between treatment groups. . . 176
43 Regression on posttest . . . 177
44 Regression on posttest with predictors pretest and mg completion . . . 178
45 Regressions on mg completion with predictors pretest and competency beliefs 180 46 System activity by treatment . . . 181
47 Regressions on system activity variables . . . 184
48 Students who entered the system and came back . . . 189
49 Regressions on regularity withmg completion and features social and gauge . 191 50 Regressions on system activity by Social Comparison Orientation . . . 192
51 Mastery and Performance Approach factors at the beginning of the term . . . 193
53 Regressions considering Mastery Approach . . . 195
54 Regressions considering Performance Approach . . . 199
55 T-tests for motivation measured at the beginning and at the end of the term 204 56 Regressions on change of motivation . . . 204
57 Statistics of performance measures in studies of 2015 and 2016. . . 214
58 Statistics of some engagement variables in 2015 and 2016 studies. . . 218
59 Regression on mg completion byyear . . . 219
60 Statistics and regressions on navigation and performance in self-asssessment . 220 61 Motivation factors in studies . . . 222
62 Items of the motivation questionnaire corresponding to the factor Fascination. 241 63 Items of the motivation questionnaire for Competency Beliefs . . . 242
64 Items of the motivation questionnaire corresponding to the factor Values. . . 242
65 Achievement-Goal questionnaire items . . . 243
66 Items of the INCOM questionnaire . . . 244
67 List of concepts used in the Java programming course - Part 1 . . . 245
68 List of concepts used in the Java programming course - Part 2 . . . 246
LIST OF FIGURES
1 Examples of Open Learner Models . . . 2
2 Research questions, factors and effects explored in this thesis. . . 7
3 Basic Mastery Grids interface. . . 20
4 Mastery Grids with social comparison features. . . 21
5 Overlay window showing an activity opened in Mastery grids. . . 22
6 The full Mastery Grids interface . . . 24
7 Annotated Example . . . 26
8 Animated Example . . . 27
9 Parameterized problem . . . 28
10 Parameterized problem showing feedback . . . 29
11 Parameterized problem for SQL . . . 29
12 Parson problem . . . 30
13 Mastery Grids architecture . . . 32
14 Mastery Grids without social comparison (OSM) for SQL programming course. 38 15 Mastery Grids with social comparison (OSSM) for SQL programming course. 38 16 Proportion of students at different levels of activity. . . 40
17 Interaction between Time (Part 1, Part 2) and Social factor (OSM/OSSM). . 46
18 Examples displayed by gender in the OSSM during Part 1 and 2 . . . 47
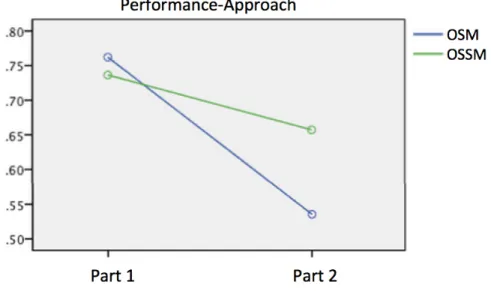
19 Different decrease of Performance orientation in OSM and OSSM groups . . . 49
20 Diagram of studies . . . 57
21 Mastery Gridsindividual . . . 68
23 Histograms of mg completion in both treatment groups . . . 74
24 Raw activity during the term . . . 75
25 Density of system activity during the term by treatment group. . . 75
26 Histogram of Competency Beliefs. . . 80
27 Histogram of Mastery Approach . . . 80
28 Histogram of Performance Approach . . . 82
29 Histogram of Social Comparison Orientation. . . 82
30 Scatterplots of mg completion vs prior-knowledge. . . 87
31 Mean mg completion at 3 levels of pretest . . . 88
32 Mean mg completion at 4 levels of pretest . . . 89
33 Activity of early and late students by level of pretest . . . 92
34 Density of system activity during the term by treatment group. . . 94
35 Histograms of mg completion in both treatment groups. . . 94
36 Attempts before exam . . . 97
37 Number of students by level of activity . . . 98
38 Density chart of the activity of each treatment group. . . 101
39 Mean mg completion across different levels of Performance Approach . . . 111
40 Density of system activity for low and high Performance oriented students . . 112
41 Partial representation of Domain, Content and Learner Models . . . 123
42 The 6 visualization variations evaluated in Study 1. . . 127
43 Overall perception of usefulness of the different visualizations . . . 129
44 Rich-OLM interface without social comparison features . . . 132
45 Rich-OLM interface with social comparison features . . . 132
46 Rich-OLM interface with a selected topic. . . 133
47 Rich-OLM interface: entering a topic. . . 134
48 Full Rich-OLM interface. . . 135
49 Rich-OLM interface: mousing over a content activity. . . 136
51 Details of the Gauge visual aid.. . . 137
50 KCG (KCs+Gauge). . . 137
53 KCG (KC+Gauge). . . 141
54 KCS (KC+Social Comparison).. . . 142
55 Study 2 interface . . . 143
56 Pretest step in the study interface . . . 144
57 General instructions in the study interface. . . 145
58 The study interface during a task . . . 146
59 Interaction between treatment and pretest group for the measure of Effort . . 150
60 Ranking of difficulty of the selected activity . . . 153
61 RichOLM interface,individual . . . 160
62 RichOLM interface with learning gauge. . . 160
63 RichOLM interface with social comparison . . . 161
64 Pretest versus posttest. . . 166
65 Histogram of Competency Beliefs measured at the beginning of the term. . . 173
66 Histogram of Mastery Approach measured at the beginning of the term. . . . 173
67 Histogram of Performance Approach measured at the beginning of the term.. 173
68 Histogram of Social Comparison Orientation. . . 174
69 Average pretest and posttest among treatment groups. . . 176
70 Density plot of system activity over the term . . . 182
71 Mean completion of activity across groups . . . 183
72 Rate of mouseover and number of activities opened and attempted. . . 186
73 Mouseovers on activities by treatment group for different levels of pretest . . 187
74 Relative proportions of students that came back to the system . . . 189
75 Effectiveness for low/high Performance orientation at levels of pretest . . . . 200
76 Mean mg completion across different levels of Performance Approach . . . 202
77 Fascination at different levels of activity completion . . . 206
78 Mean of performance measures in both years. . . 213
79 Density plot of activity during the term, both studies. . . 216
80 Levels of engagement (mg completion) on the two studies. . . 216
81 Engagement of the different treatment groups in the two studies . . . 217
PREFACE
Completing my PhD has been a wonderful experience for me because of all the amazing people I have gotten to know, work with and love. Many colleagues and friends have accom-panied and helped me in this quest, not merely by collaborating with me on these studies, completing development and research tasks and discussions, giving academic writing and presentation feedback; but also with their soul, encouragement, and smiles. I first want to thank all of these people, especially to my finac´ee, Yun Huang, the shinning light in all my endeavours.
I feel especially thankful for the support, encouragement and help of my advisor, Peter Brusilovsky, and the priceless role of all those on my committee: Rosta Farzan, YuRu Lin, and Chris Schunn. Their guidance has been of extreme importance not just to complete this thesis, but also in the whole learning process of becoming a PhD.
Last but not least, I am grateful to my family –my daughter, parents, brothers, and sister– for their unconditional support during all of the 5 years that I have lived so far away.
1.0 INTRODUCTION
1.1 MOTIVATION
Open Learner Models (OLM), also called Open Student Models (OSM), are learning tools that present the usually hidden internal model built by the adaptive or tutoring system to the learner. In the context of Self-Regulated Learning [Zimmerman, 1990b], where the stu-dent is able to make decisions about what to learn and how to learn, Open Learner Models bring a wide variety of supporting features, which are beautifully summarized by [Bull and Kay, 2010]: “improving learner model accuracy by allowing the learner to make contribu-tions to their learner model; promoting learner reflection through confronting students with representations of their understanding; facilitating planning and / or monitoring of learn-ing; facilitating collaboration amongst learners; facilitating competition amongst learners; supporting navigation; the right of access to information stored about oneself; learner con-trol over and responsibility for their learning; trust in the learner model content; formative assessment; summative assessment.”
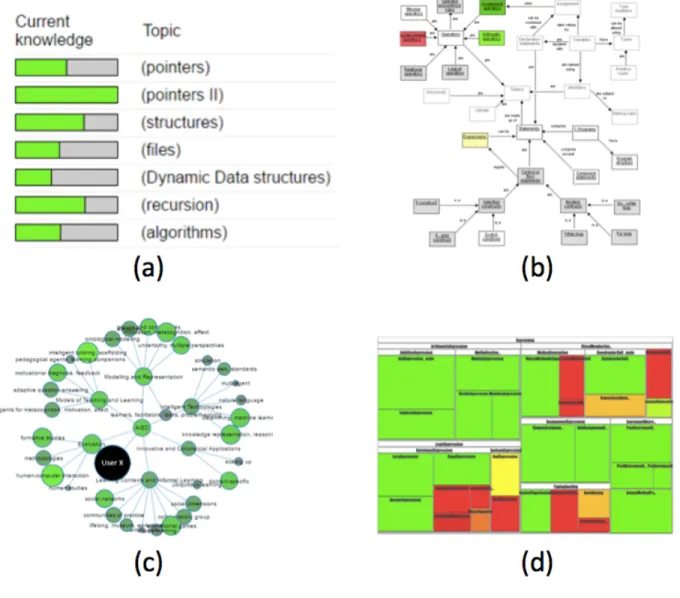
A wide variety of OLM exists and different OLMs have been used in learning contexts, from simpleskillometers [Duan et al., 2010], to more complex representations such as concept maps [Maries and Kumar, 2008]. Figure1shows examples of these types of OLM. Variations of OLM explore other features, too, such as editable, persuadable, and negotiable OLM [Mabbott and Bull, 2006], where the learner has an active role in providing different levels of direct feedback to her learner model; or OLM where the models are shared with others peers, teachers, and even parents. Our own OLMMastery Grids [Loboda et al., 2014] exploits this social feature by showing to the learner an aggregated OLM of the rest of the class. This is what we have called the Open Social Student Model (OSLM). Mastery Grids also includes
Figure 1: Examples of Open Learner Models of different complexity and showing different types of structural information. (a) Skillometers [Bull and Mabbott, 2006], (b) Concept Map [Mabbott and Bull, 2004], (c) Network [Bull et al., 2015], (d) Treemap [Brusilovsky et al., 2013].
another important feature: the tool is used to navigate through the learning content and is not just a static, visual representation of the learner model. Mastery Grids is explained in detail in chapter 3.
Through a series of classroom studies in which we have evaluated the effects of OLM and the social comparison features, we have seen benefits in how students engage with the system. We have found that while the social comparison features generally explain an increase in activity within the system (i.e., more learning content is completed), this positive effect varies considerably across studies. Also, the social comparison features have been shown to interact with multiple factors, such as gender [Brusilovsky et al., 2016] and motivation [Guerra et al., 2016]. However, past studies don’t provide sufficient analyses, nor enough statistical power to support a solid explanation of the positive engagement phenomenon. More research that looks deeply at the effects of OLM, and particularly OSLM, is needed.
A deeper exploration of OLM is also needed to address another issue. While past research studies have evaluated different OLM, ranging from coarse-grained representations to more complex and structured visualizations, no research has looked at the combined or contrasted effects of different levels of granularity, i.e., different levels of detail being shown. I think that this exploration is necessary because the level of granularity of the information shown conveys a trade-off: a complex OLM may provide wider support, for example, by helping the learner navigate the system; but also, the accompanying higher level of details may result in an interface that is too complex to understand and use, which may overwhelm the learner.
My work is motivated by the need to better understand the effects of OLM. This under-standing is important because it can guide the development of better tools, better person-alization and adaptive mechanisms, and better use of such tools in supporting the learning experience. Specifically, I focused my thesis in two ways that extend prior OLM studies. First, I aim to dig deeper into the effects of OLM and the social comparison features by extending analyses incorporating factors that, from a theoretical perspective, could explain these effects. Secondly, I aim to explore the granularity feature by combining coarse-grained and fine-grained representations, and study the effects of these features in supporting learner navigation within the system. These two aspects of my work are explained in detail in the next sections.
1.2 EXPLORING OLM AND OSLM WITH INDIVIDUAL DIFFERENCES
In the context of Self-Regulated Learning (SRL), where the learner makes active decisions about her own learning process, the level of engagement and interaction with the learning system is strongly dependent on the students themselves. Because of this, understanding the effects of OLM better requires looking at factors that differentiate learners, particularly individual differences that may influence self-regulation. Individual differences range over a plethora of cognitive, personality, and demographic factors. To narrow down this space, I turned to the literature of Self-Regulated Learning (SRL) and learning theories, placing special attention on the factors that are theoretically related to exploration features, i.e., the social comparison features.
Learning Theories connect engagement in SRL with different aspects, including metacog-nitive skills [Bandura, 1986], learner beliefs [Dweck, 2000], and goal orientation [Wolters et al., 1996], among other things. In the definition of SRL, Zimmerman provides a common ground in terms of three aspects: metacognitive, motivational, and behavioral [Zimmerman, 1990a]. While the metacognitive dimension has been explored in the context of OLM [Bull and Kay, 2013], and the behavioral dimension is in the realm of observation (observation of engagement with SRL opportunities), the motivational aspect is a key individual difference that has not been studied in the context of Open Learner Models.
Another relevant individual factor is the level of the learner’s knowledge or prior skills. For example, [Mitrovic and Martin, 2007] found that OLM produced significant positive differences between pretest and posttest only for “less able” students. Having prior knowledge may have a strong impact in deciding what to engage with in the learning content. The Expectancy-Value Theory of learning motivation [Wigfield and Eccles, 2000] helps to relate prior knowledge and engagement: the strength of learner skills influences thesubjective task values, including the attained cost of performing the activity, and the expectancy in terms of potential benefits, thus influencing the decision of whether or not to do the activity.
These individual differences represent a key aspect to the contributions of my thesis, extending the exploration of OLM and OSLM interfaces and providing a foundation to guide the research work, the analyses and the interpretation of results.
1.3 GRANULARITY: EXTENDING NAVIGATIONAL SUPPORT
Mastery Grids provides topic-based navigational support that was designed based on past experience in coarse-grained navigational interfaces in learning systems. The value of this approach is demonstrated by its ability to guide students to the most appropriate topics, im-prove learning outcomes, and increase their engagement [Sosnovsky and Brusilovsky, 2015]. However, topic-level visualization has limitations. Topics aggregate information, hiding the learner’s progress knowledge of more detailed components of the learner model, such as specific concepts. The learner may not be aware of knowledge “holes” in topics in which she could have a high overall progress. Also, coarse-grained visualization (topic-based) does not provide enough details to help the learner to choose activities within a topic, failing to provide useful content navigation support. I think that including detailed information in the representation of the learner model (LM) could substantially improve the navigational support of the system. The reasoning behind this belief has roots in the foundations of the information science and information visualization fields. On the one hand, detailed informa-tion can allow students to make decisions about what content to target by providing traces that improve support for information foraging [Pirolli and Card, 1999]. On the other hand, the learner model might make more sense if it is shown by means of external anchoring that detailed LM represent when it is visualized [Liu and Stasko, 2010]. These ideas can be summarized by stating that detailed information in the open learner model could improve the usefulness and the experience in the system by helping the learner to find useful content and to make sense of the information of her own learner model.
However, while detailed information may provide support for better guidance and self-reflection, it also increases the complexity of the tool and thus the cognitive effort necessary to understand and make sense of the detailed information shown. The problem is that this additional complexity could diminish the interest and comfort of the learners. For example, [Duan et al., 2010] found that simple indicators like skillometers are preferred by students over more elaborate and detailed representations of the Learner Model. The information overload in abstract visual representations is a foundational problem addressed by the In-formation Visualization field. In this regard, Shneiderman proposed a framework to address
this problem, depicted masterfully in his famous information-seeking mantra: Overview first, zoom and filter, then details-on-demand [Shneiderman, 1996]. While in Mastery Grids OLM, the coarse-grained topic-based visualization accounts for the overview, the fine-grained in-formation that could account for the details-on-demand is missing.
Following these ideas, my work embraces the task of displaying levels of granularity within the OLM that can support better navigation through content, but at the same time does not overload the learner. To this end, my work includes interviewing students and performing controlled studies to guide the design of a fine-grained visualization that balances support and complexity.
1.4 OVERVIEW AND RESEARCH QUESTIONS
There are many aspects, factors and variables involved in my thesis work. On the one hand, the OLM interface includes the features of social comparison and granularity that are the focus of my evaluation. These features may produce several effects related to the use of this system: engagement, navigation, the support of metacognitive outcomes, and even (indirectly) learning. On the other hand, the effects of these features are studied in conjunction with factors, individual differences, that are likely to influence the results, such as motivation, orientation, and prior knowledge.
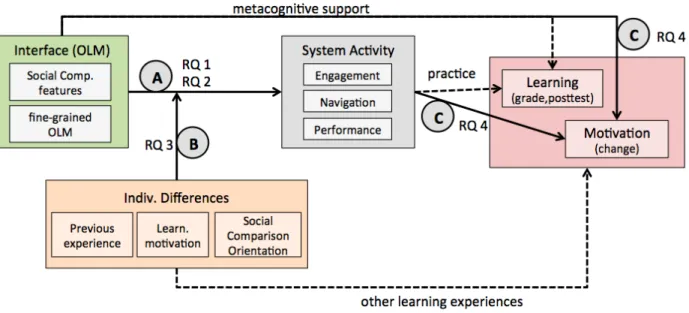
Figure2is an attempt to summarize all the interwoven elements in this thesis. Elements marked with the letters (A), (B), (C) represent relationships that will be explored in this work and which generate research questions. Dotted lines represent other relationships that are not explored in this thesis, such as how the metacognitive support associated with the OLM affects learning, or what are the effects of individual differences in the learning experiences that occur outside the use of the practice system. How practicing content activities affects learning (dotted line labeled as “practice” in the Figure2) is not a central aspect of this work because it is outside of the focus of my thesis to evaluate the quality of the learning material. Moreover, there is another reason why I do not focus on its effect on learning: the goal of the Mastery Grids system is to complement formal coursework, and as such, this system is
not the only and probably not the main source of learning material, since students learn from different sources. However, the learning effect is included in the analyses to confirm the general beneficial impact of the learning system. The relationships and effects investigated are described below.
Figure 2: Research questions, factors and effects explored in this thesis.
(A) The effect of the interface on the use of the learning system
I am interested in looking at the effect that different features in the OLM have on how and how much the learner uses the system. I call the total combination of these the system activity and range:
• the engagement with the practice content, which refers to the amount of learning activi-ties (examples, problems, etc) viewed and solved, and the pattern of engagement during the term (e.g., how regularly the system is used in the term);
• the navigation refers to how students navigate the system and that can be expressed in multiple indicators such as patterns of navigation in different types of content, rates
of times spent in navigating and viewing content, rates of content selected vs. content completed, etc.; and
• the performance in self-assessment content (questions, problems) such as success-rates.
The system activity variables of engagement, navigation and performance are introduced and described in Section 5.3, chapter 5.
Two research questions (RQ) are stated, according to the two different features explored of the OLM interfaces. The first RQ looks into the effects of using social comparison features in a OLM.
RQ 1 What are the effects of an OLM with social comparison features (or OSLM) compared to an individual-view OLM on system activity?
The second RQ looks into the effects of adding fine-grained information to the OLM:
RQ 2 What are the effects of including fine-grained OLM and OSLM on system activity?
(B) The role of Individual Differences
As explained before, in the context of Self-Regulated Learning, individual differences gain special relevance, when analyzing the effects of tools such as Open Learner Models. Individ-ual differences range over a number of different factors that describe learners. In my work, I focus on relevant individual differences in the context of Self-Regulated Learning such as previous knowledge and learning motivation. The research question is stated as follows:
RQ 3 How do individual differences influence the effects of the OLM on system activity?
(C) The effects on Learning Motivation
Learning motivation literature states that motivational factors are not static and can change as a result of positive or negative learning experiences [Grant and Dweck, 2003], thus Learning Motivation is both an influencing factor and an outcome of the learning experience. As outcome, learning motivation may be influenced by all the factors that influence the
learning experience: the individual differences, specifically the initial level of motivation; the exposure to the interface, which provides metacognitive support; the interaction with content material and all the other learning activities outside the use of this system. In this thesis, I focus on how system activity and different interfaces (OLM, OSLM, fine-grained components) affect motivation, thus research question 4 is located in two places in Figure2.
RQ 4 How does the use of a learning system featuring OLM, OSLM and fine-grained ele-ments affect motivation?
1.5 THESIS ORGANIZATION
This thesis is organized as follows. Next is chapter 2, which presents related work from seminal and varied research on Open Learner Models, as well as work that relates OLM to theories of Self-Regulated Learning and Learning Motivation. The goal is to help narrow the focus of OLM and provide grounds for studying OLM from the perspective of Self-Regulated Learning.
Chapter 3 presents Mastery Grids, our Open Learner Model and multi-type smart content architecture. A general view of the system, its visual interface, and the learning material that is contained in it is followed by a description of its technical architecture that allows independent smart content to be integrated on two levels: as accessed through the Mastery Grids, and when monitored in terms of knowledge progress.
Chapter 4 presents previous studies we have conducted using Mastery Grids and our findings on the effects that the Open Learner Models and the Open Social Learner Model produce in terms of engagement, navigation, and performance with the practice system. Three studies, previously published in relevant conferences, are summarized. Findings of these prior studies serve as a starting point to draw hypotheses and extend an exploration of the system.
Chapter 5 refines the research framework of this thesis, complementing research questions with expectations that connect prior research with theoretical foundations. This chapter also offers an overview of the studies depicted in the following chapters, along with a description
and grounding of the individual difference measures and variables that are used across all the studies, including log variables, performance tests, learning motivation questionnaires, and social comparison orientation questionnaires. I have set this information aside to avoid repeating common details in later chapters.
Chapter 6 presents a semester-long large classroom study with a between-subjects design in which Mastery Grids is provided in two versions, with and without social comparison features. This study was performed in a large python programming course and focuses on exploring the social dimension of a coarse-grained OLM. The large size of the study allows it to include individual differences in the analyses, with reasonable statistical power.
Chapters 7 and 8 present the design, construction, and initial evaluation of the Rich-OLM through two controlled user studies. The Rich-OLM is an extension of Mastery Grids which includes both coarse-grained and fine-grained visual and interactive features. The process followed for designing this Rich-OLM is contained in chapter 7. It includes interviewing students and then performing a laboratory study, in order to choose a visual representation of the fine-grained OLM. Chapter 8 describes a second controlled laboratory study, in which three variations of the Rich-OLM are compared.
In chapter 9, I present another semester-long classroom study performed in a large python programming course. This study compares three variants of the Rich-OLM, thus exploring the fine-grained OLM and contributing to answer the research questions.
Chapter 10 offers a set of analyses across the studies of chapter 6 and chapter 9. Although the two studies presented in chapter 6 and 9, respectively, are similar, there were changes in the course content, grading process, and deployment of the study. These differences prevent me from doing a straightforward cross-studies analysis. However, some relative comparisons still accomplished the goal of complementing my previous observations and findings, related to the research questions.
2.0 BACKGROUND AND RELATED WORK
2.1 OPEN LEARNER MODELS
In traditional adaptive and personalized computed-based learning environments a User Model captures individual aspects, preferences, and learning progress of the student, al-lowing the system to perform adaptation and personalization tasks [Brusilovsky and Mill´an, 2007]. Open Learner Models (OLM), also called Open Student Models, provide the learner with some sort of representation of this internal model aiming at promoting reflection and encouraging self-regulated processes. According to [Bull and Kay, 2007], OLM can support a variety of aspects: “improving learner model accuracy by allowing the learner to make con-tributions to their learner model; promoting learner reflection through confronting students with representations of their understanding; facilitating planning and / or monitoring of learning; facilitating collaboration amongst learners; facilitating competition amongst learn-ers; supporting navigation; the right of access to information stored about oneself; learner control over and responsibility for their learning; trust in the learner model content; formative assessment; summative assessment.”
Different types of OLM have been explored, and [Bull and Kay, 2010] offered a review. The most common OLM is related to the representation of knowledge or learning progress of the learner. Researchers have explored different representations ranging from overall knowledge skillmeters (also called skillometers) [Mitrovic and Martin, 2007], to detailed knowledge elements [Kay and Lum, 2005], and structured representations such as treemaps [Brusilovsky et al., 2011] and concept-maps [Rueda et al., 2003, P´erez-Mar´ın et al., 2007, Kumar and Maries, 2007]. Different representations of OLM are shown in the previous chapter in Figure 1. Different representations of the OLM at different levels of complexity,
or using different visualization approaches may serve different purposes, such as providing an overview of progress, showing conceptual relationships, or highlighting misconceptions that the learner may have [Bull and Kay, 2016].
Presenting visualizations of the learning related information is an idea that is not exclu-sive of the OLM area. Learning analytics has gained attention in recent years [Verbert et al., 2014]. While learning analytics exploits diverse data of learning records, benefits from the big data phenomenon, and focuses extensively on providing the learning data to the institu-tion [Siemens and Long, 2011], Open Learner Models use informainstitu-tion that is generated by an intelligent system capable of making inference of the learner competencies [Bull et al., 2015].However, the distinction between OLM and Learning Analytics is blurry. In fact, as expressed by Bull and Kay [Bull et al., 2015], “Open learner model visualisations could be seen as a specific type of learning analytics, in that the visualisation is of the learner model.” There is no doubt that these two areas present opportunities for synergy. For example, OLM could provide knowledge estimations to feed learning analytics dashboards, and OLM representation could be improved using visualization techniques and approaches explored in the learning analytics field.
An important concern related with OLM is how to represent the information of the User Model, which in some cases can be fairly complex, in an understandable manner [Bull, 2012, Law et al., 2015]. While some studies have found that simple indicators likeskillometers are preferred by students [Duan et al., 2010], other studies have found support for more complex representations such as concept-maps [Maries and Kumar, 2008]. Moreover, it has been proposed to offer multiple OLM views, from simple to detailed to structured views, giving options satisfying different students’ preferences [Bull et al., 2010,Duan et al., 2010,Conejo et al., 2011]. For example, Flexi-OLM offers the learner visualizations of prerequisite-based concept-maps, hierarchical representation of concept details, and hierarchical representation of the course organization, among others [Mabbott and Bull, 2006]. Our previous work on a questionnaire study of a wide variety of visualizations from different systems found that students expected structured visualizations such as Prerequisites and Hierarchical Tree (from [Mabbott and Bull, 2006]) to best support the task of identifying what to work on next [Bull et al., 2016]. However, it was unclear why students might prefer these representations over
other structured views such as concept maps. Other work has taken the issue of complexity by extending the OLM with more elaborate features such as indicators of effort, progress or working style which offer pre-digested interpretative meaning [Papanikolaou, 2015]. Since OLMs show information that is based on estimations made by the system (knowledge), it necessarily conveys levels of uncertainty, which can be addressed using techniques borrowed from the information visualization field [Epp and Bull, 2015].
Beyond the role of visualizing the learner model, OLM can also incorporate different levels of interactivity. One approach is related to make the OLM into a navigational tool [Papanikolaou et al., 2003, Long and Aleven, 2013a, Hsiao et al., 2013], which is closely related to the area of adaptive navigation support [Brusilovsky, 2003], because the user model is used to generate indicators that are included in the interface to support guidance [Brusilovsky et al., 2004b,Hsiao et al., 2010]. A different approach of interactivity deals with OLM that is editable by the learner [Kerly and Bull, 2008, Mabbott and Bull, 2006]. More-over, some systems implement OLM that are entirely constructed by the learner [Mabbott et al., 2007, Cimolino et al., 2004].
Open Learner Models can also be opened to others. For example, OLM can show peer models to the learner, or letting the teacher inspect the models of the students [Bull and McKay, 2004, Rueda et al., 2003, P´erez-Mar´ın et al., 2007]. The review of [Bull and Kay, 2010] distinguished different approaches that incorporated this social dimension into the OLM. There is work inclined to construct group models, where group interactions are visu-alized to support collaboration and assessment of the collaborative work [Kay et al., 2006, Up-ton and Kay, 2009, Bull and Vatrapu, 2011].
Other approaches have explored awareness, social navigational support, and social com-parison effects as a result of showing the models of other learners individually or aggre-gated [Brusilovsky et al., 2004a, Linton and Schaefer, 2000, Shi et al., 2014, Hsiao et al., 2013,Hsiao and Brusilovsky, 2012,Brusilovsky et al., 2015], which has been called Open So-cial Learner Model (OSLM), or Open SoSo-cial Student Model (OSSM). The idea behind this approach to OSLM is that exposing the model of others will produce a competitive effect that has shown positive effects in encouraging participation in online communities [Vassileva and Sun, 2007], or stimulating activities in learning environments [Burguillo, 2010].
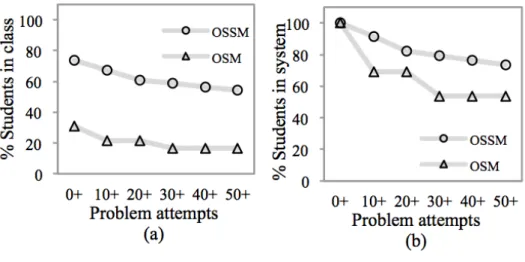
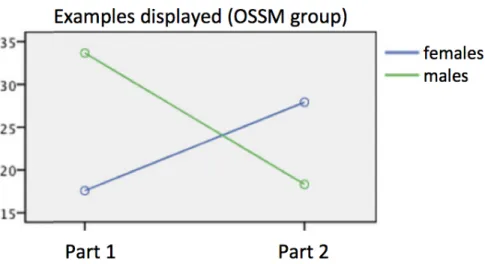
Con-sistently, OSLMs have demonstrated that they could boost system engagement and affect navigational patterns. For example, the work of [Hsiao et al., 2013, Hsiao and Brusilovsky, 2012, Falakmasir et al., 2012] in different studies consistently found that by showing the models of other learners, students covered more topics in the system, reached higher success rates in self-assessment problems, and that strong students went ahead in the course topics guidingweak students who followed later. Our later work confirmed these findings and added other components to the analyses, revealing different effects. For example, in [Brusilovsky et al., 2015], we showed how the experimental group, which was exposed to social comparison visualizations, presented higher rates of system usage, higher learning effectiveness ([Paas and Van Merri¨enboer, 1993]), and interaction effects of gender. Recent work has also shown how the social comparison features accounted for better completion rates in MOOCs [Davis et al., 2017]. Other recent work has also investigated OSLM from the broader perspective of Learning Analytics. For example, the recent work of Shi and Cristea [Shi and Cristea, 2016] incorporated visual indicators of different learning related information such as learning paths and learner contributions, into a multifaceted OSLM.
While we have repeatedly demonstrated positive uses of OSLM in classroom studies, our past work explored a relatively simple visualization of the learner progress using a coarse-grained representation based on topics. My thesis focuses on taking this exploration further, and studying the effects of OSLM combining coarse-grained and fine-grained representations. In general OLMs are evaluated in terms of engagement, guidance, metacognition, and satisfaction, i.e., the extent to which an OLM engages students to use the learning system [Brusilovsky and Sosnovsky, 2005, Brusilovsky et al., 2015, Hsiao and Brusilovsky, 2012], guides students to better content [Brusilovsky et al., 2004b,Loboda et al., 2014,Hsiao et al., 2010,Mitrovic and Martin, 2007], facilitates awareness and reflection about knowledge [Bull and Kay, 2013, Lazarinis and Retalis, 2007, Bull et al., 2003, Dimitrova et al., 2001], and the extent to which learners find it useful [Mabbott and Bull, 2004, Mazzola and Mazza, 2010] or desirable [Bull, 2004]. The impact on learning outcomes or learning performance is limited or indirect, because an OLM is a tool that supports learning metacognition [Bull and Kay, 2013], but is not the content material or the tutoring tool itself. However, some researchers have encountered positive learning effects of using OLMs. For example, [Kumar
and Maries, 2007] used a concept map representation and found evidence that students might learn concepts from OLMs which were not covered by the learning tutor. The work of [Mitrovic and Martin, 2002, Mitrovic and Martin, 2007] found that a simple representation of an OLM had a positive impact on weak students’ performance measured by post-test. They also found that strong students (more-able students) showed higher self-assessment skills when using OLMs which translated into better selection of problems to work with.
Other more recent work has considered the evaluation of OLMs from the perspective of Self-Regulated Learning (SRL), and supported the claim that OLM can enhance SRL pro-cesses of self-assessment, planning and motivation [Long and Aleven, 2017,Law et al., 2017]. However, the incorporation of factors such as motivational traits is rare in the literature of digital learning systems. In this context, my thesis work contributes to the literature of OLM with the exploration of the role of Learning Motivation together with other factors such as prior knowledge.
2.2 SELF-REGULATED LEARNING AND LEARNING MOTIVATION
Self-Regulated Learning and Learning Motivation theories are relevant to my work because they offer theories and frameworks which serve the understanding of the learning experience phenomenon, particularly when the learner is exposed to learning opportunities that require self-regulation (e.g., when a learning system is offered in a non mandatory way.) Moreover, this background becomes more relevant if the OLM related tools are specially designed to support the self-regulation process.
Self-Regulated Learning (SRL) is a positive and desirable condition that defines a learner as an active participant who monitors and applies strategies to control her own learning pro-cess cognitively, meta-cognitively, and emotionally [Zimmerman, 1990b]. Zimmerman sum-marizes three dimensions in which SRL has been studied and considered: (i) the dual focus in self-regulation process and strategies targeting those processes, (ii) the key role of continu-ing feedback enablcontinu-ing SRL to happen, and (iii) the interdependence between motivation and self-regulating processes [Zimmerman, 1990b]. SRL and motivation are interdependently
related. For example, the social cognitive view of SRL focuses on self-efficacy, a measure of self-regulation, which is considered to be an important force behind motivation [Bandura, 1986]. Other authors have confirmed the positive relation between self-efficacy and learn-ing performance [Zimmerman, 1990b] and demonstrated its relations to other motivational elements such as goal-setting [Schunk, 1990].
Learning motivation is framed from different perspectives and with different emphases, and includes general intrinsic motivation such as “fascination” [Moore et al., 2011], self-beliefs [Dweck, 2000], self-efficacy [Zimmerman, 2000], competency-beliefs [Moore et al., 2011], val-ues, and goal-orientation [Elliott and Dweck, 1988], among others. Theoretical frameworks have been put forward to articulate these factors and relate them to learning performance, or more generally, to the learning experience. One such framework is the Achievement-Goal Orientation Framework [Elliot and Murayama, 2008]. This framework proposes that the fac-tors that influence motivation, e.g., beliefs, values, intrinsic motivation, induce the learner to embrace different goal orientations when facing a learning activity. The goal orientation could be defined as Mastery goal orientation or Performance goal orientation, and has a “valence” that could be approach or avoidance. Then accordingly, four different motivation orientation exist: Mastery-Approach oriented students pursue learning, while Performance-Approach oriented students want to demonstrate mastery and they are usually more sensitive to comparison and scores. Mastery-Avoidance students avoid achieving less than what they think they can achieve, and Performance-Avoidance students avoid to perform worse than others or receive lowest scores [Elliot and Murayama, 2008]. Since the goal orientations “encapsulate” diverse motivational factors that internally explain them, the framework is especially relevant to my work: it allows me to focus on the effect of motivation at different OLM interfaces, rather than elaborate on the internal interplay of the motivational factors, which is out of the reach of my work. Moreover, the framework allows to make direct associ-ations between the motivation orientassoci-ations and the system that is the subject of study in this thesis. For example, the social comparison features of the system are expected to generate a competitive effect that will be stronger on students that are highlyPerformance oriented. In my own preliminary work I showed evidence supporting this: the level of engagement with Open Social Learner Model was positively correlated to changes in motivation factors such
as Performance-Approach, while this correlation didn’t seem to hold for students engaged in OLMs without social comparison features [Guerra et al., 2016].
Researchers have also studied the factors that can foster different achievement-goal orien-tations, suggesting that Mastery oriented environmental factors, such as an environment sup-porting autonomous work, can foster the adoption of Mastery goals [Ciani et al., 2010], while Performance oriented elements can account for the adoption of Performance goal [O ´Keefe et al., 2013]. Research has also established relationships between the different goal orien-tations. For example, although Mastery orientation and Performance orientation seem to represent opposite values, they can coexist [Ames, 1992]. A student can present high lev-els of performance and mastery orientation goals at the same time. These last elements of the achievement-goal orientation are important for my work because they support the idea that a learning system with performance and mastery oriented features could affect these motivational orientations of the students.
2.3 SOCIAL COMPARISON ORIENTATION
An important aspect explored in my work relates to providing the learner model to other learners, which is called Open Social Learner Model (OSLM). The main idea of OSLM is that the learner can compare her achievements to the achievements of other learners individually or in a group. Social comparison is a well-studied area in psychology. The core of this idea is that by being able to compare to others, a person may adopt different behaviors and set different thresholds for evaluating her opinions and abilities [Festinger, 1954], and that this effect is stronger when comparison is made with similar or known people [Cialdini et al., 1999]. The importance of social comparison in social sciences is considerable and [Buunk and Gibbons, 2007] states that social comparison “has developed from a focused theoretical statement on the use of others for self-evaluation into a lively, varied, and complex area of research encompassing many different paradigms, approaches, and applications.” Researchers have used the ideas of social comparison in different areas including the virtual world. For example, social comparison has been applied successfully to increase participation
in online communities [Harper et al., 2010]. The study of social comparison in educational settings is also important. While researchers have put social comparison in the center of the idea of Social Learning Environments [Vassileva, 2008], the effects of manipulating social comparison have shown to be beneficial in some settings [Huguet et al., 2001], and detrimental in others, for example, when students compete instead of cooperate [Buchs and Butera, 2009]. These contradictory findings raise interesting questions about how to effectively use social comparison in learning systems such as the one featuring OLM in this thesis.
Learning Motivation theories also connect to social comparison. For example, achievement-goal researchers explained that Performance oriented learners are prone to com-pare to others [Elliot and Murayama, 2008], and suggested that the positive or negative effect of performing upward or downward comparisons was mediated by the goal orientation of the learner [Grant and Dweck, 2003].
3.0 MASTERY GRIDS OSLM
The Mastery Grids system is an attempt to design an intelligent interface for accessing learn-ing content that provides support for Self-Regulated Learnlearn-ing (SRL) and allows learners to monitor their course progress. At its core, it follows earlier work that integrated content navigation with OLM-based knowledge progress visualization [Hsiao et al., 2013]. To com-plement the benefits of OLM, Mastery Grids (MG) also engage the power of the Open Social Student Model by incorporating visualization based on the models of other students. The MG interface presented below adds several features to its first version presented in [Loboda et al., 2014].
A basic version of the interface is shown in Figure 3. The interface organizes the course as a sequence of cells representing the topics of the course, in this case of a Java programming course with topics such as Variables, Primitive Data Types, Constants, etc. Each topic cell can be clicked allowing the learner to access content pieces oractivities. Each activity is also represented by a slightly smaller cell that can be clicked to display the content activity on the screen. When the learner completes an activity, its corresponding cell is painted green and contributes to darken the cell of its topic. In this way, darker topic cells mean the learner has more activities completed on that topic. Mastery Grids can be configured to use different colors to represent the progress. In the first reported work [Loboda et al., 2014] we used shades of purple and in a more recent work, and the work reported in this thesis, we used shades of green.
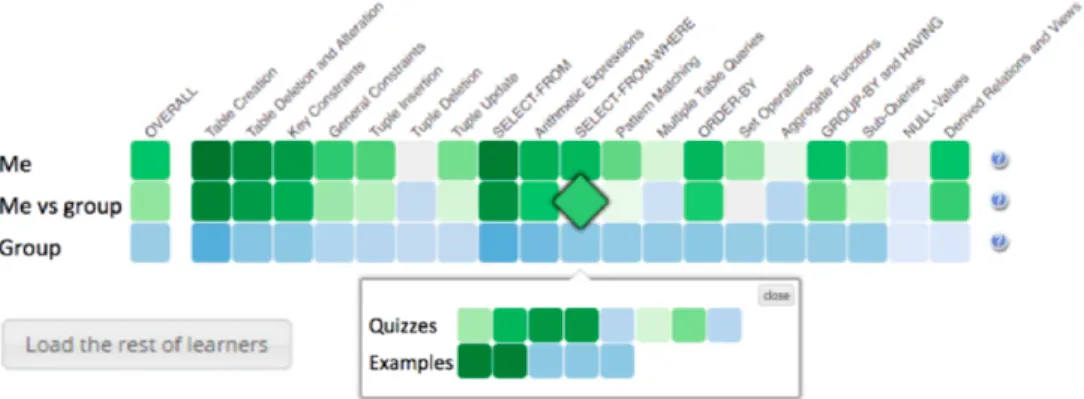
The interface has been designed to allow social comparison features which basic version is shown in Figure4. The grid now has several rows. There are three rows in the main grid.
Figure 3: Basic Mastery Grids interface.
The first row (Me) represents the knowledge progress of the learner and is the same row of the basic interface shown before. The third row represents the progress of the rest of the class, which we label Group aggregating the progress of the other learners who have logged into the system at least once. In this row, we use different color shades, and we have chosen blue. The second row (Me vs group) shows a comparison between the learner and the group and its cells become green if the learner has a higher knowledge progress in the topic, blue if the group has higher progress, or remains gray if the learner and group have the same level of progress. The intensity of the color represents the intensity of the difference.
Below the main grid with three rows there is a grid with a set of thinner rows representing the progress of all peers individually and ordered top to bottom according to the level of progress (higher at the top). Here each peer is represented also with shades of blue and the learner with shades of green. Neither names, nor any identifier for the learner is shown, and only the row corresponding to the learner (in green) is labeled as “Me ->” and showing the position number of the learner in the ranking list. To speed up the interface loading, the ranked list of peers is only shown when clicking on the button “Load the rest of the learners,” which is located below the 3rd grid and does not appear in Figure 4.
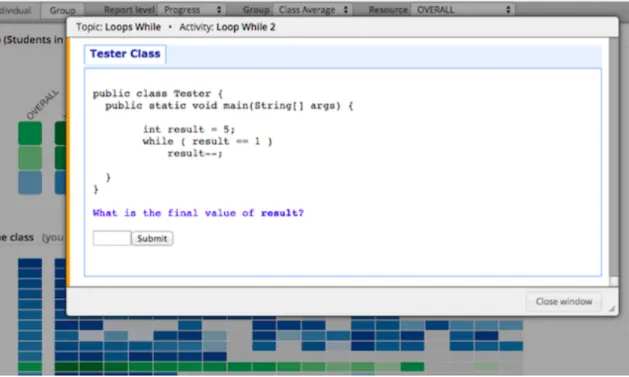
By clicking on any topic cell in the interface, the user can access the practice content of this topic, shown as activity cells organized in rows by content type (number 5 in Figure 6). By clicking on an activity cell, the content is loaded in an overlaid window. Figure 5shows
Figure 4: Mastery Grids with social comparison features.
the overlay window when the learner has opened an activity. The interface is shaded out to stress the overlay window.
Since the system can include access to activities of different type (Figure 3 show three types of contentQuizzes,Examples, andAnimated Examples), the interface can be configured to display more details and levels of aggregation. The full interface of the Mastery Grids system (Figure 6) follows the same idea than the simpler version of the interface, and now each row is “opened” into a grid showing different aggregations of progress information. This means that each row shown in Figure 4 is represented as a grid in the full interface shown in figure 6. In all grids, columns represent topics and rows represent different types of content (such as problems, examples, or animations) maintaining consistency with the simpler version of the interface. The first grid (1 in the Figure 6) shows an extended OLM that visualizes the learner’s own progress over several kinds of content, and where the first row (OVERALL) represent the aggregated information. The third grid (number 2 in Figure 6) represents the average progress of the reference group using a varying density of blue color. A combo box in the menu bar allows the student to use the whole class, or just the top students, as a reference group (number 7 in Figure6). Second grid (number 3 in Figure
6) is the comparison grid showing the difference between the learner and the group. When the group has a higher progress than the learner on a specific kind of content in a specific topic, the corresponding cell in the second grid becomes blue. Otherwise, it becomes green. In the bottom part (number 4 in Figure 6), a progress grid for each of the students in the group is shown (with the top progressing students shown first). As mentioned before, the list does not show the names of the students. To be consistent with the colors used in the first grid, each peer grid is represented in shades of blue and the learner is represented in shades of green, which also facilitates locating the learner in the list. Figure 6 shows the learner in the 3rd position of the list.
To allow the exploration of a broader design space, different interface components can be loaded with different combinations. A selector widget in the menu bar allows students to select among different progress visualizations for the different content types (number 8 in Figure 6). The user can choose a full view in which each grid has separate rows for each content type (as shown in Figure 6), and can also select to display averages by the type of content (for example, showing only progress in the examples), or an overall view where all the three first grids are collapsed in one grid with one row for the learner progress, one row for the comparison, and one row for the group progress, as shown in Figure 4. The overall view mode is set as the default view. In addition, all comparison features can also be completely hidden by clicking the button “Individual” (number 6 in Figure 6), which leaves only the personal part of the interface visible, as shown in Figure 3. The Mastery Grid interface can be configured to hide or show the menu controls (numbers 6, 7, and 8 in Figure6), as well as to enable or disable the social comparison features for a specific group or for individual users. For example, this allows us to show social comparison features only to some students, or to enable all features for the instructor.
3.1 SMART CONTENT IN MASTERY GRIDS
Mastery Grids integrates different types of content activities which are online “smart” con-tent from different concon-tent providers. “Smart” concon-tent [Brusilovsky et al., 2014b]
interac-Figure 6: The full Mastery Grids interface. A menu bar contains controls to change the view of the group or the details shown. Circled numbers have been added in the image to support explanations.
tively engages students, provides mechanisms to store and retrieve student activity data, and ultimately, incorporates feedback mechanisms. Different type of activities is included in different domain courses implemented in Mastery Grids. We have implemented courses for Java, Python and SQL programming. In Java and Python programming course we have used the content of the type programming problems or parameterized problems (also called questions or quizzes) [Hsiao et al., 2010], annotated examples [Brusilovsky and Yudelson, 2008], and program animations (or animated examples) [Sirki¨a and Sorva, 2015]. In Python programming course we also had used Parsons problems [Parsons and Haden, 2006]. In SQL programming course we have used SQL problems [Brusilovsky et al., 2010] and anno-tated examples [Brusilovsky and Yudelson, 2008]. Each of the content types is shown in the following.
3.1.1 Annotated Examples
Annotated examples provide interactively explorable text explanations of code examples. Figure 7 illustrates an annotated example in the topic “Logical Operators” in a Python programming course. A green bullet next to a line indicates that an explanation is available for that line. Once the student clicks on the line or the green bullet next to it, the explanation opens up below the line. Each explanation emphasizes important concepts in the line or the result of the line being executed.
Annotated examples are delivered by a system called WebEx [Brusilovsky and Yudelson, 2008]. All interactions of students with these examples are reported to the user modeling server. The reported data includes information about each example’s lines that the student has viewed, along with the timestamp of those activities. We used this data in our analysis to evaluate the use of examples and their impact on student performance. Currently, we have developed annotated examples for Java, Python and SQL programming courses.
Figure 7: An instance of an annotated example loaded from Mastery Grids. Here, the student has clicked on the third line and an explanation is shown below the line that demonstrates the result of executing this line in the example program.
3.1.2 Animated Examples
Animated examples (Figure8) provide an expression-level visualization of the code execution. The aim of these examples is to visually demonstrate how various programming constructs are executed by showing how each execution step changes the program state. These examples are implemented with the Jsvee library [Sirki¨a, 2016] and are delivered using the Acos content server which is located in Finland.
Animated examples can visualize arithmetic operations, assignment statements, condi-tional statements, different kind of loops, functions with parameters and return values, lists and indexing, classes and instances, and references. Currently, we are integrating animated examples for Java and Python programming course.
Figure 8: An animated example in the Master Grids system. The right panel shows the state of the stack frame and the output printed in the console when the program execution reaches the last line of the example.
3.1.3 Parameterized Problems
Semantic problems are parameterized exercises that test student comprehension of program execution by asking them about the output of the given program or the final value of a specific variable after the program is executed. For python domain, these problems are generated by the QuizPET system (Quizzes for Python Educational Testing), which is a re-design of QuizJET, an earlier Java-based system [Hsiao et al., 2010]. Since these exercises are parameterized, students can practice the same problem several times, each time with randomly selected values for the problem’s parameter.
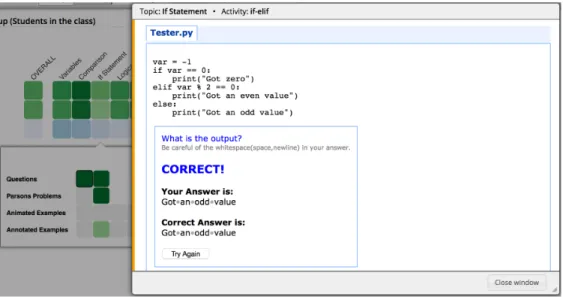
Figure 9 shows an instance of a parameterized problem for the “If Statement” topic in python. The student writes his/her answer in the text box area below the problem. Once the student’s answer is submitted, QuizPET evaluates it and presents feedback to the student, along with the correct answer. Figure 10shows the feedback presented to the student when the answer is evaluated as correct. The student can repeat the same problem with different parameter values by clicking on the “Try Again” button.
Figure 9: An instance of a parameterized problem for python in the Mastery Grids system.
In the domain of SQL programming parameterized problems are served by the SQL-Knot system [Brusilovsky et al., 2010]. An instance of this type of problems is shown in Figure 11.
3.1.4 Parsons Problems
Parsons problems are code construction exercises in which students do not need to type code. The original idea presented by Parsons and Haden [Parsons and Haden, 2006] describes the exercises so that there is a limited number of code fragments available in a random order. To solve the exercise, the student must construct the program described by putting the fragments in the correct order. Figure 12 shows an instance of Parsons problems in the Mastery Grids system.
Parsons problems are implemented with a JavaScript Js-parsons library provided by Ihantola and Karavirta [Ihantola and Karavirta, 2011] and delivered by the Acos server. For Python exercises, the library requires correct indentation. Therefore, the fragments must
Figure 10: Feedback shown to the student after the system evaluates the submitted answer.
Figure 12: An instance of a Parson problem in the Mastery Grids system. The student assembles the solution to the question (written at the bottom) in the right side.
not only be in the correct order, but must also be indented correctly. The Js-parsons library also supports distractors; i.e., when not all the given fragments may be necessary for the solution. The fragments may also contain toggleable elements, which are shown as gaps. For these fragments, the student must select the correct operator to fill the gap (see the segmented squares with question marks ‘??’ in Figure12). In addition to providing feedback based on the positions of the fragments, Js-parsons exercises provide unit tests that can run the solution and check the results against the test cases.
3.2 SYSTEM ARCHITECTURE
This section explains the back side of Mastery Grids: its underlying architecture that makes the integration of several types of smart content possible. Mastery Grids are an attempt to implement the vision of the ACM ITiCSE working group on the use of smart content in com-puter science education [Brusilovsky et al., 2014a]. It brings together several types of smart
learning content that are independent of the host system, fully reusable and hosted by differ-ent physical servers that are, in fact, located in differdiffer-ent countries. For example, Animated Examples and Parsons problems are hosted on theAcos server1 located in Helsinki, Finland.
Parameterized problems and Annotated Examples are served by specialized QuizPET and WebEx content servers, respectively, that are located in Pittsburgh, USA. In this context, the Mastery Grids interface works as aaggregator that contains links to the content that can belong to different content servers or different applications, and transparently delivers the selected content to the students. The students might not be aware of which external system actually provides each type of content, what they see is a holistic system with the Mastery Grids interface and diverse learning content.
The ability to provide such transparent access to multiple kinds of reusable content while supporting data collection and personalization is supported by the Mastery Grids infrastructure. This infrastructure is an extension of the ADAPT2 infrastructure2, which
extends the early KnowledgeTree framework [Brusilovsky, 2004]. The Mastery Grids in-frastructure includes several types of components that inter-operate by using standardized communication protocols which are summarized in Figure 13. The main components are smart content providers such as several content servers, the Mastery Grids interface with its back-end services called Aggregate, and student modeling servers, such as the CUMULATE server [Yudelson et al., 2007].
1http://acos.cs.hut.fi/