Texture Analysis using GLCM & GLRLM Feature
Extraction Methods
Prof. Mrs. K. ChandraPrabha
1, C. Bharathi
21Associate Professor & Head of the Department, Department of Computer Science and Engineering, ACGCET, Karaikudi, Tamil
Nadu.
2PG Student, Department of Computer Applications, ACGCET, Karaikudi, Tamil Nadu.
Abstract: Textures are one of the most important features in computer vision for many applications. Texture Feature Extraction is a method of capturing visual content of images for indexing & retrieval. General features such as extraction of color, texture and shape or domain specific features. GLCM to extract statistical texture features such as Contrast, Correlation, Energy, Entropy and Homogeneity.
GLRLM to extract run length features such as SRE, LRE, GLN, RLN, LGRE and HGRE. Constructing combinations of the various extraction methods (GLCM & GLRLM) to get the data with sufficient accuracy. The experimental results demonstrated that texture feature extraction based on the KNN technique achieved a better image recognition, and the accuracy of classification based on this method has been significantly improved and that it requires less computation time efficiently used for real time Object Tracking Applications.
Index Terms: Texture, Feature Extraction, GLCM, GLRLM, KNN.
I. INTRODUCTION
Image processing is a method to perform some operations on an image, in order to get an enhanced image or to extract some useful information from it. It is a type of signal processing in which input is an image and output may be image or characteristics/features associated with that image. Nowadays, image processing is among rapidly growing technologies. It forms core research area within engineering and computer science disciplines too.
Textures are characteristic intensity variations that typically originate from roughness of object surfaces. Generally it can be defined as a regular repetition of elements or pattern on a surface. These texture images vary in brightness, color, shape, size, etc. Texture analysis plays an important role in texture classification. Texture analysis can be defined as a set of mathematical procedures used to extract feature information from the input texture image. In our work, statistical approach is considered for texture analysis. They provide information about the special distribution of pixels in an image. Statistical approach yield details about the characteristics of texture, whether it is smooth, coarse, fine, etc.
GLCM estimates image properties related to second-order statistics which considers the relationship among pixels or groups of pixels (usually two). A simple one-dimensional histogram may not be useful in characterizing texture features as it is a spatial property.
Hence, this two-dimensional GLCM matrix is extensively used in texture analysis. Four co-occurrence matrices are computed from the Brodatz image by considering distance between pixels to be 1 and the four directions as 0ᵒ, 45ᵒ, 90ᵒ and 135ᵒ. For each
co-occurrence matrix four texture features can be extracted namely Contrast, Correlation, Energy, Entropy and Homogeneity. The GLRLM is based on computing the number of gray level runs of various lengths. A gray level run is a set of consecutive and collinear pixel points having the same gray level value.
Four run length matrices are computed from the Brodatz image by considering distance between pixels to be 1 and the four directions as 0ᵒ, 45ᵒ, 90ᵒ and 135ᵒ.
II. BLOCK DIAGRAM
Fig. 1: Block Diagram of the Brodatz Texture Classification
It contain two phases such as Training phase and Testing phase. In training phase First User can choose the folder of images from the Brodatz datasets. The images are in the form of RGB format using filters to convert RGB to Gray image and to remove noise. Using feature extraction methods to extract the GLCM features as contrast, correlation, energy, entropy, homogeneity and GLRLM features as SRE, LRE, GLN, RLN, LGRE and HGRE. These features are stored in feature database as (.mat) file format. The next phase, the user select a test image, it features can be extracted and classify the regions by comparing training phase data Using KNN classification technique to classify the texture features. Fetch the similar images to predict accuracy.
A. Image Acquisition
The input image is the image of some Brodatz textures with various types and format (jpg) supported by MATLAB. Image with other formats will not be recognized and will display an error message. Preprocessing is necessity whenever the data to be mined is noisy, inconsistent or incomplete. Preprocessing improves the effectiveness of data. The median filter is applied to the images to eliminate the image noise. Normally the images are in the form of RGB format. Then the next step is to convert input image (RGB) to gray image. It used to remove noise. rgb2gray() function that has been found in MATLAB.
B. Feature Extraction
1) GLCM: The Gray Level Co-occurrence Matrix (GLCM) method is a way of extracting second order statistical texture features. It models the relationships between pixels within the region by constructing Gray Level Co-occurrence Matrix. The GLCM is based on an estimation of the second-order joint conditional probability density functions p(i, j | d, θ) for various directions θ =
0, 45, 90, 135°, etc., and different distances, d = 1, 2, 3, 4, and 5. The function p(i, j | d, θ) is the probability that two pixels,
which are located with an inter sample distance d and a direction θ, have a gray level i and j. The spatial relationship is defined
in terms of distance d and angle θ. If the texture is coarse, and distance d is small, the pair of pixels at distance d should have
similar gray values. Conversely, for a fine texture, the pairs of pixels at distance d should often be quite different, so that the values in the GLCM should be spread out relatively uniformly. Similarly, if the texture is coarser in one direction than another,
then the degree of spread of the values about the main diagonal in the GLCM should vary with the direction θ. It represents the
formation of the GLCM of the gray-level (4 levels) image at the distance d = 1 and the direction θ = 0°.
[image:2.595.172.426.641.734.2]Algorithm
a) Step1: Quantize the image data.
b) Step2: Create the GLCM.
c) Step3: Make the GLCM symmetric:
i) Make a transposed copy of the GLCM
ii) Add this copy to the GLCM itself.
d) Step4: Normalize the GLCM.
Calculate the selected Feature. This calculation uses only the values in the GLCM.
2) GLRLM: Gray-Level Run-Length Matrix (GLRLM) is a matrix from which the texture features can be extracted for texture analysis . A run-length is represented by (gl, rl, θ), where gl, rl, and θ are the gray level, run-length, and direction respectively. The run-length matrix is a way of searching the image, always across a given direction, for runs of pixels having the same gray level value. Thus, given a direction, the run-length matrix measures each allowed gray level value into how many times there are runs of, for example, 2 consecutive pixels with the same value. Next it does the same for 3 consecutive pixels, then for 4, 5 and so on. Gray level run-length features are a form of grey level statistical features. Note that many different run-length matrices may be computed for a single image, one for each chosen direction.
R (i, j) = (g (i, j) | i ), 0 ≤ i ≤ Ng , 0 ≤ j ≤ Rmax
where Ng is the maximum gray level and Rmax is the maximum length. Six texture features can be extracted from the GLRLM. These features uses gray level of pixel in sequence and is intended to distinguish the texture that has the same value of SRE and LRE but have differences in the distribution of gray levels.
Algorithm
1) Step 1: Read the Image
2) Step 2: Iterative process for each pixel block window size 7× 7
3) Step 3:Select the pixel with passing through parameters d and θ 4) Step 4: Construct the 255 × 20 matrix in S
5) Step 5: If the selected pixel and consecutive pixels are same, then the position of the selected pixel and d will be replaced by the count in the GLRLM matrix
Table 1: GLRLM Features
C. Classification
The Data Sample file and the Data Training perform and stored into a matrix variable on MATLAB, then the next process is to perform the classification process using KNN. This process performed by comparing the data test (Data Training) with multiple data samples that have been stored before. The process performed by searching the data samples which value that is approaching the data test, if K = 5, then the system will look for 5 pieces of data samples which value approached with the data test, and so also with the others K values. This research will be performed K Nearest Neighbor (KNN) classification process with a value of K = 5, K = 10 and K = 15.
Class = knnclassify (Data Test, Data Sample, Group, K).
1) Step 1: Select ‘C’ cluster centers arbitrarily
2) Step 2: Calculate the distance between each pixels and cluster centers using the Euclidean Distance metric as follows X, Y are the set of data points
3) Step 3: Pixel is assigned to the cluster center whose distance from the cluster center is minimum of all cluster centers
4) Step 4: New cluster center is calculated using
( , ) = ( − )
Where Vi denotes the cluster center, ci denotes the number of pixels in the cluster
5) Step 5: The distance among every pixel and new obtained cluster facilities is recalculated
6) Step 6: If no pixels were reassigned then stop otherwise repeat steps from 3 to 5
III. EXPERIMENTAL RESULTS
We have used proposed algorithm for unsupervised texture classification. The Brodatz's photo album is a well-known benchmark database for evaluating texture recognition algorithms.
[image:4.595.188.424.599.737.2]The KNN algorithm is utilized. Experiments show that proposed algorithm has been used with accuracy rate 76%. The performance of various texture models are analyzed by using statistical parameters such as sensitivity, specificity, accuracy can be computed.
Sensitivity TP/(TP+FN) Specificity TN/(TN+FP) Accuracy (TP+TN)/(TP+FP+TN+FN)
[image:5.595.106.488.226.489.2]TP is number of true positives, FP is number of false positives, TN is number of true negatives and FN is number of false negatives. The performance of the system is examined by demonstrating correct and incorrect patterns. The higher value of both sensitivity and specificity shows better performance of the system. But the proposed algorithm for texture features computation has simple and fast computing scheme.
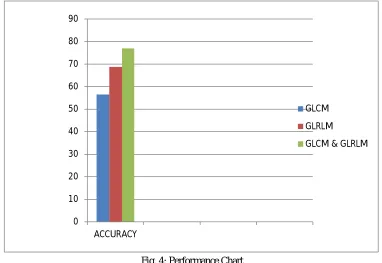
Fig. 4: Performance Chart
Result shows that GLRLM features outperform GLCM features in our area of Brodatz classification. KNN classifier provides better classification accuracy in case of GLRLM features, giving an average classification accuracy of 68.75. But at the same time its classification accuracy based on GLCM features having an average classification accuracy of 56.5%. Combination of GLCM and GLRLM features giving classification accuracy of 76.86%.
IV. CONCLUSION
In this paper we proposed an algorithm for texture feature computation. This scheme is useful in environments where speed is essential calculations, rather than their accuracy. The performance of classifiers for the texture analysis methods are evaluated using various statistical parameters such as sensitivity, specificity and accuracy. From the performance analysis it is found that performance results depend on the datasets and texture images used. Results show that classification using KNN is consistent for both GLRLM features and GLCM features. This study found GLRLM features quite appropriate as compare to GLCM features in the area of Brodatz classification. We plan to improve this algorithm and to exam it using the other databases. Those issues will be explored in our future work.
V. FUTURE WORK
Extend the framework to implement various clustering and classification algorithm to improve the performance of the system. Implement Deep Learning algorithms to improve the accuracy in various applications like Pattern recognition, Object tracking, Defect detection, Face tracking, Disease prediction and etc. Since texture analysis consumes a considerable amount of time for feature extraction there is a scope for optimization also.
0 10 20 30 40 50 60 70 80 90
ACCURACY
GLCM
GLRLM
REFERENCES
[1] Kassnera and R. E. Thornhilla, “Texture analysis: a review of neurologic MR imaging applications,” American Journal of Neuroradiology, vol. 31, no. 5, pp. 809–816, 2010.
[2] R. M. Haralick, K. Shanmugam, and I. Dinstein, “Textural features for image classification,” IEEE Transactions on Systems, Man and Cybernetics, vol. 3, no. 6, pp. 610–621, 1973.
[3] D. C. He and L. Wang, “Texture unit, texture spectrum, and texture analysis,” IEEE Transactions on Geoscience and Remote Sensing, vol. 28, no. 4, pp. 509– 512, 1990.
[4] A. Laine and J. Fan, “Texture classification by wavelet packet signatures,” IEEE Transactions on Pattern Analysis and Machine Intelligence, vol. 15, no. 11, pp. 1186–1191, 1993.
[5] L. Liu and P. Fieguth, “Texture classification from random features,” IEEE Transactions on Pattern Analysis and Machine Intelligence, vol. 34, no. 3, pp. 574– 586, 2012.
[6] Digital Image Processing, R. C. Gonzalez and R. E. Woods Eds., Prentice Hall, Upper Saddle River, NJ, USA, 2008
[7] Suresha, M. and Harisha Naik, T. (2017) A Survey on Image Analysis Based on Texture. International Journals of Advanced Research in Computer Science and Software Engineering, 7, 686-695.
[8] Lu, D. and Weng, Q. (2007) A Survey of Image Classification Methods and Techniques for Improving Classification Performance. International Journal of Remote Sensing, 28, 823-870.