Worcester Polytechnic Institute
Digital WPI
Doctoral Dissertations (All Dissertations, All Years)
Electronic Theses and Dissertations
2018-04-25
Refining Prerequisite Skill Structure Graphs Using
Randomized Controlled Trials
Seth Akonor Adjei
Worcester Polytechnic Institute
Follow this and additional works at:
https://digitalcommons.wpi.edu/etd-dissertations
This dissertation is brought to you for free and open access byDigital WPI. It has been accepted for inclusion in Doctoral Dissertations (All Dissertations, All Years) by an authorized administrator of Digital WPI. For more information, please [email protected].
Repository Citation
Adjei, S. A. (2018).Refining Prerequisite Skill Structure Graphs Using Randomized Controlled Trials. Retrieved from https://digitalcommons.wpi.edu/etd-dissertations/177
Refining Prerequisite Skill Structure Graphs
Using Randomized Controlled Trials
by Seth Akonor Adjei
A Dissertation Submitted to the Faculty
of the
WORCESTER POLYTECHNIC INSTITUTE In partial fulfillment of the requirements for the
Degree of Doctor of Philosophy in Computer Science _____________________________ April 2018 APPROVED: __________________________________________ Professor Neil T. Heffernan, Thesis Advisor
__________________________________________ Professor Joseph E. Beck, Committee Member __________________________________________ Professor Erin Ottmar, Committee Member
__________________________________________ Professor Jacob Whitehill, Committee Member __________________________________________ Professor Ryan Baker, External Committee Member
i
Abstract
Prerequisite skill structure graphs represent the relationships between knowledge components. Prerequisite structure graphs also propose the order in which students in a given curriculum need to be taught specific knowledge components in order to assist them build on previous knowledge and improve achievement in those subject domains. The importance of accurate prerequisite skill structure graphs can therefore not be overemphasized. In view of this, many approaches have been employed by domain experts to design and implement these prerequisite structures. A number of data mining techniques have also been proposed to infer these knowledge structures from learner performance data. These methods have achieved varied degrees of success. Moreover, to the best of our knowledge, none of the methods have employed extensive randomized controlled trials to learn about prerequisite skill relationships among skills. In this dissertation, we motivate the need for using randomized controlled trials to refine prerequisite skill structure graphs.
Additionally, we present PLACEments, an adaptive testing system that uses a prerequisite skill structure graph to identify gaps in students’ knowledge. Students with identified gaps are assisted with more practice assignments to ensure that the gaps are closed. PLACEments additionally allows for randomized controlled experiments to be performed on the underlying prerequisite skill structure graph for the purpose of refining the structure. We present some of the different experiment categories which are possible in PLACEments and report the results of one of these experiment categories. The ultimate goal is to inform domain experts and curriculum designers as they create policies that govern the sequencing and pacing of contents in learning domains whose content lend themselves to sequencing. By extension students and teachers who apply these policies benefit from the findings of these experiments.
ii
Acknowledgement
I will like to take this opportunity to thank my dear wife, Esther, for her continued support and assistance through the years of hard work that has culminated in the work presented in this dissertation. I also appreciate our lovely children Bryan and Kayla for their interest in my work and for the various and sometimes subtle ways in which they have provided encouragement to me. I deeply appreciate my parents Samuel and Sarah Adjei for their love and belief in my ability to do whatever I set my heart to doing. It saddens me that my dad did not live to see the end of this journey he helped me start a few years ago. This dissertation and years of work at WPI would not have been possible without the guidance and support of my advisor, Prof. Neil Heffernan. He, figuratively, held my hand through the challenging and yet exciting experience of graduate school education. I have really loved my time at WPI and working in Neil’s lab, which is why I cannot but thank him for his support. Cristina, Prof Heffernan’s wife, has been equally helpful, giving me pointers and reviewing some of the work that finally resulted in the development and release of PLACEments, the adaptive testing system within which I did most of the work reported in this dissertation. Cristina assisted in recruiting teachers for research related surveys as well as beta testing PLACEments prior to its production release.
I will like to acknowledge the help I received from colleagues like Andrew Burnett, David Magid, Chris Donnelly, Dr. Douglas Selent, Korinn Ostrow and Anthony Botelho for the various forms of support they provided. They were very helpful as peer reviewers of publications and code and, as collaborators on some of the work presented here. Anthony was especially helpful as a collaborator and, in editing my work and making helpful suggestions for improvement.
The ultimate thanks go to Jehovah God for giving me the life and time to carry out this interesting work, despite the many responsibilities I had to shoulder.
iii
Contents
Abstract ... i Acknowledgement ...ii Contents ... iii Table of Figures ... iv List of Tables ... v 1 Introduction ... 1 2 Background ... 43 Refining Learning Maps with Data Fitting Techniques: Searching for Better Fitting Learning Maps 9 4 Refining Learning Maps with Data Fitting Techniques: What Factors Matter?... 23
5 Can Skill Prerequisite Topologies be Accurately Learned Using Deep Knowledge Tracing? ... 34
6 Predicting Student Performance on Post-requisite Skills Using Prerequisite Skill Data ... 51
7 Modelling Interactions across skills: A method to Construct and Compare Models Predicting the Existence of Prerequisite Skill Relationships ... 64
8 A Correlation-Based Method for Inferring Prerequisite Skill Links from Learner Performance Data ... 80
9 Improving Learning Maps using An Adaptive Testing System: PLACEments ... 89
10 Sequencing Content in an Adaptive Testing System: The Role of Choice ... 102
11 Refining Prerequisite Skill Links using Randomized Controlled Experiments in PLACEments .... 114
12 Does It really help to Assign Prerequisites Prior to Learning a new skill? ... 134
13 Conclusion ... 144
iv
Table of Figures
Figure 2-1 An Example Prerequisite skill link ... 5
Figure 2-2 An example prerequisite skill graph ... 6
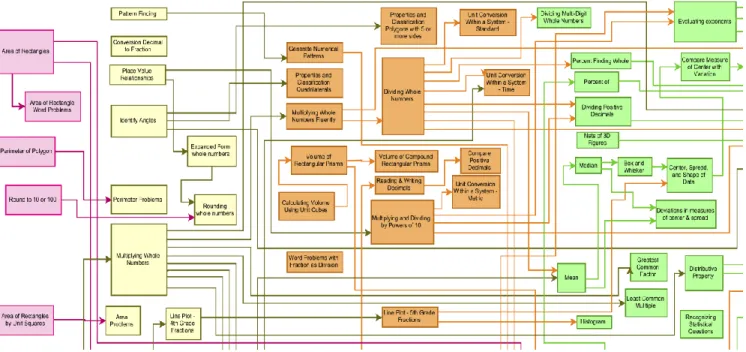
Figure 2-3 Another example graph sourced from [turnonccmath] ... 7
Figure 3-1 The initial learning map that researchers created. ... 13
Figure 3-2 Before and after the merge of the arc between M-1289 and M-1133. ... 14
Figure 3-3 a) The chart of results and b) the graph of the best skill model ... 16
Figure 3-4 Stability of Graph ... 18
Figure 4-1. Example Graph Generated ... 26
Figure 4-2 Creation of Fake Skill. ... 27
Figure 4-3 Effect of guess/slip on learning back the original graph ... 29
Figure 4-4 Effect of Number of Fake Skills on model improvements ... 30
Figure 4-5 Different Graph types for experiment 2 ... 30
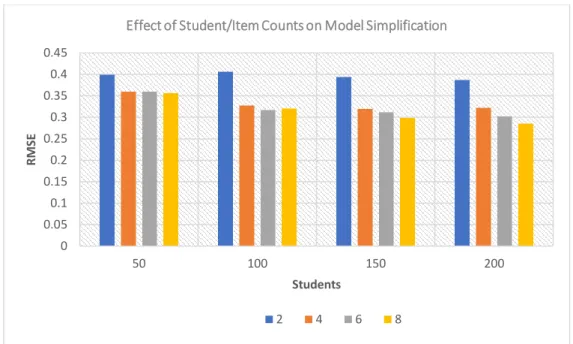
Figure 4-6 Effect of students/items on the model simplification ... 31
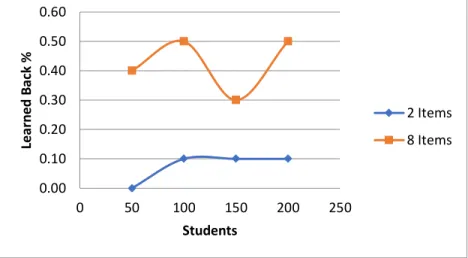
Figure 4-7 Percent of graphs learned back for student ranges 50-200 and 2+8 items per skill... 32
Figure 4-8 Impact of Student Numbers ... 33
Figure 5-1 An Illustration of DKT. ... 38
Figure 5-2 Simulated Graph ... 42
Figure 5-3 Learned Graph from Simulated Data ... 46
Figure 5-4 Learned Graph from Real Data ... 47
Figure 6-1 A Typical Student’s navigation in PLACEments ... 54
Figure 6-2 Sample Teacher Survey question ... 58
Figure 6-3 Percentages of identified good and problematic links ... 59
Figure 6-4 Agreement between mastery speed transformation methods... 59
Figure 6-5 A comparison of model predictions with teacher survey about link strength. ... 60
Figure 6-6 Strength of Methodology. ... 61
Figure 7-1 Sample question from the survey given to teachers and domain experts to help identify strong skill relationships ... 68
Figure 7-2 A comparison of accuracy gain of the models with statistically significant predictions. ... 76
Figure 8-1 Number of links inferred using PCB method compared with Human designed links. ... 86
Figure 8-2 Domain Expert Survey Results ... 87
Figure 9-1 A sample skill graph and a sample student’s response configuration ... 92
Figure 9-2 Sample navigation of the graph for this study ... 93
Figure 9-3 A portion of the prerequisite skill graph designed by a math expert and based on standards from the Common Core Mathematics Standards [52] ... 94
Figure 9-4 Prerequisite Link Strength ... 95
Figure 9-5 Prerequisite Skill Link Strength by knowledge level ... 96
Figure 9-6 Medium and High Knowledge Students' contribution to link strength... 98
Figure 10-1 A sample skill graph and a sample student’s response configuration... 106
Figure 10-2 Experimental Design ... 108
Figure 11-1 Sample Prerequisite Skill Graph. ... 117
Figure 11-2 Drop Prerequisite Skill Experiment Design ... 119
Figure 11-3 “Change Prerequisite Direction” Study design ... 122
Figure 11-4 Order Prerequisites Study Design ... 123
Figure 11-5 A Section of the PLACEments Skill Graph for Middle School Mathematics ... 125
Figure 12-1 Experimental Design – Overall ... 137
Figure 12-2 Options for Student Choice Condition ... 137
Figure 12-3 Prompt for Assign All Remediations ... 138
v
List of Tables
Table 4-1. Example Matrix ... 26
Table 4-2 Student/Guess Impact on Evaluation ... 29
Table 5-1 Summary statistics for generating simulated data ... 44
Table 5-2 List of skills with their corresponding ids from ASSISTments ... 48
Table 6-1 Sample data set. ... 56
Table 7-1 The strong skill pairs as determined by domain experts ... 68
Table 7-2 The results of the PCA analysis. ... 72
Table 7-3 The coefficients and significance values of the generalized components analyzed... 74
Table 7-4 The models constructed from features in the significant generalized components. ... 75
Table 8-1 Possible Permutations of skills in from a set of 3 skills ... 83
Table 8-2 The results of the application of Pruning Criteria ... 86
Table 9-1 A Subset of the List of Skill Links in the prerequisite skill graph. ... 97
Table 10-1 Remediation Completion Rates by Condition ... 110
Table 10-2 Completion Rates and Learning Gains ... 110
Table 10-3 Learning Gains among students with comparable assignment completion rates ... 111
Table 11-1 A summary of Experiments Types available in PLACEments ... 124
Table 11-2 Logistic regression of prior start and completion rates, performance and condition on completion of post-requisite skill assignment (Link 1) ... 128
Table 11-3 ANCOVA of the Effect of Condition on Speed of Mastery of Post-requisite skills... 128
Table 11-4 ANCOVA of the effects of condition on post requisite performance (Link 1)... 129
Table 11-5 Logistic regression of prior start and completion rates, performance and condition on completion of post-requisite skill assignment (Link 2) ... 130
Table 11-6 An ANOVA and ANCOVA of the effects of condition on mastery speed ... 130
Table 11-7 ANCOVA of the Effects of Condition on Other Dependent Measures (Link 2) ... 130
Table 12-1 Completion Rates Per Condition ... 139
Table 12-2 Post-hoc analyses of student choice group ... 140
1
1
Introduction
Prerequisite skill structure graphs have been developed by domain experts over many years, specifying the scope and sequence of knowledge components. They have been represented in several forms including learning trajectories [24, 25, 85] as well as learning maps and pacing guides [98]. Regardless of the overall representation,
each knowledge component represents a given topic or skill in the knowledge domain. In considering middle school math for instance, “Addition of Fractions” and “Multiplication of Mixed Numbers” are two examples of knowledge components that may exist within the graph. These, in addition to other such knowledge components, represent math skills that students need to know at the given grade level defined by the domain experts. The prerequisite skill structure graphs further describe the order in which students in a given curriculum should be taught specific knowledge components in order to effectively build on previous knowledge and improve achievement in those subject domains. A pair of skills are said to have a prerequisite skill relationship between them if one of the skills is a prerequisite to the other (commonly referred to as the post-requisite skill); these relationships could be causal in nature, particularly if these relationships are strong. [73] In other words, when
two skills have a strong prerequisite skill relationship between them, it is implied that knowledge of the prerequisite skill causes faster learning of the post-requisite skill. The importance of accurate prerequisite skill structure graphs can therefore not be overemphasized. Learners’ performance in standardized tests can be attributable to, among other causes, the effectiveness of instruction that learners receive prior to these tests. Specifically, the order in which students progress through content is very important to their success [75], as
measured by performance in standardized tests and preparation for future employment.
In view of the importance of the accuracy of prerequisite skill structures, also referred to as skill topologies, many approaches have been employed by domain experts to design and implement these structures. A number of data mining techniques have been used to infer these knowledge structures from learner performance data. The evolution of the study of prerequisite skill structures using data mining was largely influenced by the inference of the Q-Matrix, a mapping of items to knowledge components. [86] Several of the data mining
techniques that have been employed afterwards use the Q-matrix representation of the mapping between items and knowledge components [12, 86]. Additionally, Deep Learning [67, 100], Learning Factors Analysis [19], and
2
Bayesian Networks and Association Rule Mining [21] have all been employed to refine existing skill topologies
and also to infer new skill topologies.
While the above-mentioned approaches have arguably chalked certain degrees of success, to the best of the author’s knowledge, none of them have been used to make causal claims about the prerequisite relationships among the inferred skills. Randomized controlled trials, sometimes referred to as the gold standard of research [47], have been noted to be the most effective research method to identify causal relationships between constructs
in real life. [97] In view of the apparent failure of the aforementioned methods to make causal claims about the
skill topologies, this dissertation presents motivation for the use of randomized controlled trials for inferring prerequisite skill structures from learner performance data. This motivation is preceded by a presentation of several techniques that this author has used to infer prerequisite skill structure graphs from learner performance data.
In this dissertation, an adaptive assessment and remediation system that uses a prerequisite skill structure graph to identify gaps in students’ knowledge is presented. The system additionally assists students with identified knowledge gaps by assigning them more practice assignments to ensure that the gaps are filled. The relevance of this system to this work is exemplified through the feature that allows randomized controlled experiments to be run on the underlying prerequisite skill structure graph. The results of the experiments allow for causal claims to be made about the relationships among knowledge components. Additionally, a framework for inferring and refining prerequisite skill structure graphs is presented, with the sole aim of assisting domain experts who design these knowledge structures, and students who benefit from well-designed structures.
This thesis is organized into thirteen (13) chapters. In each chapter, related work is presented separately. In view of this, no separate chapter is dedicated to related work or literature review, however chapter 2 presents a brief description of skills and prerequisite skill structures as used in the context of this dissertation. Chapters 3 and 4 present the results of the application of a Bayesian Network-based combinatorial search algorithm to refine an existing prerequisite structure graph. These chapters show the factors that contribute to the effectiveness of such a combinatorial search method. Chapter 5 reports the findings of an investigation in which Deep Knowledge Tracing [67] is applied to infer skill topologies from learner performance data. Chapter 6 illustrates how a simple
3
task of predicting students’ performance in post-requisite skills using learning and performance information on the prerequisite skill was used to infer prerequisite skill relationships among skills. Chapters 7 and 8 describe two different methods that this author employed to infer prerequisite skill relationships between skills. A correlation-based approach for inferring prerequisite skill links is presented in chapter 9. The results of a randomized controlled experiment in which the impact of the order of learning tasks on student assignment completion rates and subsequence performance are reported in chapter 10. Chapters 3 to 10 act to form a foundation for the primary focus of this dissertation, culminating in Chapters 11 and 12, which describe PLACEments, the adaptive learning system for diagnosing and remedying gaps in student prerequisite knowledge, and the randomized controlled experiments carried out within this infrastructure to infer relationships between skill links. Chapter 13 presents concluding remarks in regard to the work presented in this dissertation, detailing possible future work that is available through this system.
4
2
Background
This chapter presents a brief overview of the field of domain knowledge representations. It presents working definitions of skill, prerequisite skill, and prerequisite skill graph.
2.1
Skill / Knowledge Component
A knowledge component has been defined as “an acquired unit of cognitive function or structure that can be inferred from performance on a set of related tasks.” [49] As noted in [49], this definition encompasses other
terms (such as production rule [8], schema [46], misconception [23], skill, and concept) which define pieces of
cognitive knowledge that students must learn or express either explicitly or implicitly. In the context of this dissertation, a skill or knowledge component is defined as a concept or set of concepts that students in a given cognitive domain are expected to be taught at a given level of their education. Take middle school Algebra as an example cognitive domain. Middle school Algebra can be broken down into smaller concepts (like Addition of Fractions, Multiplication of Mixed Numbers, etc.) each of which students are expected to be taught at a certain grade level in the course of middle school training. Each of these concepts is defined as a skill. In this write-up, skills and knowledge components are used interchangeably. They represent the knowledge required by a learner to be able to solve specific types of problems. A typical example problem for the “Addition of Fractions” knowledge component is:
2 5 +
5 9
For this example, any student able to correctly answer this question and all other possible questions of this format is said to have acquired the “Addition of Fractions” knowledge component. This is a single component of a larger group of components. Groups of well-defined skills form a cognitive domain. Others have defined a domain as a group of different problem types (or knowledge components). [34] Each individual learner has a
well-defined subset of problem types (or knowledge components) that they can comfortably solve under normal circumstances (i.e. not under any emotional or physical pressure). This set of knowledge components is referred to as the student’s knowledge state. For every given set of knowledge components, there is a large number of
5
possible knowledge states that can be exhibited across students through the acquisition of varying combinations of knowledge components.
2.2
Prerequisite Skill / Skill Graphs
Webster’s International Dictionary defines learning as “the activity or process of gaining knowledge or skill by studying, practicing, being taught, or experiencing something.” This implies that learning is a process, and that as
a student progresses through the learning process, the number of knowledge components in a learner’s knowledge state is expected to increase. This process involves building on an already-existing knowledge state. For many concepts, there is a set of knowledge components that a learner is expected to know in order for the learning of the new unknown knowledge components to occur in a less arduous manner.
Two skills are said to be in a prerequisite relationship if learners are required to know one of the skills in order to more easily learn the second skill and subsequently correctly answer questions of the second skill. Figure 2-1 below shows a sample prerequisite skill link between two skills: Addition of Fractions and Multiplication of Fractions. The arrow points from the prerequisite skill to the second skill in the pair. This second skill is also referred to as the post-requisite skill of the first skill. As depicted in the diagram, a student is expected to know how to correctly answer questions/problems that test their ability to add fractions in order to be able to correctly respond to questions relating to multiplication of fractions.
Some skills have multiple prerequisite skills. For those cases, it is implied that knowledge of all the prerequisite skills is necessary and required for students to be able to easily learn and correctly respond to problems of the post-requisite skills. This relationship is referred to, in most literature, as a conjunctive relationship. [29] Disjunctive relationships are those in which not all the prerequisites are required for success in
the post-requisite skills. In the context of this dissertation and for cases where a skill has more than a single
Addition of Fractions
Multiplication of Fractions
6
prerequisite skill, we assume a conjunctive relationship and do not claim to make any statements about the disjunctive links.
A prerequisite skill graph represents a collection of all the skills in a given cognitive domain as well as the relationships between the constituent knowledge components. It is usually depicted as a directed acyclic graph in which the nodes represent the knowledge components and the arrows indicate the direction of prerequisite relationships. In the context of this dissertation, we avoid cyclic graphs (graphs that contain cycles). We hypothesize that graphs that have cycles cause confusion regarding which skills to blame when learners fail to demonstrate learning for any selected knowledge component in the cycle, and hence beyond the scope of this work. Furthermore, the presence of a cycle is indicative that no prerequisite relationship exists among the skills in the cycle since this will be arbitrary as to the ordering of skills within a cycle. Figure 2-2 depicts an example of these domain-expert-designed graphs. In this particular example, the rectangles represent knowledge components, the links between them indicate the direction of the prerequisite relationship, and the colors are meant to show the different grade levels at which students are expected to be taught different knowledge components. Figure 2-3 shows another example of the prerequisite skill structure. In this particular example, skills are represented as hexagons, and the attachments to other hexagons show the relationships between them.
7
8
The chapters that follow describe several attempts that have been made to refine structures of this nature, and the degrees of success that this author and other authors have reported in this area of research with the ultimate goal of supporting teachers, and curriculum developers to improve the educational experience of students.
9
3
Refining Learning Maps with Data Fitting Techniques: Searching for
Better Fitting Learning Maps
Learning related sciences need quantitative methods for comparing alternative theories of what students are learning. An example of models that represent what students are expected to learn in a given domain is the learning map. A learning map, sometimes referred to as a concept map, is the graphical representation of the skills and knowledge components that students are expected to learn in a subject area (such as math) and the relationships between these skills/concepts. [15, 81] This chapter presents an investigating of the accuracy of a
learning map and its utility to predict student responses. Our data included a learning map detailing a hierarchical prerequisite skill graph and student responses to questions developed specifically to assess the concepts and skills represented in the map. Each question aligned to one skill in the map, and each skill had one or more prerequisite skills.Our research goal was to seek improvements to the knowledge representation in the map using an iterative process. We applied a greedy iterative search algorithm to simplify the learning map by merging nodes together. Each successive merge resulted in a model with one skill less than the previous model. We share the results of the revised model, its reliability and reproducibility, and discuss the face validity of the most significant merges.
A version of this chapter is published at the following venue:
Adjei, S. A., Selent, S., Pardos, Z., Broaddus, A., Heffernan N. & Kingston, N. (2014)Refining Learning Maps with Data Fitting Techniques: Searching for better fitting learning maps.In John Stamper et al. (Eds) Proceedings of the 7th International Conference on Educational Data Mining.pp413-414
3.1
Introduction
Cognitive models are used to represent how one’s knowledge may be organized [41]. As such, they contain
descriptions of component pieces of knowledge and connections among the components to indicate how understanding develops in a specified domain [41]. Different authors have described various cognitive models,
including learning maps [68], learning trajectories [24], and learning hierarchies [40]. Learning maps use linear
sequences of learning goals and are useful for instructional planning [68]. A learning trajectory includes a
learning goal, a developmental progression defining the levels of thinking students pass through as they work toward the defined goal, and a set of learning activities or experiences that assist students in reaching the defined
10
goal [24]. As their name implies, learning hierarchies model prerequisite knowledge components in hierarchies,
allowing multiple pathways to extend from one prerequisite skill to multiple learning goals [40].
The learning map extends the notion of a learning hierarchy by representing domain knowledge as a network of component skills and connections, allowing for multiple paths from prerequisites to learning goals. While multiple paths add complexity to the cognitive model, they allow the learning map to represent the potential learning of a broad range of individuals who may experience difficulties traversing certain pathways due to disabilities or particular learning preferences. As such, the learning map provides a flexible model of learning that is consistent with recent advances in universal design for learning [15, 80].
In the present study, we examine a small section of the learning map and investigate the effects of permuting the topology of the hierarchy. Skills and concepts are represented by latent nodes in the learning map. Directed edges represent the prerequisite relationship among latent nodes and also represent the relationship between those nodes and their associated test items. We present a simple method for improving the predictive power of the learning map by combining latent nodes. We report our initial results on the fit improvement, stability of the resulting map, and interpretation of the algorithms chosen node combinations.
This work connects with literature on searching for better fitting cognitive models. Several non-hierarchical cognitive models have been developed to represent the relationship between knowledge components (KCs) in the form of prerequisite skill maps. These cognitive models have been developed to help intelligent tutors, as well as experts, determine student mastery of KCs. A number of technical approaches have been developed to evaluate cognitive models developed by domain experts. One approach is Learning Factors Analysis (LFA), developed by Cen, Koedinger and Junker [19] to help the Educational Data Mining (EDM) community
evaluate different cognitive models.
There are several different methods for analyzing skills. Tatsuoka [86] introduced the rule space method
for representing and determining how well students understood the underlying skills (or rules as the authors call it) for test items. Additionally, the method is used to identify any erroneous classification or misconceptions of students in responding to test items. Barnes [12] utilized the Q-matrix method from Tatsuoka’s rule space method
11
mastery. Additive Factor Models (AFM) also utilize the Q-matrix but with a multiple logistic regression model which predicts student performance based on a number of factors, primarily the number of opportunities a student has to demonstrate a particular skill. Cen reported in [19] that AFM did not accurately predict items involving
conjunctive skills and hence introduced the Conjunctive Factor Model (CFM) to improve predictions in this area. In addition to latent skill cognitive models, item to item knowledge structures have also been learned from empirical data using Bayesian Network structure learning and partial order knowledge structures [30].
Our approach to simple merging of skills was inspired by Learning Factors Analysis [19], which uses a
combinatorial search to determine which model best fits student data. The combinatorial search consists of three different types of operations: splitting, merging or adding existing KCs. Splits occur when a knowledge component is determined to be composed of more than one skill, and hence splits into multiple skills. One or more skills are merged if they are determined to be inseparable skills, given student data. The add operation involves the inclusion of a completely new skill to the original map [18].
Other researchers have tried to extend LFA to other subject domains. Leszczenski and Beck introduced a scalable application of the LFA framework in the context of reading knowledge transfer [52]. The problem with
this approach is that the search was unstable and could give different results each time the search was run. Instead of determining a student model given an initial human generated model, Li, Cohen, Noboru, and Koedinger proposed a method for automatically generating the KCs from student responses to individual items. [53]
Although their method resulted in the best fit among the other candidates, it may not generalize for models with less coarse-grained KCs. Other models have focused on the determination of a student’s knowledge of certain skills. Logistic regression has been used to trace multiple sub-skills of a given skill [99]. Pavlik, Cen, and
Koedinger proposed a method for automatically deriving a cognitive model by generating a Q-matrix, which provides a representation of the KCs required for each test item. [63]
In this work, we follow the process described by Cen, Koedinger and Junker [19]. This technique can be
used to analyze hypothesized learning maps and consider whether small improvements to the model result in a better fit to the data. In this method two different approaches were studied to determine the best skill map from an initial graph. Cen, Koedinger, and Junker suggested three types of operations, i.e., merges, splits, and adds. [19]
12
However, in this study, we used only merge operations given the already highly granular quality of our initial, subject matter expert derived learning map.
3.2
Initial Learning Map
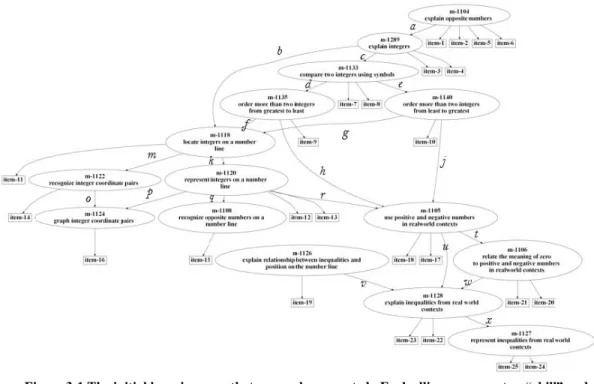
This study examined a section of the learning map containing 15 concepts and skills related to understanding integers. The map was developed using mathematics educational literature describing how students learn to understand and operate with integers. The set of integers includes the whole numbers and their opposites, presenting many students their first exposure to negative numbers (Van de Walle, Bay-Williams, Karp, & Lovin, 2014). Although many students have prior knowledge of negative values within contexts such as debt or temperatures below freezing, they often struggle when first learning to work with negative numbers. Proficiency with integers includes understanding opposite numbers, comparing integers, representing integers on number lines and graphs, and using integers in real world problem contexts. The learning map shown in Figure 3-1 illustrates the component concepts and skills that comprise such understanding. This map suggests that students should learn to identify opposite numbers (M-1104) and integers (M-1289) in preparation for comparing and ordering integers (1133, 1135, 1140) as well as representing integers on number lines (1118, 1120, 1108, M-1126) and coordinate planes (M-1122, M-1124). Because integers challenge the initial counting strategies students learned for positive numbers, it is beneficial for students to work with integers in real-world contexts
13
.
Figure 3-1 The initial learning map that researchers created. Each ellipse represents a “skill” and each rectangle represents a test item. For easy reference, the links are labeled. The labels do not have
any specific meaning
The data for this study was gathered from student responses to 25 test items aligned to the 15 skills shown in the learning map in Figure 3-1. All of the test items were multiple choice questions, with four answer options per question. Each skill was assessed by one or more items. As part of the test development process, subject matter experts confirmed the alignment of each item to its associated skill, meaning that the item was judged by experts to evoke the intended skill. Therefore, when a student answered a test item correctly, we assumed in this study that the student had mastered the skill associated with that test item. Furthermore, due to the hierarchical structure of the learning map, items associated with skills lower in the learning map were assumed to be more difficult, i.e., require more skills, than items associated with skills higher in the learning map.
In addition to the graph, we utilized a data-set containing the responses of 2,846 students answering the same sequence of 25 items in the learning map. All the students were chosen from middle schools in a mid-western state from grades 6 (8%), 7 (49%), 8 (39%) and 10 (4%). The students’ responses were dichotomous, ‘1’ for correct and ‘0’ otherwise.
14
3.3
Methodology
3.3.1 Merge Operation
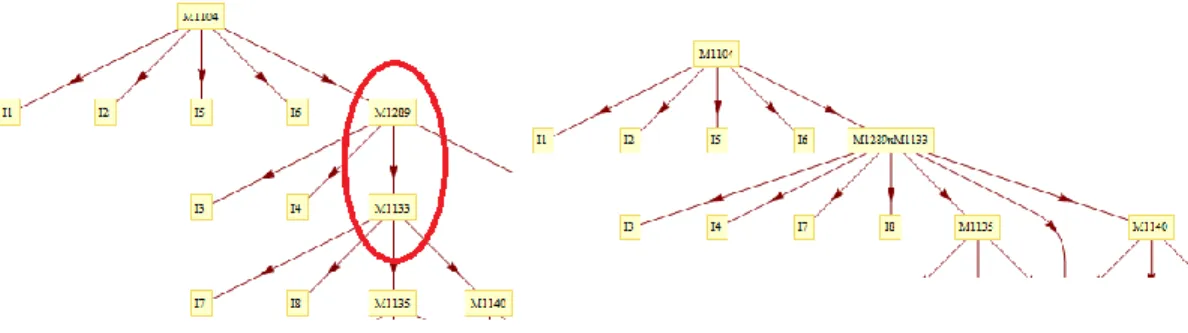
In all of the experiments our sole manipulation of the map was to merge latent nodes. A merge operation occurred when two skills adjacent to each other in the map were combined into one skill. Items from both skills that were merged were reattached to the new single skill. The prerequisites of the constituent skills became prerequisites of the merged skill and the same applied to the post-requisites. An example merge operation on a section of the skill map is shown below. The skill maps before and after the merge operation are shown in Figure 3-2. M-1289 and M-1133 are the skills that were merged into a single skill, named “M-1289XM-1133”. Note that the names of the skill hold no meaning of their own, just as the labels of the arcs between the skills.
Figure 3-2 Before and after the merge of the arc between M-1289 and M-1133. Note that after the merge, all the items mapped to both M-1289 and M-1133 now are mapped to the joint skill labeled “M1289xM1133”.
3.3.2 Evaluation Procedure
For evaluating the models, we used per student per item cross validation with 5 student folds and 3 item folds. Our student and item folds were chosen randomly for our evaluation. More details about how the cross-validation was done can be found in the technical document (1). We used the Root Mean Squared Error (RMSE) metric to evaluate the results of the experiments. RMSE is calculated by squaring the differences between each actual value and predicted value and then finding the average value of the differences. Taking the square root of the average will give the RMSE value for the model. The closer the RMSE value is to 0, the more accurate the model is (i.e. the smaller the error is in predicting the available data.)
15
3.4
Experiment 1: Iterative Search
The purpose of this experiment was to take the original learning map and to create and run a search algorithm to find a better, more predictive, learning map. This experiment uses a greedy search algorithm to generate the new models. In this experiment, we started with the initial learning map shown in Figure 3-1 and created a Bayesian network to represent this map. Starting with the original map we programmatically found all possible skill pairs that could be merged. The algorithm only considered merging adjacent skills, or skills that shared an edge between them. Each possible merge was evaluated using the procedure previously described, and the best merge was chosen based on the map with the lowest cross-validated prediction error. We applied the best possible merge to the map and this resulted in a map with one less skill. The new map was used as the input to the next iteration of the algorithm. This technique was iteratively applied until all the skills were merged into a single skill. Further details of the iterative search algorithm can be found in the technical document.
3.4.1 Results and Analysis
Figure 3-3 shows a graph and an image of the prerequisite skill graph of the results from the iterative search. The search started at iteration 0, which was the initial skill map consisting of 15 skills before any merges were applied to it. The search ended at iteration 14, which is a graph consisting of just one skill with all the items attached to that one skill. The best models from each iteration are shown below. We recorded AUC, RMSE, accuracy, AIC, and BIC metrics, although we only used RMSE to choose the best models at each iteration and to guide our search. Ultimately, we chose RMSE as the deciding metric.
16
(a) Skill Accuracy
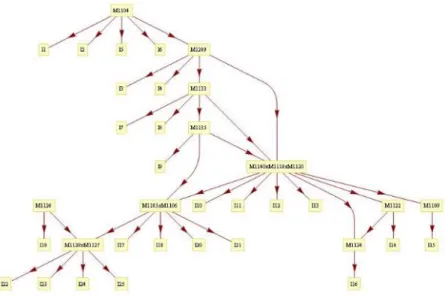
(b) Best Model Skill Map (11 skills at iteration 4)
Figure 3-3 a) The chart of results and b) the graph of the best skill model
The results show that the best RMSE obtained was from the 11-skill map at iteration 4 with an RMSE of 0.37238. This is slightly better at predicting students’ real performance data than the original skill map (with RMSE of 0.37451). The 11-skill map has a small but significant improvement (p = 6.22624E-68) from the original skill map. The graph shown in Figure 3-3b also shows that models consisting of between 9 and 12 skills have similar RMSE values and are alternative choices for a best model depending on the level of skill granularity desired. Though the 11-skill model is significantly better than the original model (in terms of RMSE), practically these two models are the same since the difference between these RMSE values is about 0.0022. The only advantage that the 11-skill model has over the original 13-skill model is the reduction in complexity of the model.
In addition to looking at which model best predicted actual responses, we examined which skills were being merged throughout our iterative search to see if we could find any general trends. A list of the merges can be found in the technical report. The individual skills are represented by their original numbers and a merged skill is represented by the numbers of each skill concatenated with an ‘x’. The numbering is in topological order, meaning that the skill highest up on the skill map was listed first for a merged skill. The first merge occurred for skills M-1128 and M-1127. Since skill M-1128 was a parent of skill M-1127, it is listed first in the combined skill name M-1128xM-1127. (See Figure 3-3b)
17
3.5
Experiment 2: Stability Experiment
In the previous experiment, every model was evaluated once and only once, which lead to the question of whether or not our results were stable. Our model evaluation used the Expectation Maximization (EM) algorithm, which is known to be affected by the starting value. For our original experiment, we chose our starting points for EM randomly and only evaluated each model once. The authors, in earlier research, found that the starting point of the EM algorithm could make a difference in the converged value. In general, the EM algorithm does converge to the correct value, but there are cases where it can converge to incorrect values or to the “opposite” value. Considering the range to be between 0-1, if the actual true value of a parameter was 0.3, EM could converge to (1 - 0.3) = 0.7 instead if the initial starting point was too far from the true value.
Our question was: if we were to run the iterative search experiment several times would we end up with the same results using different starting values for EM. Since it takes several hours just to evaluate a single model, running the entire search consisting of over 100 models to evaluate would take too long. The purpose of this experiment was to evaluate just the first iteration of the search ten times to see if the results converged to a single best graph.
For the first iteration of the algorithm there were sixteen possible merges that could happen. For each of these possible merges we evaluated the resulting model ten times. The evaluation used was the same evaluation as the iterative search experiment for which we tested stability. For each of the ten runs we set the random seed in MatLab to correspond to the run number. This gave us a different set of random numbers for each run of the 16 possible merges, where each merge got the same random seed within a run. Manually setting the random seed also meant our results for the stability experiment would be reproducible
3.5.1 Results and Analysis
After evaluating all sixteen models from the first iteration ten times we kept a count of how many times a model was the best model and how many times a model was in the top 3 best models. RMSE was used to choose the best models since it was used to determine the best model in the iterative search experiment. The results are shown in the table below in Figure 3-4.
18
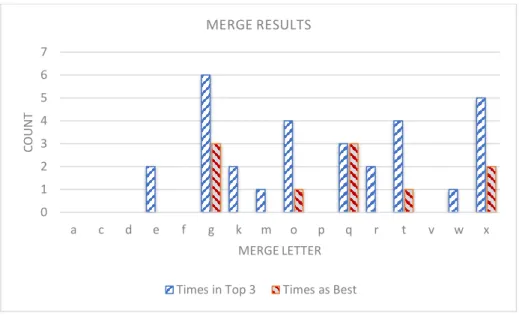
Figure 3-4 Stability of Graph
Merge ‘g’ was in the top 3 the most times (6) and was also the best model the most times (3). Merge ‘x’ and merge ‘q’ also did well. Merge ‘x’ was in the top 3, five times and was the best model two times. Merge ‘q’ was in the top 3, three times and was the best model three times. Merges ‘t’ and ‘o’ also did well. The general observation was that there was separation between good and bad merges but the best merge was not stable and did not converge.
We compared the graphs to our original iterative search experiment. In the original iterative search, the first two skills that were merged were skills M-1128 and M-1127, corresponding to merge ‘x’ in our stability experiment. The second two skills that were merged in the iterative search experiment were skills 1140 and M-1118, corresponding to merge ‘g’ in the stability experiment. Both merges ‘x’ and ‘g’ were the best two graphs in the stability experiment. Although merge ‘g’ did slightly better in the stability experiment, the order in which the merges took place did not matter. The best model in the iterative search took place after 4 merges, which included merges ‘x’ and ‘g’. Although we could not run the stability experiment 10 times for all possible merges and merge paths, we believe that it has a decent chance to converge to the same best model, which occurred after the fourth merge in the iterative search.
3.6
Discussion
When analyzing each merge, we considered the skills or concepts described by the affected skills as well as the test items associated to those skills. The descriptions below discuss the three groups of skills merged in
0 1 2 3 4 5 6 7 a c d e f g k m o p q r t v w x CO U N T MERGE LETTER MERGE RESULTS
19
experiment 1 and shown in the Best Model Skill Map (Figure 3-3b). The two additional pairs of skills merged in experiment 2 are also discussed. In each case, the merges point to commonalities in the skills themselves or among the test items used to assess different skills.
Merge ‘x’ affected skills M-1127 and M-1128. These skills represent “the abilities to represent inequalities from real world contexts” and “explain inequalities from real-world contexts”, respectively. The test items associated with these skills required students to read problems and identify inequality statements that matched the problems. In this case, the test items did not distinguish between two unique skills, i.e., representing a problem or explaining a problem, as was suggested by the two skills.
Merges ‘g’ and ‘k’ affected skills M-1118, M-1140 and M-1120. These skills represent the abilities to “locate integers on a number line”, “represent integers on a number line”, and “order integers from least to greatest”, respectively. The test items associated with these skills required students to select lists of correctly ordered integers or identify the correct number line graph of a particular integer. In this case, the test items did not adequately distinguish between locating and representing integers on a number line (i.e., M-1118 and M-1120) because all of the items were multiple-choice, and none provided students the opportunity to construct their own number line representations of integers. The inclusion of ordering integers from least to greatest (i.e., M-1140) with the other two skills is possibly due to the fact that using a number line is inherently, cognitively connected to ordering numbers from least to greatest.
Merge ‘t’ affected skills M-1105 and M-1106. These skills represent the abilities to “use positive and negative numbers in real-world contexts” and “relate the meaning of zero to positive and negative numbers in real-world contexts”, respectively. The test items associated with these skills required students to interpret problems involving integers and choose integer answers or verbal statements about integers. Two of the four test items included references to zero either as freezing point or sea level. In this case the items were designed to distinguish between the two skills, i.e., using integers and relating integers to zero. However, the relationship between zero and positive or negative numbers is so critical for understanding integers that, it is likely one cannot compare integers without considering their values in relation to zero.
20
Merge ‘q’ affected skills M-1120 and M-1108. These skills represent the abilities to “represent integers on a number line” and “recognize opposite numbers on a number line”, respectively. The test items associated with these skills required students to identify the correct number line graph of a particular integer or the opposite of a given integer. In this case, the two skills are inherently connected by the very definition of an integer as the opposite of a whole number. Consequently, it is likely that once students understand the definitions of integers and opposites and can use a number line, the act of graphing an integer is the same as graphing an opposite.
Merge ‘o’ affected skills M-1122 and M-1124. These skills represent the abilities to “recognize integer coordinate pairs” and “graph integer coordinate pairs”, respectively. The test items associated with these skills required students to identify the graph of a given integer ordered pair or to select the description of how to graph a given ordered pair on a coordinate plane. In this case, the items did not clearly distinguish between the two skills because the items associated with recognizing integer coordinate pairs included graphs. Furthermore, the skills themselves are difficult to distinguish in a practical sense because when students learn to graph integer ordered pairs, they routinely associate the numerical representation (i.e., the ordered pair) with its graphical representation (i.e., the point graphed in the coordinate plane).
An additional observation is that some of the skills tended to merge by pairing up with one and only one adjacent skill before RMSE started to decline. Before merge ‘t’, the merges were all pairwise with the exception of merge ‘m’. After merge ‘t’, the skills tended to keep merging into the same skill. The best skill map was generated after merge ‘r’, suggesting that adjacent skills tended to be similar skills and skills M-1140 and M-1120 were similar although they were not adjacent. This was a stronger relationship for several reasons. Firstly, the merges that culminated in the merger of M-1140, M-1118, and M-1120 all took place before the best skill map was reached. This indicated that those three skills give better predictive performance when represented as one skill. Secondly, this was the first and only 3-skill group to be merged in the best model before RMSE declines. Lastly the three skills took two iterations of the search algorithm to merge together because skills M-1140 and M-1120 were not adjacent skills. Despite the initial graph topology, our search decided to merge these three skills. The combination of all these factors provided strong reasoning that the three skills M-1140, M-1118, and M-1120 were not really distinct skills.
21
3.7
Contributions, Conclusions and Future Work
In this work, we provided a search algorithm to reduce the complexity of a given learning map, while improving its fit to real student data. Since merging skills increased accuracy, these results suggest that the original skill map was too fine-grained (given the number of questions per skill and the number of students who took the test.). In some cases, the test items did not adequately distinguish between the skills that were merged; hence such skills were merged. The results of algorithms like this can help the content experts who are creating skill maps and test items to either reconsider thinking of two skills as separate, or prompt them to write different test items to better distinguish between students that have mastered one of the skills but not the other skill. In this work, the team that created the learning map expected item 11 was a prerequisite for items 12 and 13, but our stability results suggested that of all the arcs, this arc was the least supported by the data (see Figure 3-4, arc “g”). In fact, due to this work, we asked an unbiased teacher who did know what our mapping was, to create a hierarchy between items 11, 12 and 13. Surprisingly, she suggested that 12 and 13 were prerequisites to item 11, suggesting that the arc should point in the exact opposite direction. This may indicate that our method may be helpful in using the data to suggest places in the skill graph that need more attention and refinement.
We can relate this work to our other work. Heffernan’s ASSISTments project is a project that is attempting to track and improve students’ knowledge across middle school mathematics. About a decade ago we had a learning map with over 300 skills but we now have reduced that complexity to 147 skills. Curriculum designers will correctly be thinking about the subtle ways in which problems are different from one another, which cause them to want to add skills to the skill maps to make more subtle distinctions between questions. However, if you also want to use the hierarchy to track knowledge, having more skills creates complexity, as few questions for each skill make fitting quantitative models harder.
All of the work we have done in this chapter has a very small number of questions per skill. This naturally would cause us to think that many merges would be necessary, but if we had a large number of questions, and added all those students’ responses to that large number of questions, we could probably justify more complicated models.
In our experiments, we examined the effects of merging skills on an existing learning map. There are many other ways we could have used the existing map to create alternatives. For instance, Cen, Koedinger and
22
Junker [19] have explored ways of splitting skills or adding new skills, but all of those make more complicated
models. What was not examined were the split and add operations. Possible future work could examine those operations to see if a better model can be obtained with them. Additionally, to validate our algorithm, applying it to synthetic learning maps and synthetic data could be useful to determine if our algorithm does converge to a true learning map.
End Notes
(1) The dataset, evaluation algorithm, and a technical report describing the algorithm in detail can be found
23
4
Refining Learning Maps with Data Fitting Techniques: What Factors
Matter?
Attempts have been made to refine cognitive models/Learning maps (skill graphs) using some data mining techniques.[16, 21, 32, 63, 92, 100] However, the factors that affect these improvements/refining processes are
not so clear. In the previous chapter, we presented a method for improving these cognitive models. The purpose of this chapter is to present the factors to consider when using our initial algorithm to refine learning maps. We present a simulation study that shows how important each of the factors is for this refinement process.
4.1
Introduction
Learning maps have been used as a tool to depict the set of skills in a cognitive domain and the relationship between these skills. A number of studies have been conducted to find and represent the relationships between the skills [37, 58, 84, 86]. Tatsuoka introduced the Rule-space method for identifying skills/knowledge components
in a given cognitive domain whereas [51] present another approach called the Attribute Hierarchy Method
(AHM). The rule-space method (RSM) does not present the relationship of the skills/knowledge components as a hierarchy. However, AHM, which is a variation of Tatsuoka’s RSM, considers the hierarchical relationship between the components [87]. Gierl used the AHM approach to make inferences of students’ cognitive
assessment. [41] None of these approaches dealt with methods for improving the item response models developed
using the methods proposed. The Learning Factors Analysis (LFA) method [19] was introduced to deal with this
problem. In that chapter three different operations for improving the predictive abilities of learning maps or cognitive models are introduced. In [1] an attempt was made to solve this problem by presenting the results of a
number of experiments that showed that learning maps can be refined using just one (the merge operation) of the three possible of the LFA method. It was shown that there were significant improvements in RMSE for the best model chosen, starting off with a pre-defined learning map.
24
We realize that, to generalize the method for refining learning maps, there are a number of questions that still need to be answered. These include: “What are the factors that can determine when a model can be best refined?” and “Do the number of skills, the number of items per skills, the number of levels in the skill hierarchy and the number of data points have any effect in determining the best refined model?” Whilst the LFA methods use a set of factors to determine whether to merge, add or split skills to generate better models from an existing one, all the factors used are based on expert knowledge and are independent of data. In order to answer the above questions, we present a number of simulation experiments.
4.2
Problem Statement
The LFA model uses three operations (splits, merges and adds) to refine knowledge components. In each of the operations, learning factors were included in the model refinement process. These factors did not include the number of skills in the model, the levels in the hierarchy of skills in the model, the number of items per skill and the guess and slip parameter values for the items. We hypothesize that these factors are important in generating an optimal model from a given learning map (pre-requisite skill hierarchy). Hence, we set out in this chapter to present a series of experiments that help in determining the impact of the above-mentioned factors in refining a given learning map or cognitive model.
4.3
Methodology
To answer the research questions, we started off with a 3-skill graph. We inserted a fake skill at different locations of the graph and ran our evaluation code to determine when the original skill-graph is learned back and what factors determine when this occurs. We define a fake skill as a non-existent skill within the current domain or in any other domain for that matter. The intent is to determine whether our iterative method [1] can identify such a
skill and eliminate it from the final refined skill graph. We examine the following factors and determine which of these factors have the most impact on using the greedy algorithm presented in the earlier paper to refine a given model: guess and slip parameter values, the number of levels in the skill graph hierarchy and the number of data points (i.e. students and items). For each randomly chosen skill graph we generate a set of simulated data, one
25
each for the number of student and item pairs used. We then evaluate the models using Expectation Maximization to determine the factors that have the most impact. The section presents the random graph generation, Bayesian network creation, fake skill creation and the evaluation code.
4.3.1 Random Skill Hierarchy Generation.
To generate a skill graph randomly we start by choosing a random skill hierarchy. Our algorithm to generate the skill hierarchy takes a range of skills and a graph depth as input parameters. The output of the algorithm is a valid skill hierarchy where the number of vertices is within the skill range and the number of levels is within the depth range. We order our vertices from 1 to N and use the constraint that a vertex cannot have a directed edge pointing to a smaller numbered vertex. We also enforce the constraint that a vertex cannot have any self-edges.
To generate a random graph, we choose a random number within the range of possible graphs. We then convert this number to binary form and add the correct number of leading zero’s (we know the number of skills from the random number chosen). Then we simply insert the bits of the binary number into the varying spots of the matrix form of the graph in order.
The result is a directed acyclic graph with no self-edges. It will not necessarily be completely connected, that is some of the skills be stand-alone without any prerequisite relationships with other skills. The final step is to check if the graph is connected. If the graph is connected, we keep it; otherwise we discard it and repeat the generation process. This method allows us to instantly generate valid graphs. An example is shown in Table 4-1 and Figure 4-1 for a graph with three skills.
26
Table 4-1. Example Matrix. Matrix generated by the random number 5. A ‘Y’ represents that this cell is ignored because it must be a zero since a vertex cannot have directed edges pointing to vertices with larger numbers. An ‘X’ represents that this cell is ignored because it
must be a zero since a vertex cannot have self-edges.
Vertex/Vertex 1 2 3
1 X (0) 1 0
2 Y (0) X (0) 1
3 Y (0) Y (0) X (0)
Figure 4-1. Example Graph Generated
4.3.2 Create Bayesian Network.
The Bayesian network used for the analysis was generated from the skill graph selected from the previous step. To generate the items for the skills an item range is specified. A random number of items are chosen within the item range for each skill. In our experiments, we restricted our range to be a single value so all skills will have an equal number of items. We set our Bayesian network up like knowledge tracing, where every skill has one or more items and every item has a guess and slip node. [26] An item must belong to exactly one skill. The skill
nodes are latent nodes since we cannot observe whether or not a student knows the skill. Each item node is an observable node, which is a ‘1’ if the student answered the item correctly and a ‘0’ if the student did not answer the item correctly. Both the guess and slip nodes are also latent nodes representing whether or not the student guessed or slipped on the item. A student is considered to have guessed when the student answered correctly but did not know the skill. A student is considered to have slipped when the student answered incorrectly but knew the skill. Using the previous skill graph example, we added the item, guess, and slip nodes to the graph.
The final step to create the Bayesian network is to create the conditional probability tables (CPT) for the nodes. For our experiments, if a skill has multiple prerequisites, we considered the prerequisites as conjunctive. This means that a student should find it difficult to learn a post-requisite skill if the student does not know all of the prerequisite skills. Therefore, if a student does not know one of the prerequisite skills then the student may
27
find it challenging to learn the post-requisite skill. If the student does know all the prerequisite skills (or there are no prerequisite skills), we pick a random probability that the student will know the post-requisite skill between 0.3 – 0.7. Our guess and slip parameters have varying probabilities since that was one of the parameters we experimented with. All the item nodes have a deterministic (0% chance or 100% chance of correctness) CPT based off of the skill, guess, and slip nodes (which or not deterministic).
4.3.3 Creation of Fake skill
We exported our Bayesian network to Matlab and used Kevin Murphy’s Bayes Net Toolkit to generate simulated data, which we define as ground truth data for the graph. Once the ground truth data was generated we randomly generated “fake” skills from the original graph. A fake skill is generated by randomly choosing a real skill. Once a real skill is chosen, a random number of items is chosen from the real skill. These items are then detached from the real skill and attached to the fake skill. The fake skill is then randomly chosen to be either a parent or a child of the real skill. Figure 4-2 shows the creation of a fake skill.
Figure 4-2 Creation of Fake Skill. The left skill graph shows the original skill graph before the creation of the fake skill. The skill
graph on the right shows the skill graph after the creation of the fake skill. The fake skill was created from Skill_1 where item 2
28
4.3.4 Evaluation
In order to evaluate our Bayesian Network, we used a similar process as done in [1]. We use Expectation
Maximization (EM) to learn parameters and fit our model. To evaluate our model, we used per student per item cross validation with 5 student folds and 3 item folds. Our student and item folds were chosen randomly for our evaluation. In [1], the item folds were chosen randomly but kept the same for each student. The only difference
between the evaluation in [1] and this experiment is that each student is assigned a different set of random item
folds instead of all students having the same set of random item folds.
4.4
Experiments
4.4.1 Experiment 1
In this first experiment, we started with a set of 3-skill graphs. For each of the graphs, we insert a fake skill. We define a fake skill as one that is broken off of an existing skill. The fake skill has a random number of items chosen from the original skill and the fake skill is either a pre-requisite or post-requisite of the original skill. If the fake skill is a requisite of the original skill, all the previous requisites of the original skill become the pre-requisites of the new fake skill and the original skill becomes the post-requisite of the fake skill. The whole idea is to figure out if this fake skill will be easily identified and merged with the skill from which it was created from. This is to validate our merge operations and to determine what factors influence the determination of a better skill-model /skill map than the original.
4.4.1.1 Analysis
We analyzed the results of the experiment and looked at how the number of students, number of items, guess/slip values, and the number of fake skills impacted RMSE of our predictions and the percent of correct graphs learned back. Fig 3-3 shows the relationship between the probability a student guesses/slipped and the RMSE as well as the percent of the correct skill graph being learned back. We paired guess and slip values to lower the number of variables in our experiment. Our guess/slip pairings are as follows: (0, 0), (0.1, 0.08), (0.3, 0.16) and (0.5, 0.25). It shows that the higher chance the student has to guess the answer the less accurate and harder it is to learn back
29
the true original graph. The percent of graphs learned back with a guess/slip probability of 0 is significantly better than the percent of graphs learned back with a guess probability of .5 (p < .001). A realistic guess probability is around 0.14 calculated in [61]. At this point the percentage of graphs learned is somewhere between 0.25 and
0.33. These are not great percentages to learn back a correct graph under realistic guess and slip values. Not much can be done to lower the guess probability on typical questions middle school math students would see. However more student data can be used to increase model performance.
Figure 4-3 Effect of guess/slip on learning back the original graph
The guess/slip probability is the biggest factor that affects model accuracy followed by the number of students. Table 4-2 shows how both the guess/slip probability and the number of students affects the percentage of correct graphs learned back and average RMSE. A cell is broken up into two columns where the first column in the cell is the percentage of correct graphs learned back and the second column in the cell in the average RMSE value.
Table 4-2 Student/Guess Impact on Evaluation
Number of Students
Guess 50 100 150 200
PLB RMSE PLB RMSE PLB RMSE PLB RMSE 0 0.33 0.09 0.64 0.08 0.70 0.1 0.67 0.02 0.1 0.25 0.36 0.33 0.33 0.33 0.32 0.38 0.31 0.3 0.25 0.46 0.33 0.44 0.08 0.44 0.38 0.43 0.5 0.08 0.49 0.08 0.48 0.08 0.48 0.00 0.46
30
Figure 4-4 Effect of Number of Fake Skills on model improvements
4.4.2 Experiment 2
In experiment 1 multiple randomly chosen graphs were used as the ground truth. In this experiment, we chose to try each possible 3-skill graph to see if the graph structure had an effect on whether or not the correct skill graph was learned back. The methodology was the same as experiment 1 except instead of randomly choosing graphs we ran each of the four graphs for each possible number of students and items per skill. Figure 4-5 shows all four possible 3-skill graphs. After determining that the major factor impacting performance were guess/slip values, a reasonable pair of values were chosen for the guess and slip values (guess=0.1 and slip=0.08). Additionally, we fixed the number of fake skills to one in order to reduce the variability of the factors.
31
Figure 4-6 Effect of students/items on the model simplification
The general observation from this experiment is clear from Figure 4-6 above. As the number of data points increases, the level of accuracy in recovering the original graph increases. This is in spite of the fact that the location of the fake skill was not fixed. Moreover, for any given number of students, an incre
![Figure 2-3 Another example graph sourced from [turnonccmath]](https://thumb-us.123doks.com/thumbv2/123dok_us/615609.2573772/14.918.188.760.112.996/figure-example-graph-sourced-turnonccmath.webp)