METHOD DEVELOPMENT AND VALIDATION OF VALBENAZINE
IN ITS BULK AND DOSAGE FORM BY HPLC
Imam Pasha S.*, Sumaiah Ahsan, Murali Balaram Varanasi and Anupama Koneru
Sultan -Ul-Uloom College of Pharmacy, Banjara Hills, Road No.3, Hyderabad-500 034,
Telangana, India.
ABSTRACT
A simple and selective HPLC method is described for the
determination of Valbenazine. Chromatographic separation was
achieved on a Phenomenex C18 (250×4.6 ×5µ) using mobile phase
consisting Acetonitrile : Water : Triethylamine buffer (60: 40: 0.5%)
v/v with detection wavelength of 264 nm. Linearity was observed in
the range 50-150 µg /ml for Valbenazine (r2 =0.999) for the amount of
drugs estimated by the proposed methods was in good agreement with
the label claim. The proposed method is fully validated with
parameters like accuracy, precision, linearity, limit of detection, limit
of quantification, robustness and ruggedness. The proposed method is
stability indicating with parameters like Acid, base, peroxide, photolytic and thermal
degradation.
KEYWORDS: Valbenazine, HPLC, Method, Quantification, Formulation.
1. INTRODUCTION
Valbenazine is used to treat tardive dyskinesiain adults.[1] Tardive dyskinesia is a
neurological disorder characterized by involuntary movements.[3]
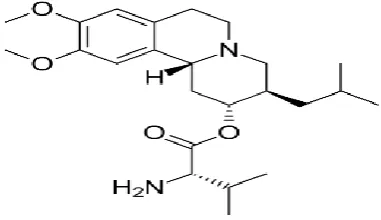
Valbenazine’s IPUAC name is
(2R,3R,11bR)-3-Isobutyl-9,10-dimethoxy-1,3,4,6,7,11b-hexahydro-2H-pyrido[2,1-α] Isoquinolin-2-yl-L-Valine and its molecular formula is
C24H38N2O8 and molecular weight is 418.58. Its chemical structure is shown in the Fig.1.
Volume 7, Issue 18, 948-963. Research Article ISSN 2277– 7105
Article Received on 04 Sept. 2018,
Revised on 24 Sept. 2018, Accepted on 15 Oct. 2018
DOI: 10.20959/wjpr201818-13525
*Corresponding Author
Imam Pasha S.
Sultan -Ul-Uloom college of
Pharmacy, Banjara Hills,
Road No.3, Hyderabad-500
Fig. 1: Chemical structure of Valbenazine.
Valbenazine is vesicular monoamine transporter-2 inhibitor.[2] It decreases the availability of
monoamine neurotransmitters by preventing their storage in synaptic vesicles. In vitro,
valbenazine shows great selectivity for VMAT2 and little to no affinity for VMAT1 or other
monoamine receptors.[4] This is believed to be the reason behind its therapeutic effect in
tardive dyskinesia although the exact mechanism is unknown. Valbenazine is >99% bound to
plasma proteins.
2. NEED FOR THE STUDY
Literature review indicates, no method is reported for quantification of bulk drug and its
capsule formation till date. Only few LC-MS/MS methods were reported.
3. MATERIALS AND METHODS Table 1: Instruments used.
UV-Visible Spectrophotometer Nicolet evolution 100
UV-Visible Spectrophotometer software Vision Pro
HPLC software Spin chrome (LC SOLUTIONS)
HPLC Shimadzu (LC 20 AT VP)
Ultra sonicator Citizen, Digital Ultrasonic Cleaner
pH meter Global digital
Electronic balance Shimadzu
Syringe Hamilton
HPLC Column Inertsil ODS 3V(250x4.6mm) 5µm
Table 2: Reagents and Chemicals used.
Potassium Dihydrogenortho phosphate
Dipotassium hydrogen orthophosphate Rankem/ AR Grade
Acetonitrile Merck/ HPLC Grade
Water Merck/ HPLC Grade
Methanol Merck/ HPLC Grade
Table 3: Drugs and formulation.
Valbenazine Gift samples obtained from Madras
pharmaceuticals, Chennai Ingrezza 10 mg capsules Obtained from local pharmacy
METHODS
Preparation of Mobile phase
About 60 volumes of Acetonitrile, 40 volumes of Water and 0.5% Triethylamine buffer
(60:40: 0.5%) were mixed and sonicated for 15 mins for degassing and the solution was
filtered through 0.45 micron membrane filter.
Preparation of 0.5% Triethylamine: About 0.5 ml of Triethylamine was transferred into 100 ml volumetric flask and the volume was made up to mark with water.
Preparation of samples for Assay Preparation of Standard solution
10 mg of Valbenazine was weighed and transferred in to 100 ml volumetric flask and
dissolved in mobile phase and then make up to the mark with mobile phase and prepare 10 µg
/ml of solution by diluting 1ml to 10ml with mobile phase.
Preparation of Sample solution
Sample name: Ingrezza 10 mg capsules
Weigh 20 capsules by removing the shell then crush with mortar and pestle then weigh a
quantity of powder equivalent to 10mg of Valbenazine and transferred in to 100 ml
volumetric flask and dissolved in mobile phase and then make up to the mark with mobile
phase and prepare 10 µg /ml of solution by diluting 1ml to 10ml with mobile phase.
Where,
AS: Average peak area due to standard preparation
AT: Peak area due to assay preparation
WS: Weight of Valbenazine in mg
WT: Weight of sample in assay preparation
DT: Dilution of assay preparation
DS: Dilution of standard preparation
AV: Average weight of tablets in mg
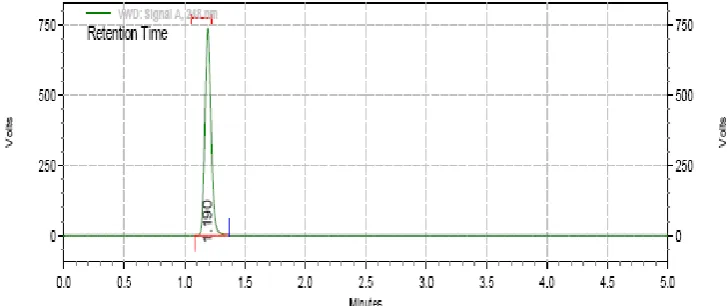
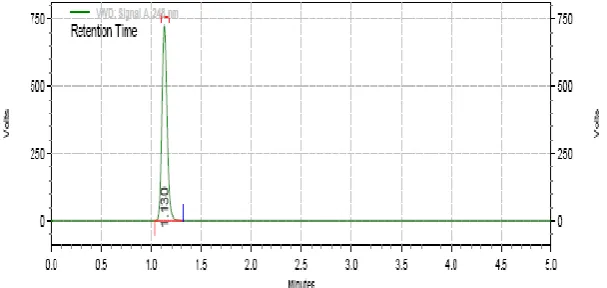
[image:4.595.113.477.130.283.2]LC: Labelled claim of Valbenazine in capsules
Fig. 2: Chromatogram of Assay Standard-01.
Table 4: Results for Valbenazine
Valbenazine
Standard Area Sample Area
Injection-1 54335283 54609367
Injection-2 53884296 54791671
Injection-3 54091715 54876254
Injection-4 54660522 54122289
Injection-5 54144218 54060009
Average Area 54223207 54491918
Assay(%purity) 99.35
Table 5: Results of assay.
Drug Label claim(mg) Amount found(mg) % Assay
Valbenazine 10 9.85 98.5
Observation
The amount of Valbenazine present in the taken dosage form was found to be 99.35 %.
4. METHOD VALIDATION
4.1. System Suitability& System precision
To verify that the analytical system is working properly and can give accurate and precise
results were evaluated by injecting six times 10µg/mL of Valbenazine and the
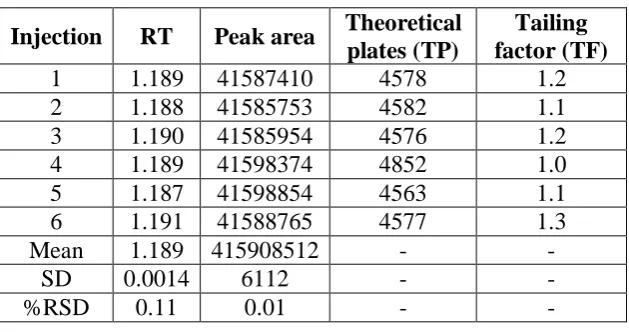
Table 6: Results for system suitability of Valbenazine.
Injection RT Peak area Theoretical
plates (TP)
Tailing factor (TF)
1 1.189 41587410 4578 1.2
2 1.188 41585753 4582 1.1
3 1.190 41585954 4576 1.2
4 1.189 41598374 4852 1.0
5 1.187 41598854 4563 1.1
6 1.191 41588765 4577 1.3
Mean 1.189 415908512 - -
SD 0.0014 6112 - -
%RSD 0.11 0.01 - -
Acceptance criteria
1. The % RSD for the retention time of Valbenazine Peaks from 6 replicate injections of
each Standard solution should be not more than 2.0.
2. The % RSD for the peak area responses of Valbenazine peak from 6 replicate injections
of each standard solution should be not more than 2.0%.
3. The number of theoretical plates (N) for the Valbenazine peaks is not less than 2000.
4. The Tailing factor (TP) for the Valbenazine peak is not more than 2.0.
RESULT
The plate count and tailing factor results were found to be within the limits and the % RSD
Was found to be 0.1. So system is suitable and giving precise results.
4.2 Method precision
Method precision was determined by injecting sample solutions of concentration Valbenazine
[image:5.595.152.448.579.717.2](10μg/mL) for six timesare prepared separately.
Table 7: Method precision results for Valbenazine. VALBENAZINE
S.No. Rt Area
1 1.190 286.770
2 1.193 287.146
3 1.190 283.647
4 1.190 285.277
5 1.187 281.675
6 1.190 270.309
Avg 1.19 415909
Stdev 0.0019 6265
%RSD 0.16 0.015
RESULT
The % RSD of Assay for 6 Samples determinations of Valbenazine found to be within the
acceptance criteria (less than 2.0%). Hence method is precise.
4.3 Linearity and range
Preparation of standard stock solution
Standard stock solutions of Valbenazine were prepared by dissolving 100 mg of Valbenazine
in 100 mL of mobile phase, filter the solution using 0.45-micron syringe filter and Sonicated
For 5 min, further dilutions were given in the Table.8.
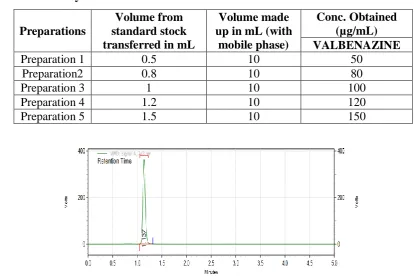
Table 8: Linearity.
Preparations
Volume from standard stock transferred in mL
Volume made up in mL (with
mobile phase)
Conc. Obtained (µg/mL) VALBENAZINE
Preparation 1 0.5 10 50
Preparation2 0.8 10 80
Preparation 3 1 10 100
Preparation 4 1.2 10 120
Preparation 5 1.5 10 150
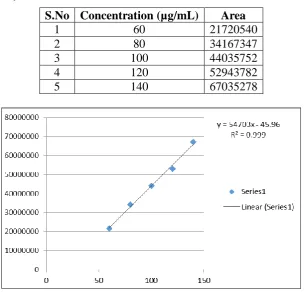
[image:6.595.84.499.469.745.2]A graph was plotted for valbenazine against the concentrations of the solutions and the peak
areas (Table.9). The correlation coefficient R2 was determined and was found to be 0.999 for
Valbenazine (Fig.4).
Table 9: Linearity data of Valbenazine.
S.No Concentration (µg/mL) Area
1 60 21720540
2 80 34167347
3 100 44035752
4 120 52943782
[image:7.595.146.451.161.453.2]5 140 67035278
Fig.5: Graph for Linearity data of Valbenazine.
Table 10: Linearity results of Valbenazine.
S.No Parameter VALBENAZINE
1 Correlation coefficient 0.999
2 Slope 54703
3 Intercept 45.96
Acceptance criteria
The relationship between the concentration of Valbenazine and area of Valbenazine should
be linear in the specified range and the Correlation Co efficient should not be less than 0.99.
Result
The correlation coefficient for linear curve obtained between concentrations Vs. Area for
4.4 Specificity
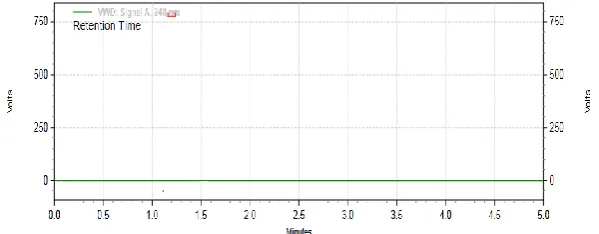
Blank solution was injected and the chromatogram was recorded for the same as given in
Fig.7 Placebo solution was prepared and it was injected and the chromatogram was recorded
[image:8.595.149.449.177.294.2]for the same as given in Fig. 6
Fig. 6: Chromatogram of Placebo.
Fig. 7: Chromatogram of Blank.
Result
Chromatograms of blank and placebo solutions had shown no peaks at the retention times of
Valbenazine. It was observed that diluent or excipient peaks do not interfere with the
Valbenazine Peak.
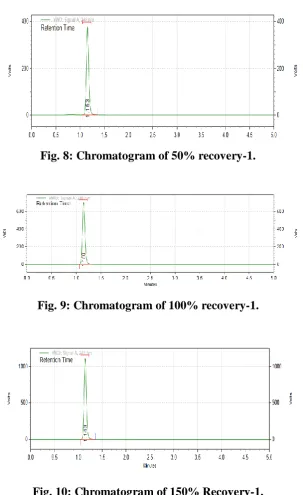
4.5 Accuracy
Accuracy of the method was determined by recovery studies. To the formulation
(preanalysed sample), the reference standards of the drugs (50µg/ml, 100µg/ml and 150µg/ml) were added at the level of 50%, 100%, 150%. The recovery studies were carried out three times and the percentage recovery and percentage mean recovery were calculated
Fig. 8: Chromatogram of 50% recovery-1.
[image:9.595.149.453.63.559.2]Fig. 9: Chromatogram of 100% recovery-1.
Fig. 10: Chromatogram of 150% Recovery-1.
Table 11: Results for Recovery of Valbenazine. Recovery
level
Accuracy VALBENAZINE
Average % Recovery
Area Average area % Recovery
50%
4099428
4373154 100.52
99.97 4103816
4099428
100%
4602209
4590044 99.58 4565673
4602249
150%
4642187
4645416 99.82 4651875
Acceptance criteria
The Average % recovery of Valbenazine should lie between 98% and 102%.
Result
The percentage mean recovery of Valbenazine was found between 99.0 to 102.0.
LIMIT OF DETECTION
Where, σ = the standard deviation of the response
S = the slope of the calibration curve
The slope S may be estimated from the calibration curve of the analyte.
Observation
The LOD for this method was found to be 35.14µg/ml (Valbenazine)
LIMIT OF QUANTIFICATION (LOQ)
Where, σ = the standard deviation of the respons; S = the slope of the calibration curve
The slope S may be estimated from the calibration curve of the analyte.
OBSERVATION
The LOQ for this method was found to be 106.48µg/ml (Valbenazine).
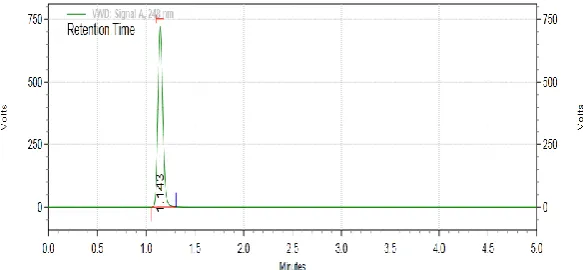
4.6 Robustness
The Robustness of the method was determined. The results obtained by deliberate variation in
Fig. 11: Chromatogram of Temperature from 30 to 25°C.
Table 12: Results for Robustness of Valbenazine.
Chromatographic changes Retention time(min) Tailing Factor Theoretical Plates
Flow rate (mL/min) 0.4 1.473 1.0 4942
0.6 0.933 1.3 4247
Temperature (°C)
25 1.143 1.4 4467
35 1.137 1.1 4496
Result
The tailing factor was found to be within the limits on small variation of flow rate and
wavelength.
4.7 Ruggedness
The ruggedness of the method was studied by the determining the analyst to analyst variation
by performing the Assay by two different analysts.
Acceptance criteria
The % Relative standard deviation of assay values between two analysts should be not more
than 2.0%.
[image:11.595.147.450.601.721.2]Fig. 13: Chromatogram of Analyst-1 sample.
Table 13: Ruggedness Results of Valbenazine.
VALBENAZINE %Assay VALBENAZINE %Assay
Analyst 01 99.92% Analyst 01 98.64%
Analyst 02 98.36% Analyst 02 99.60%
%RSD 0.11 %RSD 0.28
Results
From the above results % assay and %RSD obtained acceptance criteria 2% so method is
rugged
5. STABILITY STUDIES
5.1. PEROXIDE DEGRADATION
Sample solution of Valbenazine (10µg/ml) and 1 ml of 20% hydrogen peroxide (H2O2) was
mixed. For HPLC study, 10 µl were injected into the system and the chromatogram was
recorded to assess the stability of sample.
[image:12.595.153.450.557.690.2]5.2. PHOTOLYTIC DEGRADATION
The photochemical stability of the drug was studied by exposing the 100µg/ml solution to
UV light by keeping the beaker in UV chamber for 7 days. For HPLC study, the resultant
solution 10µl was injected into the system and the chromatogram were recorded to assess the
[image:13.595.147.452.193.316.2]stability of sample.
Fig. 15: Chromatogram of photolytic degradation.
5.3. ACIDIC DEGRADATION
one tablet was powdered and placed in a 50ml volumetric flask and dissolve in mobile phase
up to 75% then sonicate it for 10 minutes then add 1 ml of 0.1N HCl then kept In an oven at
600c for 1 hour then cool and add 1 ml of 0.1N NaOH it then make up the volume up to 50ml
with mobile phase, then place the sample in the vial and inject into the system to record the
chromatogram.
Fig. 16: Chromatogram of acidic degradation.
5.4. ALKALINE DEGRADATION
one tablet was powdered and placed in a 50ml volumetric flask and dissolve in mobile phase
up to 75% then sonicate it for 10 minutes then add 1 ml of 0.1N NaOH then kept in an oven
[image:13.595.149.452.504.624.2]with mobile phase, then place the sample in the vial and inject into the system to record the
[image:14.595.148.449.134.237.2]chromatogram.
Fig. 17: Chromatogram of alkaline degradation.
5.5. THERMAL DEGRADATION
Sample solution of Valbenazine (10µg/ml) was placed in an oven at 1050C for 6 hr to study dry heat degradation. For HPLC study, the resultant solution was injected into the system and
the chromatograms were recorded to assess the stability of the sample.
Fig. 18: Chromatogram of thermal degradation.
RESULTS
The drug was found to be degraded extensively in all conditions.
6. RESULTS AND DISCUSSIONS 6.1. Solubility Studies
These studies are carried out at 250C.
Table 14: Solubility studies.
Solvent Name Valbenazine
Water Sparingly Soluble Methanol Soluble
[image:14.595.148.451.385.500.2]6.2. Determination of Working Wavelength (λmax)
The wavelength of maximum absorption (λmax) of the solution of the drug in mobile phase
were scanned using UV-Visible spectrophotometer within the wavelength region of 200–400
nm against mobile phase as blank. The absorption curve shows characteristic absorption
maxima at 264 nm for Valbenazine (Fig.19), 248 nm was selected as detector wavelength for
[image:15.595.144.451.211.374.2]the HPLC chromatographic method.
Fig. 19: UV-VIS Spectrum of Valbenazine (264 nm).
6.3 OPTIMIZED CHROMATOGRAPHIC CONDITIONS FOR ASSAY. Table 15: Optimized condition.
Mobile phase Acetonitrile : Water : Triethylamine
buffer (60:40: 0.5%) v/v
Column Phenomenex C18 (250×4.6 ×5µ) Flow rate 1.0mL/min
Column temperature Room Temperature (20-25°C) Wavelength 264 nm
Injection volume 20 µL
Run time 5 min
Retention time 1.190min
7. CONCLUSION
The developed method for the estimation Valbenazine was found to be simple, precise,
accurate and the high resolution and shorter retention time makes this method more
acceptable and cost effective and it can be effectively applied for routine analysis in research
institutions, quality control department. The method is fully validated for all parameters and
[image:15.595.145.457.460.590.2]ACKNOWLEDGEMENT
Authors are thankful to the Aurobindo Pharma Pvt. Ltd and Sultan-ul-Uloom College of
Pharmacy for providing facilities.
REFERENCES
1. "Valbenazine label" (PDF). FDA. April 2017. Retrieved 16 July 2017. For label updates see FDA index page for NDA 209241.
2. O'Brien, C. F.; Jimenez, R; Hauser, R. A.; Factor, S. A.; Burke, J; Mandri, D;
Castro-Gayol, J. C. "NBI-98854, a selective monoamine transport inhibitor for the treatment of
tardive dyskinesia: A randomized, double-blind, placebo-controlled study". Movement
Disorders, 2015; 30(12): 1681–1687.
3. "Tardive dyskinesia". Rarediseases.info.nih.gov. 1 June 2017. Archived from the original
on 18 June 2017. Retrieved 21 February 2018.
4. "NBI-98854 – VMAT2 Inhibitor | Tics in Children Treatment | Neurocrine Biosciences". Www.neurocrine.com. Archived fromthe original on 2015-01-30. Retrieved 2016-11-13. 5. Grigoriadis D, Comella C, Remington G, Jimenez R, Burke J, O’Brien C. Efficacy of
valbenazine (NBI-98854) in subjects with tardive dyskinesia: results of a long-term
extension study (KINECT 3 extension) [abstract] Neuropsychopharmacol, 2016; 41(S1):
S213.
6. Kilbourn M, Lee L, Vander Borght T, Jewett D, Frey K. Binding of
alpha-dihydrotetrabenazine to the vesicular monoamine transporter is stereospecific. Eur J
Pharmacol, 1995; 278(3): 249–252.
7. International conference on the harmonization. ICH Harmonized Tripartite Guideline.
Validation of Analytical Procedures: Text and Methodology Q2 (R1); November 2005.
8. Kim ES. Valbenazine: First Global Approval. Drugs, 2017; 77(10): 1123-1129.
9. Davis MC, Miller BJ, Kalsi JK, Birkner T, Mathis MV. Efficient Trial Design - FDA
Approval of Valbenazine for Tardive Dyskinesia. N Engl J Med., 2017; 29: 376(26): 2503-2506.
10.Kane JM, Correll CU, Liang GS, Burke J, O'Brien CF. Efficacy of Valbenazine
(NBI-98854) in Treating Subjects with Tardive Dyskinesia and Schizophrenia or