ANALYTICAL METHOD DEVELOPMENT AND VALIDATION OF
NAFTOPIDIL IN BULK AND DOSAGE FORM USING RP HPLC
Shruti Bika*1, Prashant Purohit2 and Yoshita Aggarwal3
1
Department of Quality Assurance, Rajasthan Pharmacy College, Jaipur, India. 2
Department of Quality Assurance, Lachoo Memorial College of Sceince and Technology,
Jodhpur, India, 3
Department of Pharmaceutics, Msahrishi Arvind Institute of Pharmacy, Jaipur, India.
ABSTRACT
A reversed phase High Performance Liquid Chromatographic method
for the estimation of Naftopidil has been developed. The drug was
separated on C 18 using Pot. Dihydrogen o-phosphate: ACN in ratio of
35:65 at flow rate of 1.0 ml/min. Components are detected
imultaneously at 232 nm using UV detector. The detection limits for
Naftopidil was 0.094 μg/ml where as the quantitation limits was 0.28
μg/ml. Linearity range was established in range of 05–10 μg/ml for
Naftopidil. Recovery of the added Naftopidil standard mixture in tablet
solution was found 100.8 % with Relative standard deviation (n=3) of 0.384 %. The proposed method has been applied to the determination
of Naftopidil in commercial products. The results obtained by methods were in good
agreement of true values. The proposed method is simple, accurate, reproducible and suitable
for routine analysis.
KEYWORDS: Naftopidil, RP HPLC, ICH.
INTRODUCTION
Introduction to High Performance Liquid Chromatography
HPLC is a chromatographic technique used to separate the components in a mixture, to
identify each component, and to quantify each component. It relies on pumps to pass a
pressurized liquid and a sample mixture through a column filled with a sorbent, leading to the
separation of the sample components. [1-4]
Volume 6, Issue 10, 792-805. Research Article ISSN 2277– 7105
Article Received on 07 July 2017,
Revised on 28 July 2017, Accepted on 17 Aug. 2017
DOI: 10.20959/wjpr201710-9362
*Corresponding Author
Shruti Bika
Department of Quality
Assurance, Rajasthan
Pharmacy College, Jaipur,
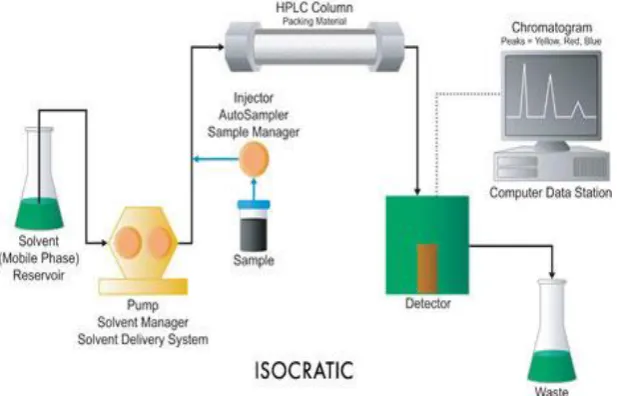
Fig. 1: A schematic diagram of HPLC equipment.
Various components of HPLC
1. A solvent delivery system, including pump,
2. Sample injection system,
3. A chromatographic column,
4. A detector,
5. A strip chart recorder,
6. Data handling device and microprocessor control.
Selection of buffer as a mobile phase in HPLC
In RP-HPLC the retention of analyte are related to their hydrophobicity. The more
hydrophobic the analyte the longer it is retained. When an analyte is ionized it become less
hydrophobic and retention decreased .When pH increases acid loose a proton and base gain a
proton when pH decreases and become ionized.[5-6]
For the most robust method it is recommended that separation be develop a mobile phase pH,
where a retention of ananlyte is little affected by changes in pH when separating bases. For
example - acid mobile phase usually show better reproducibility then neutral mobile
phases.[7-8]
Analytical method validation
Validation is an act of proving that when any procedure, process, equipment, material,
activity or system is performed as expected under given set of conditions then it should give
extended to an analytical procedure, depending upon the application, it means that a method
works reproducibly, when carried out by same or different persons, in same or different
laboratories, using different reagents, different equipments, etc.[9]
The various validation parameters used as per ICH guideline are:[10]
1. Accuracy.
2. Precision (intraday and inter day precision, Repeatability and Reproducibility).
3. Linearity.
4. Limit of Detection (LOD) and Limit of Quantitation (LOQ).
5. Ruggedness.
6. Selectivity/ Specificity.
7. Robustness/ Ruggedness.
Introduction of Naftopidil
Naftopidil is an α1-adrenergic receptor antagonist (α1-blocker) used to treat lower urinary
tract symptoms (LUTS) suggestive of benign prostatic hyperplasia (BPH). Different from
tamsulosin hydrochloride, in that it has higher and extremely higher affinity respectively, for
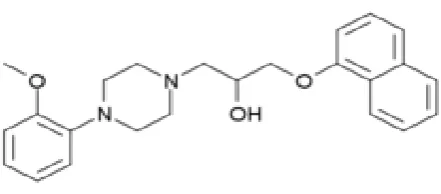
[image:3.595.188.409.487.584.2]the α1A-adrenergic receptor subtype than for the α1D type, naftopidil has distinct characteristics because it has a three times greater affinity for the α1D-adrenergic receptor subtype than for the α1A subtype.[11]
Fig. 2: Structure of Naftopidil.
IUPAC Name
4-(2-Methoxyphenyl)-alpha-((1-naphthalenyloxy)methyl)-1-pioerazineethanol
dichloride;(+-)-1-(4-(2Methoxyphenyl)piperazinyl) -3- (1-naphthyloxy)propan-2-ol dichloride.
Molecular formula C24H28N2O3.
Pharmacodynamics
Naftopidil is a novel alpha-1 adrenoreceptor blocker. The phenylpiperazine derivative
competitively inhibits prazosin-binding prostatic membrane receptors.[12] The selective action
against adrenoreceptors leads to reduced blood pressure and prostate pressure. Naftopidil
reduces the bladder outlet obstruction in benign prostate hyperplasia patients.[13]
Mechanism of Action
Benign prostatic hyperplasia (BPH) is common in men above a certain age throughout the
world. Alpha1-adrenoceptor antagonists is widely used as a conservative treatment to relieve
bladder outlet obstruction due to benign prostatic enlargement.[14] Naftopidil is a newly
synthesized alpha1-blocker that has been found to be effective in the treatment of BPH. This
drug is highly selective for the Alpha1A-, and Alpha1D-adrenoceptor subtypes, with an
affinity for the Alpha1D-adrenoceptor that is 3- and 17-fold higher than that for the Alpha1A-
and Alpha1B-adrenoceptors. Pharmacokinetics In healthy adult volunteers, after once oral
administration of Naftopidil alone with 25mg, 50mg and 100mg.[15]
MATERIALS AND METHODS
Chemicals and reagents
Naftopidil bulk drug was made available from Cadila Healthcare Pvt.Ltd Ahmedabad, Gujrat.
Orthophosphoric acid, methanol, Perchlorate buffer, Acetonitrile & Pot. Dihydrogen
o-phosphate were obtained from Loba Chem. All chemicals and reagent used were of HPLC
grade, Milli-Q-water was used throughout the experiment. Equipments: The Waters HPLC
system with a UV or photo diode array detector was used for method development and
validation. The output signal was monitored and processed by using Empower software.
Chromatographic condition: The mobile phase used Pot. Dihydrogen o-phosphate: CAN in
ratio of 35:65 at flow rate of 1.0 ml/min. The analytical column used Inertsil ODS C18 (4.0 x
250mm, 6 detection was carried out at a wavelength of 232 nm for a run time of 6 min.
Diluent used as Methanol.
Preparation of standard stock solution of Naftopidil
10 mg of Naftopidil was weighed accurately and transferred into 10 ml volumetric flask.
About 10 ml of HPLC grade Methanol was added and sonicated to dissolve. The volume was
made up to the mark with same solvent to form 1000 μg/ml solution. 1.0 ml of the stock
solution was further diluted in a 10 ml volumetric flask with same solvent to form 100 μg/ml
solution contained about 10 μg/ml of Naftopidil. The solution was filtered through the 0.45 m membrane filter and degassed under ultrasonic bath prior to use.
Preparation of Sample Solution of Naftopidil
One tablet was weighed, powdered and then the weight was transferred into a 100mL
volumetric flask, 50 mL of diluent added and sonicated for 25 min, further the volume made
up with diluent and filtered. From the filtered solution 1ml was pipette out into a 10 ml
volumetric flask and made up to 10ml with diluent.
RESULT AND DISCUSSION
Chromatograhic prameters were preliminary optimized to develop RP HPLC method for
estimation of Naftopidil with short analysis time 6 min, and accepted resolution (>2). The
isoabsoptive point of Naftopidil was 232 nm. In order to identify a suitable organic modifier,
various compositions of methanol, Pot. Dihydrogen o-phosphate and acetonitrile were tested
along with different buffer. Different columns like Inertsil and Inspire columns were tried.
Resolution and peak tailing were the measure problem while we are during developemnet of
method. Resolution and peak separation were very less when we are using one mobile phase,
to increase the resolution and better peak separation of methanol and water were used in
isocratic mode. Finally, separation for the determination Naftopidil was carried out by
isocratic elution with a flow rate of 1.0 ml/min at 232 nm using inertsil (ODS 250 x 4.6 mm)
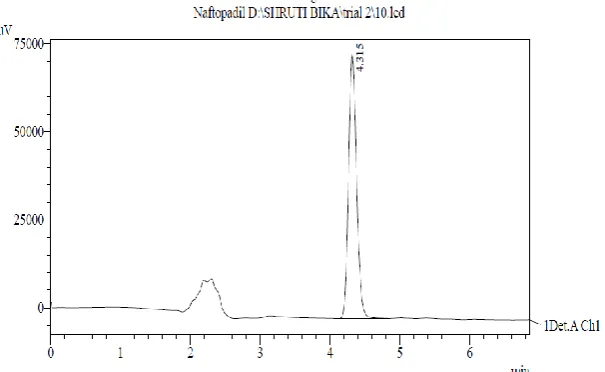
the standard chrometogram shown in fig 3.
Optimized Method: Drug was eluted with good resolution, retention time all the parameters
like Plate count and Tailing factor were within the limits.
Mobile phase
Pot. Dihydrogen o-phosphate: ACN 35: 65.
Chromatographic conditions
Flow Rate. 1.0 ml/min.
Column. ODS (215x4.6mm).
Detector Wavelength. 232 nm.
Column Temperature. 30oC.
Injection Volume. 10uL
Fig. 3: Optimized chromatogram of Naftopidil.
Table1: Final trial’s observations.
RET.TIME AREA HEIGHT THEORETICAL PLATES TAILING FACTOR
4.315 595450 75027 42010.484 1.218
Results and discussion
Here resolution was good and theoretical plate count for Naftopidil was 42010.484 which is
greater than 2000. The selected and optimized mobile phase was Pot. Dihydrogen
o-phosphatel: ACN in ratio of 35:65 and conditions of run were flow rate of 1 ml/min at
detection wavelength of 232 nm for 6 minutes where resolution, shape of peak was found
good with high number of theoretical plate counts and better symmetry. Hence
chromatographic condition was suitable for method development.
METHOD OF VALIDATION
The above method was validated according to ICH guidelines to establish the performance
characteristics of a method (expressed in terms of analytical parameters) to meet the
requirements for the intended application of the method. [16-17]
Specificity
Preparation and running of Naftopidil
The solution of Naftopidil was prepared. Accurately weighed 10 mg of Naftopidil was
transferred to 100 ml of volumetric flask and 100 ml of methanol was added to it. Now the
conc. Is 100µg/ml, from this solution 1 ml of was taken in 100 ml flask and 50 ml of
methanol was added common excipients used in tablet formulation such as 8% starch, 7%
solution and were sonicated for 20 minutes. Then solution was filtered through membrane
filter and volume was made up to the 100 ml with solvent system and degassed under
ultrasonic bath prior to use. The solution was then injected into the HPLC system. The
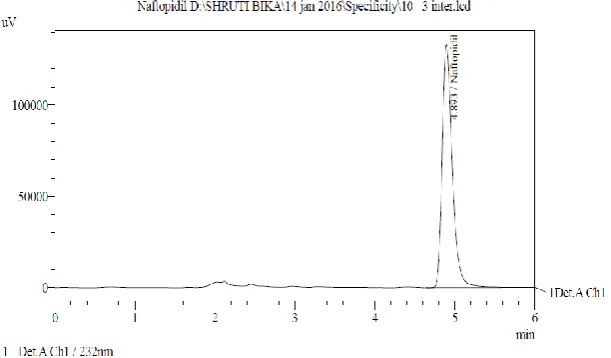
[image:7.595.146.452.178.357.2]chromatogram obtained of synthetic mixture is shown in figure 4.
Fig.4: Chromatogram for formulated synthetic tablet mixture.
Result and discussion
No excepients peaks were found at the retention time of Naftopidil hence Specificity studies
indicated that the excipients did not interfere with the analysis.
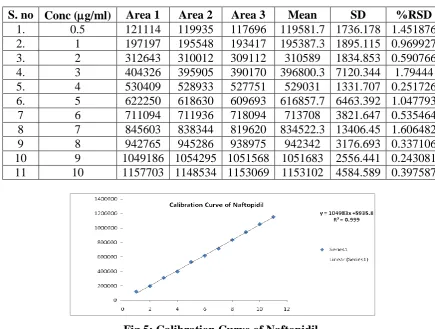
Linearity
Linearity range was found for Naftopidil from 0.5µg/ml to 10 µg/ml concentration. The
correlation coefficient was found to be 0.999 which showed good linearity between ranges.
The slope was found to be 5935.8 and intercept was found to be 104983
Preparation of calibration curve of standard API
The standard solutions of Naftopidil in the concentration range of 0.05 g/ml to 10 g/ml
were obtained by transferring 0.05, 0.1, 0.2, 0.3, 0.4, 0.5, 0.6, 0.7, 0.8, 0.9, and 1.0 ml from stock solution 10 g/ml to the series of six volumetric flasks of 10 ml. The volumes in each
volumetric flask were made up to the mark. The solutions were filtered, degassed and were
injected into column. The run time was 6 min and the peak areas were measured. The
Table 2: Calibration curve data for Naftopidil.
S. no Conc (g/ml) Area 1 Area 2 Area 3 Mean SD %RSD
1. 0.5 121114 119935 117696 119581.7 1736.178 1.451876 2. 1 197197 195548 193417 195387.3 1895.115 0.969927
3. 2 312643 310012 309112 310589 1834.853 0.590766
4. 3 404326 395905 390170 396800.3 7120.344 1.79444
5. 4 530409 528933 527751 529031 1331.707 0.251726
6. 5 622250 618630 609693 616857.7 6463.392 1.047793
7 6 711094 711936 718094 713708 3821.647 0.535464
8 7 845603 838344 819620 834522.3 13406.45 1.606482
9 8 942765 945286 938975 942342 3176.693 0.337106
[image:8.595.75.511.86.415.2]10 9 1049186 1054295 1051568 1051683 2556.441 0.243081 11 10 1157703 1148534 1153069 1153102 4584.589 0.397587
Fig.5: Calibration Curve of Naftopidil.
Accuracy
Accuracy of analytical method expresses the closeness of agreement between the value which
is expected either as conventional true value or an accepted reference value and the value
found. The results of analysis, obtained in three groups containing three replicate experiments
with API and different tablet dosage forms, had good agreement with the labeled amount of
the drug. The results are shown in Table 3.
Table 3: Accuracy.
Conc. Area Mean area SD %RSD
80% 434426
434112 431546
433361.33 5003.288 0.921368 100% 536348
533893 534592
534944.3 1264.856 0.236446
120% 631478 643323 629904
Table 4 : Data showing Recovery Study.
Conc C1 Conc µg/ml Mean area y= 104983x + 5935.8
C2 Conc x = (y - 5935.8) /
104983
% Recovery (c2/c1*100)
80% 4 433361.3 4.071 101.784
100% 5 534944.3 5.038 100.779
120% 6 634901.7 5.991 99.852
Mean % Recovery 100.805
RESULT AND DISCUSSION
The mean % recovery was found to be 100.8 % for Naftopidil. The values for % recovery for
80%, 100% and 120% were 101.784% , 100.779% and 99.852% respectively they fall within
the limit, hence it can be said that the proposed method was accurate.
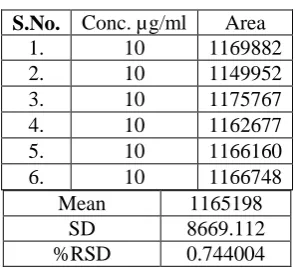
Precision
Repeatability
Repeatability precision was determined by using six time repetitions of the single target
concentration that is equivalent 100% level of target range that is 7µg/ml for Naftopidil. The
results are shown in table 5.
Table 5:Data showing repeatability analysis.
S.No. Conc. µg/ml Area
1. 10 1169882
2. 10 1149952
3. 10 1175767
4. 10 1162677
5. 10 1166160
6. 10 1166748
Mean 1165198
SD 8669.112
%RSD 0.744004
Result: The repeatability study which was conducted on the solution having the
concentration of about 10 g/ml Naftopidil, it showed RSD of 0.744004 %. Thus, it can be
concluded that the analytical technique showed good repeatability.
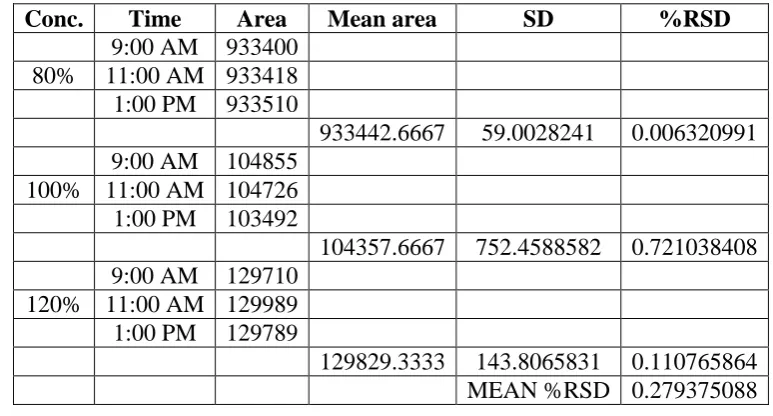
Intermediate precision
A. Intra-day precision
For intra-day precision studies the drug having concentration value 80%, 100% & 120% of
the target concentration (n 3), were injected in triplicate at same day at different times
Table 6: Data for the intra-day precision analysis
Conc. Time Area Mean area SD %RSD
9:00 AM 933400 80% 11:00 AM 933418 1:00 PM 933510
933442.6667 59.0028241 0.006320991 9:00 AM 104855
100% 11:00 AM 104726 1:00 PM 103492
104357.6667 752.4588582 0.721038408 9:00 AM 129710
120% 11:00 AM 129989 1:00 PM 129789
129829.3333 143.8065831 0.110765864 MEAN %RSD 0.279375088
Result
Intraday study showed a RSD of 0.279375 % for Naftopidil. It showed that the mean % RSD
was found to be within acceptance limit (≤2%). Thus, it can be concluded that the analytical
technique showed a good intra-day precision.
Inter-day precision
For inter-day studies the drug having concentration value 80%, 100% & 120% of the target concentration (n 3), were injected in triplicate into the HPLC system at three different days.
[image:10.595.104.490.91.297.2] [image:10.595.105.471.509.705.2]The results are shown in table 7.
Table 7: Data for the inter-day precision analysis.
Conc. Time Area Mean area SD %RSD
DAY 1 933410
80% DAY 2 933415
DAY3 933520
933448.3333 62.11548319 0.00665441
DAY 1 104595 100% DAY 2 104856 DAY3 103682
104377.6667 616.436804 0.590583047
DAY 1 129930 120% DAY 2 129269 DAY3 129929
129709.3333 381.3401806 0.293995945
MEAN %RSD 0.297077801
Result: Inter day study showed a RSD of 0.297077801% for Naftopidil. It showed that the
mean % RSD was found to be within acceptance limit (≤2%). Thus, it can be concluded that
Limit of detection and Limit of quantification
Limit of detection is the lowest amount of analyte that can be detected but not quantitated as
an exact value and Limit of quantitation is the lowest amount of analyte that can be
quantitatively determined in a sample with suitable precision and accuracy.
The detection limit (LOD) and quantitation limit (LOQ) may be expressed as:
LOD = 3.3(SD/S) and
LOQ = 10(SD/S)
Where, SD = Standard deviation of the response, S = Slope of the calibration curve
The slope S may be estimated from the calibration curve of the analyte. The results are shown
inTable 8.
Table 8: Limit of detection and quantitation.
Linearity 1 Linearity 2 Linearity 3 Intercept SD Slope mean
Intercept 85338 82515 79176 3084.599
Slope 107308 107382 107356 107348.7
LOD = 3.3 * Intercept/Slope
LOD = 3.3 * 3084.599/107348.7
LOD = 0.094823
LOQ = 10 * Intercept / Slope
LOQ = 10* 3084.599/107348.7
LOQ = 0.287344
Result
The LOD was found to be 0.094823 g/ml and LOQ was found to be 0.287344 g/ml which
showed that sensitivity of the method was high.
ROBUSTNESS
Flow rate variation by minus 0.1 ml/min (0.9 ml/min) was set keeping all other conditions
same as before and triplicate observation of the single target concentration that is 10µg/ml for
Naftopidil were determined.
Flow rate variation by plus 0.1 ml/min (1.1 ml/min) was set and triplicate observation of
Table 9:
Flow rate at 0.9ml/min At 1.1 ml/min
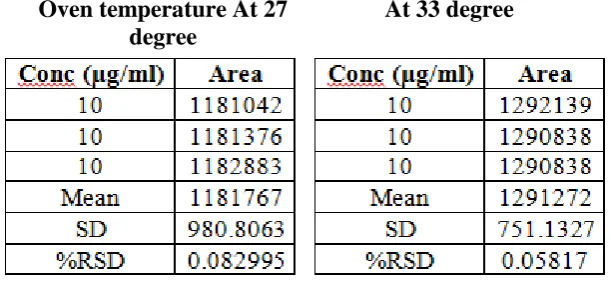
Change In Oven Temperature
Oven temperature variation by minus 3 degree (27 degree) was set for the analysis of
variation in oven temperature by using triplicate observation of 10µg/ml of Naftopidil.
Table 10:
Oven temperature At 27 degree
At 33 degree
Table 11:
Result: No significant differences in the results were obtained by making variations in the
flow rate, wavelength and oven temperature within the established limits in the developed
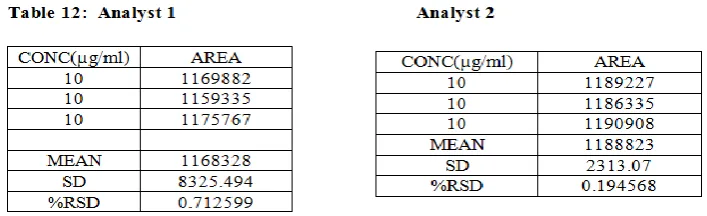
ROGGEDNESS
Ruggedness was tested by keeping all the method conditions same but with different analysts
i.e observations were taken by analyst 1 and then by analyst 2.
Result: No significant differences in the results were obtained by taking observations by two
different analysts. The % RSD value was within the limits (less than 2%), thus the method
was rugged.
[image:13.595.119.473.288.396.2]SUMMARY AND CONCLUSION
Table 13: Summary Table
S.No. Parameters Naftopidil
1. Retention Time (min) 4.5
2. Theoretical Plates 49039.312
3. Asymmetry 1.238
4. Wavelength 232nm
5. Concentration range 0.5-10 µg/ml
6. Regression equation
y = mx + c y = 104983x + 5935.8
7. Correlation coefficient r2 0.999
8. Slope (m) 104983
9. Intercept (c) 5935.8
10. Oven temperature 30 degree
11. Flow rate 1 ml/min
CONCLUSION
RP-HPLC methods were developed for Naftopidil as API. In RP-HPLC estimation methanol
Dihydrogen o-phosphate: ACN in ratio of 35:65 at flow rate of 1.0 ml/min. Linearity range
was found to be 0.5-10 µg/ml.
REFERENCES
1. Willard H., Merrit L.Instrumental methods of Analysis. 7thedn.New Delhi: C.B.S.
Publishers and Distributors, 2003; 610-614.
2. Skoog DA. Introduction to UV Spectroscopy in Principle of Instrumental analysis. 5thedn.
Thomson Brooks/Cole publication, 2004; 301: 893-90.
3. Sharma YR.Ultraviolet and Visible spectroscopy in Elementary Organic
Spectroscopy.1stedn. New Delhi: S. Chand & Company Ltd., 2004; 19-36.
4. Kalsi PS. Spectroscopy of Organic Compounds. 5thedn. New Delhi: New Age
International Publishers, 2004; 7-15
5. Beckett AH., Stenlake JB. UV-visible Spectrophotometry: Practical Pharmaceutical
Chemistry. 4thedn. New Delhi: C.B.S. Publishers, 2001; 285-297
6. Dyer JR. Application of Absorption Spectroscopy of Organic Compounds. 2ndedn. New
Delhi: Prentice Hall of India Pvt. Ltd, 2005; 243-253.
7. Fronk AS. Handbook of Instrumental Techniques for Analytical Chemistry. 1st edn.
Pearson Education, 2004; 17-23.
8. Braun RD, Introduction to Instrument Analysis. 4thedn. Hyderabad:Pharma book
syndicate, 2005; 261-272.
9. Nash RA., Wachter AH. Pharmaceutical Process Validation. 3rdedn.New York: Marcel
Dekker, Inc., 2003; 507-522.
10.Validation of Analytical Procedure Methodology. ICH Harmonized Tripartite Guideline,
Q2 R1, 2005; 1-8.
11.Wikepedia Naftopidil http://en.wikipedia.org/wiki/Naftopidil accessed on 18/04/2013.
12.Chemicalland21 http://www.chemicalland21.com/ Naftopidil, accessed on 5/04/2013
13.Drug Bank http://www.drugbank.com/drugs/Naftopidil accessed on 19/04/2013.
14.Druginfosys http://www.druginfosys.com/drugs/Naftopidil accessed on 19/04/2013.
15.Pubmed http://www.pubmed.com/drugs/Naftopidil accessed on 19/04/2013.
16.Validation of Analytical Procedures: Text and Methodology. ICH Harmonized Tripartite
Guideline, Q2B, 1996; 1-12.
17.Michael ES., Ira SK. Analytical Method Development and Validation. 4thedn. New York: