University of South Carolina
Scholar Commons
Theses and Dissertations
1-1-2013
Thermal Infrared Imaging: Instrumentation and
Method Development
Wayne O'Brien
University of South Carolina
Follow this and additional works at:https://scholarcommons.sc.edu/etd Part of theChemistry Commons
This Open Access Thesis is brought to you by Scholar Commons. It has been accepted for inclusion in Theses and Dissertations by an authorized administrator of Scholar Commons. For more information, please [email protected].
Recommended Citation
O'Brien, W.(2013).Thermal Infrared Imaging: Instrumentation and Method Development.(Master's thesis). Retrieved from
Thermal Infrared Imaging: Instrumentation and Method Development
by
Wayne L. O‟Brien
Bachelor of Science Dalton State College, 2011
Submitted in Partial Fulfillment of the Requirements
For the Degree of Masters of Science in
Chemistry & Biochemistry
College of Arts and Sciences
University of South Carolina
2013
Accepted by:
Michael Myrick, Director of Thesis
John Ferry, Reader
D
EDICATIONThis thesis is dedicated to my grandfather, William “Pete” Thompson. I grew up
with memories of him but very little conversation. Later in life, I learned all about his
past: being a Christian, WWII POW, a craftsman, a mechanic, a husband, a father, a
friend, and a grandfather. I will always strive to follow your example in creed, integrity,
A
CKNOWLEDGEMENTSOn my academic career, I have many individuals to thank. First, I am blessed to
be in this position because of the Lord. I have followed Christ‟s example to the best of
my ability and I will never cease striving to be more like Him.
My parents and sisters have been an important role of encouragement. My
mother, Nancy Gent, is always there to help me through harder days while my father,
Ken O‟Brien, always gives me truthful advice for any situation, rather large or minute.
Both parents have taught me countless factoids about life. I am very blessed to have
wonderful parents. My sisters have encouraged me to push through the science, answer
my weird medical questions, share common interests, and allowed for relaxing visits
home. Britney Redpath, you have supported me every day and every night. Your smile
and your encouraging words have kept me inspired to keep pushing to achieve something
more. I am honored and blessed to call you my friend and my significant other. My
friends from my hometown life: John Lobb, Michael Ferguson, Tanner Waters, and many
more; thank you for support into push myself to achieve the next step in my career. My
friends from graduate school: Stephanie DeJong, Shawna Tazik, Justin Copeland, David
Arenivar, Audrey Duke, and more; thank you for support and enduring me over the few
years we have known each other. You all have taught me too many things to list and have
helped me evolve into a better person and a better scientist.
To my academic mentors; Dr. Michael Myrick, I am especially grateful for your
knowledge as both a scientist and individual. He identified the areas where I excel and
where I fail; he has critique them to expect the best out of me. I will carry the he has
taught me for the rest of my professional career. To Dr. Dean Turner, thank you enduring
the many trips to your office, the career advice, and knowledge you gave me within the
chemistry world. Your mentoring has helped me on a tremendous scale. Dr. Richard
Collison, not to be confused with Dr. Collision or Santa Claus, thank you for exposing
me to the world of chemistry and offering me the opportunity to be the first Bachelor of
Science in chemistry from Dalton State. Thank you for the many days of sitting in your
office asking you random questions concerning white phosphorous or identifying the
longest carbon chain.
To my professional work mentors, Don Henson and Regina Loveless: thank you
for the many years of employment, teaching the principles of operating a business, and
A
BSTRACTA recent development thermal infrared camera system was improved by designing
new components to downsize physical aspect and improve the instrument‟s performance.
A new thermal infrared light source was developed and characterized. It is designed from
a custom-made Macor backpiece that holds an alumina screw. High resistance wire is
coiled around the screw. The coiled wire is covered with an alumina coating. Most light
sources have a spectral emissivity similar to that of a blackbody emitter. This source has
a spectral irradiance profile that is not similar to a blackbody source. Thus, the lamp has
an improved efficiency in the thermal infrared region.
The thermal infrared camera‟s microbolometer detector was calibrated for its
response at specific wavelengths. An infrared camera responds with a single value that is
the sum of all detectable wavelengths. This was done by developing a method to
determine the spectral response from the camera a given wavelength. At 8 µm, the
camera‟s response is an instant onset; yet at longer wavelengths, the camera‟s response
diminishes at a slower rate.
A technique has been discovered that identifies differences on a surface using a
thermal infrared camera. This technique exploits differences in polarity and heat capacity
by exposing the surface to hot water vapor. We demonstrate this by showing the
application of identifying blood on fabrics. Bloodstains that are diluted more than 20x are
barely or not visible to the human eye. Our method uses a handheld steamer and a
cameras, a small increase in temperature can easily be detected: this leads to visual
contrast when observing the thermographic movie. Evidence suggests that the change in
T
ABLE OFC
ONTENTSDEDICATION ... iii
ACKNOWLEDGEMENTS ... iv
ABSTRACT ... vi
LIST OF FIGURES ... ix
CHAPTER 1:INTRODUCTION ...1
1.1INTRODUCTION TO THERMAL INFRARED IMAGING ...1
BIBLIOGRAPHY ...2
CHAPTER 2:INFRARED LIGHT SOURCE ...4
2.1INTRODUCTION ...4
2.2DESCRIPTION OF IRSOURCES ...6
2.3RADIOMETRY ...8
2.4RESULTS &DISCUSSION...10
2.5CONCLUSION ...16
BIBLIOGRAPHY ...17
CHAPTER 3:THERMAL INFRARED CAMERA CALIBRATION ...20
3.1BACKGROUND ...20
3.2EXPERIMENTAL ...21
3.3RESULTS &DISCUSSION...24
3.4CONCLUSION ...25
CHAPTER 4:LATENT HEAT THERMOGRAPHY ...28
4.1INTRODUCTION ...28
4.2EXPERIMENTAL ...29
4.3RESULTS &DISCUSSION...31
4.4CONCLUSION ...38
BIBLIOGRAPHY ...38
APPENDIX A:MATLAB CODE ...41
L
IST OFF
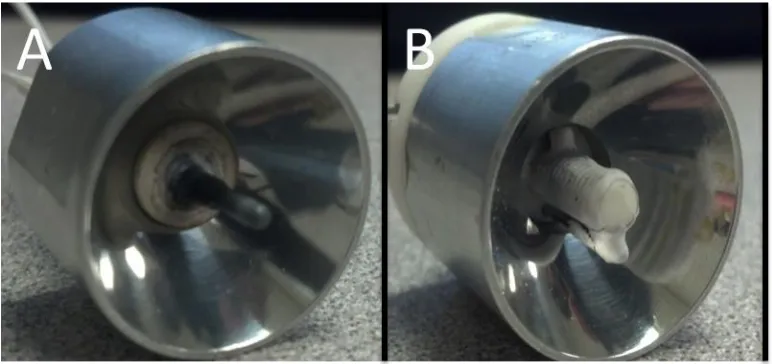
IGURESFigure 2.1 Infrared lamps evaluated in this work. (A) is the Hawkeye Technologies IR-18. (B) is the alumina lamp described in the text. A thin layer of the same alumina paste that coats the nichrome coil is used to coat the spot welds of the filament to the thicker nichrome contacts to prevent oxidation on the connection due to overheating. ...7
Figure 2.2 Schematic of alumina lamp. Al is an alumina screw. B is a base machined from Macor ®. NP is one of two thick nichrome posts used as contacts for the filament. M is a modifed Hawkeye Technologies 1” parabolic mirror. The posts were inserted into the Macor® base and bent into slots cut on its back, then held in place by installing the large alumina screw. The filament wire was wound around the exposed screw threads and spot welded to the nichrome posts. Alumina paste was then coated over the exposed filament and dried. The base was then inserted into the mirror and held in place with two screws. Not shown in this schematic are the filament itself, the alumina paste, and the two screws just mentioned. The components are more fully described in the text ...8
Figure 2.3 Spectral Irradiance of 3 infrared sources used in our work normalized to unit area in the 8-14 µm wavelength band viewed by a thermal camera. The dashed line is the irradiance of the hotplate infrared source. The lowest-temperature source, the hotplate, has the lowest out-of-band emission, but with low overall emission per unit area of heated surface. The higher temperature source, the commercial IR-18 lamp (top curve), has the highest out of band emission of the three tested, and fits the shape of a blackbody emission curve for 1000 K under the conditions of this test. The alumina lamp described here is also a high temperature source, but has lower out of band emission due to the low emissivity characteristic of alumina at wavelengths shorter than 5 µm ...11
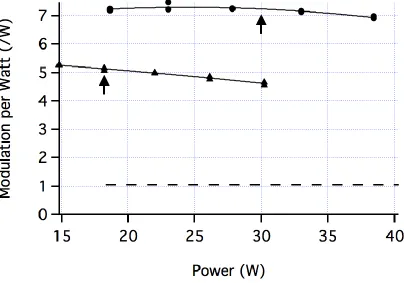
Figure 2.4 Benchmark test of the irradiance of three infrared sources as modulation in units of the 16-bit A/D signal of a FLIR Systems A315 thermal infrared camera per unit power supplied to the source. The black dashed line at the bottom shows the benchmark behavior of the hotplate used in Reference 1. The upper curve through circles is the test result for the alumina lamp described here; the middle curve through triangles is the test result for the IR-18 lamp for comparison. Arrows indicate the nominal rated power for the commercial lamp, and the 1000+ hour lifetime tested power of the homemade
alumina lamp. Both of these higher temperature sources use the same parabolic reflector element while the hotplate has none, which is the main reason the hotter sources with higher out-of-band emission provide a higher modulation per watt in the 8-14 µm range than the hotplate ...15
position during the measurement of the standard detector but the chopper was removed 22
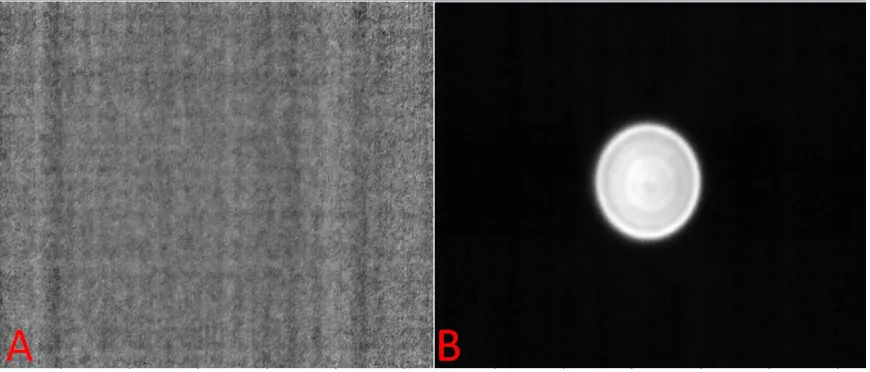
Figure 3.2 Image A is the AC image at 7600 nm; Image B is the AC image 9500 nm. In image A, there is no response observed by the camera while image B shows a high response to the different wavelength of light. Image B shows a high response to the radiation at that wavelength: so high that the background is blacked out. ...23
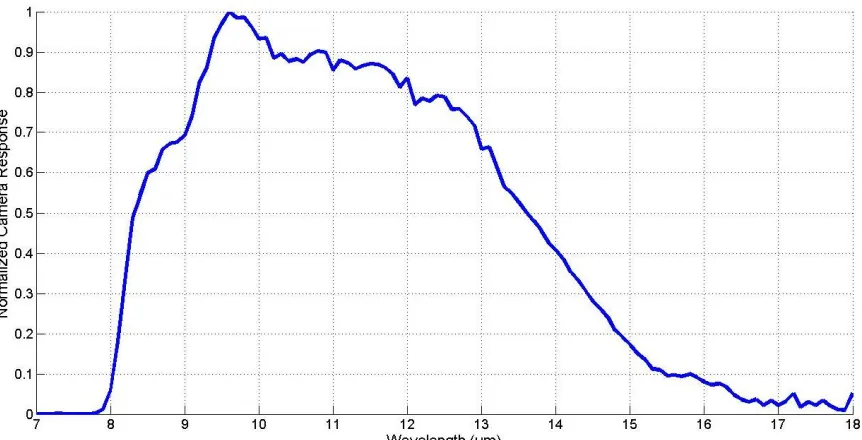
Figure 3.3 This is the response, or sensitivity, curve for the FLIR A315. From 7.0 to 14.0 µm, the LG 100-75 was used; beyond 14.0 µm, the LG-225-40 was used. This changing point was set by the MC‟s software and the manufacturer. The final response values were ratio to the maximum value so that the wavelength with the highest response would be equal to 1 ...24
Figure 4.1 Image A shows the acrylic fabric with a 12-inch ruler. One can observe the „I‟, the „X‟, and the „V‟, but the other two bloodstains are not visible. Image B show the polyester fabric with the sewn-in skull prints. The bloodstains are not visible even with close examination. The skull pattern is the type that is iron onto the fabric during
production ...31
Figure 4.2 The 9 images are thermographic images taken from the FLIR A315. The red number corresponds to the frame number. The vertical lines that are observed in frame 900 and beyond are creases in the fabric. About 30 seconds after frame 2400, the fabric returns to its original condition. ...33
Figure 4.3 Pixel data from steaming the acrylic fabric. The pink line, listed as the background, represents the neat acrylic fabric. The red and blue lines represent the „C‟ and the „X‟, respectively. Notice how the fabric experiences the same oscillation as the bloodstains yet the magnitude is difference. It also appears that the bloodstained areas have a higher slope than the fabric. ...34
Figure 4.4 These are six images from the thermographic recording of the steaming the polyester fabric. The red numbers present the frame number. Frame 1 shows the passive thermographic image ...36
Figure 4.5 Pixel data from neat and bloodstained polyester fabric areas. These pixels were separated spatially by 1 cm.The bloodstained area shows a higher response to the steam initially, but the difference in response between the neat and bloodstained areas becomes less over time. At the end of the process, the bloodstained fabric cools to a lower temperature faster than neat the neat area as observed in Figure 4.4. This would lead to the following hypothesis: there is a small difference in the enthalpy of adsorption between blood proteins on polyester fabrics and neat polyester fabric, the blood on the surface of the fabric does not sign ...37
the 1000x diluted bloodstain and the portion of the 100x stain that was within the
CHAPTER
1
I
NTRODUCTION1.1 INTRODUCTION TO THERMAL INFRARED IMAGING
Instrumentation in every industry is constantly evolving to keep up with the ever
changing samples and arising challenges within every respective field. Some instruments
have developed over centuries and some are still in early stages of invention. The
important factor when redesigning an instrument is how a new component affects the
instrument‟s performance. The work presented here is focused on one specific purpose:
to improve and enhance thermal infrared (IR) imaging of latent stains at crime scenes.
This includes improvements in instrumentation, understanding one type of detector used
in this process, and the early investigations of a new technique discovered that detects
latent stains.
Infrared thermography is used for many applications. An infrared camera has
been used a chemical vapor detector; some systems are equipped with filters fabricated to
isolate specific adsorption bands (1, 2). IR thermography has been applied to medicinal
applications because of its ability to detect minute temperature differences (3-5). Other
applications include using IR cameras for engineering and building applications (6-8).
There are two types of thermography: active and passive. Passive thermography images a
surface without an external stimulus being applied to the situation (9). This technique can
be used by masonry to identify hidden architecture feature. Active thermography
induces a temperature change (9). Both of these techniques are used to gather information
about objects without contaminating or manipulation.
Our research is focused using a thermal infrared camera system to identify blood
and other biological stains at crime scenes. An instrument was developed, which is
described by Brooke et. al., that is capable of imaging blood with dilutions as low as
1:100. This work has focused on improving and calibration specific components of that
instrument; specifically, a new light source is fabricated that is more efficient in the
thermal infrared region and a process to calibrate a thermal infrared camera for its
spectral response. And this work will include a new technique that has developed that
aids in identifying latent prints on fabrics. These advances in thermal infrared imaging
and method of detecting latent prints will allow future developments in thermal IR
imaging.
BIBLIOGRAPHY
1. Althouse, M.L.G.; Chang, C.I. Chemical vapor detection with a multispectral thermal imager. Optical Engineering. 1991, 30, 1725-1732.
2. Safitri, A.; Mannan, M.S.; Methane Gas Visualization Using Infrared Imaging System and Evaluation of Temperature Dependence of Methane Gas Emissivity.
Industrial & Engineering Chemistry Research. 2010, 49, 3926-3935
3. Arora, N.; Martins, D.; Ruggerio, D.; Tousimis, E.; Swistel, A.J.; Osborne, M.P.; Simmons, R.M. Effeictiveness of a noninvasive digital infrared thermal imaging system in the detection of breast cancer. The American Journal of Surgery. 2008, 196, 523-526.
4. Rich, P.B.; Dulabon, G.R.; Douillet, C.D.; Listwa, T.M.; Robinson, W.P.; Zarzaur, B.L.; Pearlstein, R.; Katz, L.M. Infrared Thermography: A rapid,
5. Salaimeh, A.A.; Campion, J.J.; Gharaibeh, B.Y.; Evans, M.E.; Saito, K. Real-time quantification of Staphylococcus aureus in liquid medium using infrared
thermography. Infrared Physics & Technology. 2012, 55, 170-172.
6. Ummenhofer, T.; Medgenberg, J. On the use of infrared thermography for the analysis of fatigue damage processes in welded joints. International Journal of Fatigue.2009, 31, 130-137.
7. Fan, J.; Guo, X.; Wu, C. A new application of the infrared thermography for fatigue evaluation and damage assessment. International Journal of Fatigue.
2012, 44, 1-7.
8. Madruga, F.J.; Gonzalex, D.A.; Mirapeix, J.M.; Lopez Higuera, J.M.Application of infrared thermography to the fabrication process of nuclear fuel containers.
NDT&E International. 2005, 38, 397-401.
9. Mercuri, F.; Zammit, U.; Orazi, N.; Paoloni, S.; Marinelli, M.; Scudieri, F. Active Thermography applied to the investigation of art and historic artefacts. Journal of Thermal Analysis and Calorimetry. 2011, 104, 475-485.
10.Brooke, H.; Baranowski, M.R.; McCutcheon, J.N.; Morgan, S.L.; Myrick, M.L. Multimode Imaging in the Thermal Infrared for Chemical Contrast Enhancement. Part 1: Methodology. Anal Chem.2010, 82, 8412-8420.
11.Brooke, H.; Baranowski, M.R.; McCutcheon, J.N.; Morgan, S.L.; Myrick, M.L. Multimode Imaging in the Thermal Infrared for Chemical Contrast Enhancement. Part 2: Simulation Driven Design. Anal. Chem.2010, 82, 8421-8426.
12.Brooke, H.; Baranowski, M.R.; McCutcheon, J.N.; Morgan, S.L.; Myrick, M.L. Multimode Imaging in the Thermal Infrared for Chemical Contrast Enhancement. Part 3: Visualizing Blood on Fabrics. Anal. Chem. 2010, 82, 8427-8431.
13.Brooke, H. Bridging the Modeling-Sampling Gap of Mid-Infrared Reflectance Spectroscopy of Small Particles, Films, and Fibers. Ph.D. Dissertation, University of South Carolina, Columbia, SC, 2010.
CHAPTER
2
I
NFRAREDL
IGHTS
OURCE 2.1 INTRODUCTIONInfrared (IR) light sources have evolved over the past two centuries since the
discovery of infrared radiation in sunlight (1). The first intentionally man-made source of
infrared radiation for radiant energy studies was the Leslie cube, developed in 1804 (2,
3). Macedonio Melloni used a variety of objects heated in alcohol flames as infrared
sources in 1835 (4). The Bunsen burner was invented in 1855 (5) and was used by
Kirchhoff as an infrared light source (6, 7), which was common until the carbon filament
lamp was invented in 1880. In 1889, Knut Angstrom‟s measurement of the spectra of the
oxides of carbon used a modified Argand oil lamp. The Welsbach gas mantle was
developed in 1890 and used around the turn of the 20th century for far infrared
measurements because of its good emission properties beyond 10 µm wavelength (8-10).
The Nernst glower was developed for home lighting (11); it was quickly replaced for that
purpose by the tungsten filament lamp, but persisted for some time as an infrared light
source. This was the light source used by Coblentz in his early work on the infrared
absorption spectroscopy of organic compounds (12). The most common source in use for
infrared spectroscopy today is the silicon carbide Globar, which name was trademarked
in 1925 and described in 1938 by Strong (13-16).
In 2010, Brooke et al. showed that a conventional microbolometer-based thermal
1000-W electrically heated hotplate was used as a light source to overcome the large blackbody
emission of objects at room temperature and to provide adequate signal to noise ratio
(SNR) in reflectance images. For our future work, we desired a more compact and
manageable long-wave infrared source that offered the potential for portable battery
powered operation. Available commercial off-the-shelf units sold as infrared sources
were all relatively low power devices with high temperature blackbody emission profiles.
We report here the result of our effort to fabricate a lamp that would be more efficient
and powerful in the 8-14 µm wavelength region.
The major IR sources designed for benchtop IR spectrometers and infrared
photometers are essentially compact high temperature sources of near-blackbody
radiation, which means their maximum emission spectral intensity is shifted toward the
visible region, and away from the room temperature thermal region viewed by most
thermal cameras. In addition, many of the commercial sources are intended for uses in
collimated optical systems, so the total power of the source is not of primary importance.
For such instruments, it is the emittance of the lamp, the power per unit area, which is
more important. Thermal reflectance imaging as in References 17-19, on the other hand,
requires a high total power in the 8-14 micrometer wavelength region, and no commercial
thermal sources are optimized in this spectral region.
Infrared LEDs have also been reported that reach the mid-infrared spectral region
(20-22). To date, these are not commercially available for the thermal wavelength range
and are of low power compared to the commercial blackbody sources just mentioned.
Many small near-blackbody IR emitters, designed for a variety of purposes, have been
wavelength (23-28). Still other narrow-band infrared emitters have been developed (29,
30), but none are commercial with high total power in the 8-14 µm wavelength range.
And although lasers are commercially available for this spectral window, their cost per
unit power compared to a heated blackbody source is quite high (31, 32), even for the
common CO2 welding laser.
The source we present below is based on an alumina machine screw that is
electrically heated using nichrome wire wound about the screw threads and inserted into
a parabolic reflector. The total power of the lamp exceeds 30 W with an efficiency that is
nearly twice that of blackbody emitters in the thermal wavelength band. Approximately
5 of these lamps provide equivalent irradiance in the 8-14 µm band to the 1000 W
hotplate source used previously.
2.2 DESCRIPTION OF IR SOURCES
The original source used in Reference 17-19 was a GE 1000 W hotplate (Model
169215) with a black coated surface rather than an exposed heating coil; it can be
purchased from a number of consumer retailers. In experiments reported below, the
hotplate was operated at its highest power.
The Hawkeye Technologies IR-18 (Figure 2.1A) is a silicon nitride source that
encased in a 25.4-mm-diameter aluminum parabolic reflector. Silicon nitride has
emission profiles that similar to that of a blackbody. The manufacturer‟s recommended
Figure 2.1 Infrared lamps evaluated in this work. (A) is the Hawkeye Technologies IR-18. (B) is the alumina lamp described in the text. A thin layer of the same alumina paste that coats the nichrome coil is used to coat the spot welds of the filament to the thicker nichrome contacts to prevent oxidation on the connection due to overheating.
The lamp that we constructed (Figure 2.1B and Figure 2.2) is based on a
25.4-mm-long #10-32 alumina screw (purchased through Amazon.com) mounted into a
backplate made of the machinable ceramic Macor as a high temperature filament support.
A schematic section of the lamp is shown in Figure 2.2. Two short 0.040-inch nichrome
A wires run through the Macor back-piece parallel to the alumina screw to serve as
electrodes. Another length of 0.010-inch nichrome A is coiled into the threads of the
alumina screw to serve as a filament. Both sizes of nichrome wire were purchased from
Scientific Instrument Services. The screw threads provided protection against short
circuiting between loops of the filament. The ends of the coil are spot welded to the
0.040-inch nichrome electrodes. A thin layer of Ceramabond (Aremco Products, Inc), an
alumina-based adhesive, is brushed over the coil and the connecting electrodes. The
alumina coating is cured in an oven at 100°C. The finished filament assembly fits into a
version of the IR-18 mirror) and is labeled as the “alumina lamp” in Figure 2.1.
Engineering drawings of the lamp are available upon request. A lamp without the
alumina coating was evaluated to observe how the coating influenced the spectral
irradiance.
Figure 2.2. Schematic of alumina lamp. Al is an alumina screw. B is a base machined from Macor ®. NP is one of two thick nichrome posts used as contacts for the filament. M is a modifed Hawkeye Technologies 1” parabolic mirror. The posts were inserted into the Macor® base and bent into slots cut on its back, then held in place by installing the large alumina screw. The filament wire was wound around the exposed screw threads and spot welded to the nichrome posts. Alumina paste was then coated over the exposed filament and dried. The base was then inserted into the mirror and held in place with two screws. Not shown in this schematic are the filament itself, the alumina paste, and the two screws just mentioned. The components are more fully described in the text.
2.3 RADIOMETRY
The Optronics Laboratories Inc. 750-M-S system was used to determine the
spectral irradiance and quantify each lamp‟s output. A cooled Mercury Cadmium
second integration time for all measurements. The entrance and exit slits were 5 mm
round apertures. A blackbody radiator (model OL 480 Variable Temperature Blackbody
Calibration Standard) operating at 1200 K was used for calibration and standards in both
experiments. The software used to interface with the monochromator was OL 750
Software Applications version 1.25.
Measurements of the spectral irradiance of each lamp were made as follows.
Several of the lamps tested used the same parabolic reflector mirror. For these, the center
of the reflector was aligned normal to the entrance aperture of the spectrometer at a
distance of 75 cm. Each lamp was evaluated at an input power of 30(±0.1) watts. The
hotplate was evaluated at maximum output with the normal to the heated surface aligned
opposite the normal to the spectrometer entrance slit and at a distance of 75 cm.
A performance benchmark was measured to compare the various lamps to one
another. Lamps were aligned and positioned 61 cm away from a 51-mm-dia gold diffuse
reflectance standard (Optronic Laboratories). The standard was observed with a thermal
imaging camera (FLIR Systems, Model A315). The gold diffuse reflectance standard
was observed to have a significant specular (non-diffuse) reflection that was very
sensitive to alignment, so the standard was oriented to prevent the specular reflection
from being inadvertently observed by the camera. Each source was modulated at 1 Hz;
the small lamps were modulated with a chopper, while the hot plate was manually
modulated by interposing an aluminum-foil-covered cardboard panel between the
hotplate and diffuse reflector. The camera records 16-bit data at 60 frames per second
through a custom LabVIEW 2012 (National Instruments, Austin TX) program; for each
the form of a near-square wave as each lamp is modulated. The modulation of the signal
from absorbing materials is complicated by the heating of the material caused by the
lamps, which results in an increased thermal emission signal; the gold diffuse reflectance
standard has very little absorption and very low emissivity and so was used to minimize
heating and re-emission effects. The magnitude of modulation from a 30x25 pixel array
of the standard was calculated then averaged. These values are taken as proportional to
the integrated irradiance of each lamp over the thermal wavelength band observed by the
camera, approximately 8-14 µm.
Since the alumina lamp was found to provide the highest overall efficiency in
these tests, and also to operate at the highest power, one new lamp of this type was tested
at 30 W operating input power in air for more than 1000 hours of continuous operation
without failure or significant change in output.
2.4 RESULTS & DISCUSSION
A lamp used for active reflectance imaging of a large area with a thermal infrared
camera needs to have significant power in the 8-14 µm wavelength range to compete
with the natural thermal emission of materials at room temperature. As a comparison
figure, a blackbody source at room temperature emits about 450 W/m2, of which 170
W/m2 is in the 8-14 µm band. Although most low-cost cameras for this wavelength
region use thermal detectors whose noise is independent of signal, the reflected light
intensity must still be within at least a couple of orders of magnitude of this value for
acceptable reflectance imaging. Samples with low reflectance – many natural and
correspondingly higher irradiance from the source to provide this level of reflected
intensity.
Figure 2.3 Spectral Irradiance of 3 infrared sources used in our work normalized to unit area in the 8-14 µm wavelength band viewed by a thermal camera. The dashed line is the irradiance of the hotplate infrared source. The lowest-temperature source, the hotplate, has the lowest out-of-band emission, but with low overall emission per unit area of heated surface. The higher temperature source, the commercial IR-18 lamp (top curve), has the highest out of band emission of the three tested, and fits the shape of a blackbody emission curve for 1000 K under the conditions of this test. The alumina lamp described here is also a high temperature source, but has lower out of band emission due to the low emissivity characteristic of alumina at wavelengths shorter than 5 µm.
Figure 2.3 shows the irradiance profile for each lamp located at a distance of 75
cm, with each curve having been normalized to the same area under the curve in the 8-14
µm band.
The 1000 W hotplate was operated at maximum power and was measured to have
is near 5.9 µm and its shape is consistent with a temperature near 500 K. As the figure
illustrates, an infrared source at such a low temperature has a very high relative efficiency
for the 8-14 µm wavelength range, since the normalized out-of-band emission is the
lowest among the lamps studied. Unfortunately, the Stefan-Boltzmann law tells us that
this is achieved at the cost of having a low emittance per unit area: although 33% of its
radiation lies in the 8-14 µm band, a blackbody radiator at 500 K emits only 0.35 W/cm2
integrated over all wavelengths. As a result, a low temperature source requires a large
emitting surface area, making modulating and directing the light more difficult. Despite
the high total input power of the hotplate and good distribution of the emitted radiation in
the desired wavelength band, the illumination provided by the hotplate is not very
intensity because it is undirected. The source itself is very cumbersome to use even on a
laboratory bench.
Most heated sources used for infrared measurements operate at significantly
higher temperatures to provide higher emittance and permit the use of physically smaller
sources. The IR-18 lamp has an emission profile similar to that of a blackbody at 1000 K
when run under the conditions of this test. This source is of much lower total power than
the hotplate, but because it is physically small, a small parabolic reflector can be used to
direct a greater portion of their emission toward the intended target. Unfortunately, most
of that increased blackbody emission is outside the wavelength region observed by
long-wave thermal imaging cameras: a 1000 K blackbody source emits 5.6 W/cm2, 16X
greater than a 500 K source, but with only 11% of its optical power in the 8-14 µm band.
Blackbody radiators have profiles given by Planck‟s radiation law. A real
which provides an opportunity to tailor the light emission characteristics of lamps.
Alumina (a common form of aluminum oxide) is nominally transparent from the UV
spectral window to about 5 µm wavelength. Kirchoff‟s radiation law reveals that
materials with very low absorptivities at any given wavelength should have
correspondingly low emissivities at that wavelength, and we therefore expect that a
heated alumina-based lamp should have reduced optical emission at wavelengths shorter
than 5 µm. This is demonstrated in Figure 2.3 for the alumina lamp. A maximum in the
emission of this lamp near 5.65 µm is observed, with a secondary maximum near 2-2.5
µm. We interpret these maxima as characteristic of the heated alumina (the 5.65 µm
maximum) with residual emission directly from the nichrome filament itself (the 2 µm
maximum). Tests performed on an uncoated nichrome-wound-alumina lamp (not shown)
showed that the alumina coating was important to establishing a good thermal contact
between the filament material and the screw, without which the nichrome filament itself
dominated the emission.
Electrical energy input to a lamp is dissipated by three distinct mechanisms under
steady state conditions for the purposes of evaluating these two lamps. First, the lamp
dissipates energy by heating the immediate surroundings via thermal conduction and
convection. The lamp also dissipates energy by the emission of electromagnetic
radiation, which we can conveniently divide into “in band” and “out of band” emission as
our second and third mechanisms, respectively. For a blackbody radiator near 1000 K,
about 63% of all radiation is at wavelengths shorter than 5 µm. Because of the steady
state energy balance required between the input power and the power dissipated by the
the environment is not significantly increased, the same filament temperature can be
reached with less electrical heating to make the lamp more electrically efficient. By this
logic, the alumina lamp should be more efficient than a blackbody lamp of approximately
the same temperature for our purpose.
This is demonstrated in Figure 2.4, where we report benchmark modulation
values for the hotplate, IR-18 and alumina lamp. The IR-18 and alumina lamps were
operated at a range of powers shown on the bottom axis of the graph. Arrows mark the
rated power of the IR-18 and the power setting at which we operate the alumina lamp.
The left axis shows a measure of relative power in the band seen by one particular FLIR
microbolometer-based model A315 camera (every camera is expected to vary slightly
because of antireflection coating variability). The hotplate benchmark value of 1.04 units
of modulation per watt of power is given as a dashed line on the figure; because it is
operated at 1000W, the hotplate gave a modulation average of 1040 units in the signal of
Figure 2.4 Benchmark test of the irradiance of three infrared sources as modulation in units of the 16-bit A/D signal of a FLIR Systems A315 thermal infrared camera per unit power supplied to the source. The black dashed line at the bottom shows the benchmark behavior of the hotplate used in Reference 1. The upper curve through circles is the test result for the alumina lamp described here; the middle curve through triangles is the test result for the IR-18 lamp for comparison. Arrows indicate the nominal rated power for the commercial lamp, and the 1000+ hour lifetime tested power of the homemade alumina lamp. Both of these higher temperature sources use the same parabolic reflector element while the hotplate has none, which is the main reason the hotter sources with higher out-of-band emission provide a higher modulation per watt in the 8-14 µm range than the hotplate.
The benchmark values for the IR-18 are much higher because of its parabolic
mirror. At its rated power, a single IR-18 lamp produced 91.8 units of modulation.
Eleven IR-18 lamps consuming 198 W would be required to provide an illumination
The alumina lamp operating at 30 W produced 218 units of modulation. Five
alumina lamps using 150 W would therefore produce a slightly greater irradiance than the
1000 W hotplate.
The results in Figures 2.3 and 2.4 appear slightly inconsistent: the power outside
the 8-14 µm wavelength range appears considerably smaller for the alumina lamp than
for the IR-18 in Figure 2.3, and one might expect an even higher efficiency for the
alumina lamp in Figure 2.4. Results for another study (not described here) in which all
the light emitted from both lamps was captured in an integrating sphere also suggests that
the alumina lamp should have an output that is approximately a factor of two greater than
the IR-18 in the thermal wavelength window. However, as Figure 2.1 shows, the source
of the IR-18 is significantly smaller than that of the alumina lamp so that it can be more
tightly collimated by the parabolic mirror. Thus, while the total output of the alumina
lamp is about twice that of the IR-18 in the thermal wavelength region per unit of power
supplied, the peak irradiance is only about 1.5 times greater because the irradiance is
more diffuse. Still, this is an advantage in reflectance imaging because illumination by
the alumina lamp is more even, with less intense hot spots, than the IR-18 provides.
2.5 CONCLUSION
We report the construction and performance of a small thermal infrared light
source that takes advantage of Kirchhoff‟s law relating absorptivity and emissivity to
increase the emission and irradiance properties of the lamp in the 8-14 µm wavelength
BIBLIOGRAPHY
1. Herschel, W. Experiments on the Refrangibility of the Invisible Rays of the Sun.
Royal Society of London. 1800, 90, 284-292.
2. Leslie, J. An experimental Inquiry into the Nature and Propagation of Heat; Bell and Bradfute: Edinburgh, 1804.
3. Olson, R.G. A note on Leslie‟s cube in the study of radiant heat. Annals of Science.
1969, 25, 203-208.
4. Melloni, M. Annal. Chim. Phys.1835, 55, 337.
5. Bunsen, R.; Roscoe, H.E. Photochemische Untersuchungen. Poggendorff’s Ann.
Chem. Phys.1957, 100, 43-88.
6. Lockemann, G. The Centenary of the Bunsen Burner. Journal of Chemical Education. 1956, 33, 20-22.
7. Kirchhoff, G.; Bunsen, R. Poggendorff’s Ann. Phys. Chem. 1860,110, 161.
8. Wolfe, W.L. Handbook of Military Infrared Technology; Government Printing Office: Washington, DC, 1965; pp 31-56.
9. Pfund, A.H. The Electric Welsbach Lamp. Journal of Optical Spectroscopy of America. 1936, 26, 439-442.
10.Barnes, R.B.; Bonner, L.G.A Survey of Infra-Red Spectroscopy. Journal of Chemical Education. 1937, 14, 564-571.
11.Nernst, W.; Bose, B. The theory of Auer Light. Physics Zeits, 1900, 1, 289-291.
12.Coblentz, W.W. Investigations into Infrared Spectra Part VII. Carnegie Institution of Washington: Washington, DC, 1905.
13.Registration number 0200201 to the Wireless Resistor Company of America, now registered to Sandvik Wire and Heating Technology Corporation.
15.Cann, M.W.P. Light Sources in the 0.15-20-µ Spectral Range. Applied Optics. 1969,
1645-1661.
16.McCluney, R. Introduction to Radiometry and Photometry; Artech House: Boston, MA; 1994; pp. 79.
17.Brooke, H.; Baranowski, M.R.; McCutcheon, J.N.; Morgan, S.L.; Myrick, M.L. Multimode Imaging in the Thermal Infrared for Chemical Contrast Enhancement. Part 1: Methodology. Anal Chem.2010, 82, 8412-8420.
18.Brooke, H.; Baranowski, M.R.; McCutcheon, J.N.; Morgan, S.L.; Myrick, M.L. Multimode Imaging in the Thermal Infrared for Chemical Contrast Enhancement. Part 2: Simulation Driven Design. Anal. Chem.2010, 82, 8421-8426.
19.Brooke, H.; Baranowski, M.R.; McCutcheon, J.N.; Morgan, S.L.; Myrick, M.L. Multimode Imaging in the Thermal Infrared for Chemical Contrast Enhancement. Part 3: Visualizing Blood on Fabrics. Anal. Chem. 2010, 82, 8427-8431.
20.Koerperick, E.J.; Norton, D.T.; Olesberg, J.T.; Olson, B.V.; Prineas, J.P.; Boggess. T.F. Cascaded Superlattice InAs/GaSb Light-Emitting Diodes for Operation in the Long-Wave Infrared. IEEE Journal of Quantum Electronics. 2011, 47, 50-54.
21.Das, N.C. Performance Comparison of Top- and Bottom-emitting Long Wave Infrared Light Emitting Diode Devices. Journal of Electronic Materials. 2009, 38, 2329-2334.
22.Das, N.C.; Bradshaw, J.; Towner, F.; Leavitt, R. Long-wave (10 µm) infrared light emitting diode device performance. Solid-State Electronics. 2008, 52, 1821-1824.
23.Giraud, S.O.C.; Hasko, D.G. Mesoscale thermal infrared sources. Microelectronic Engineering. 1998, 41-42, 579-582.
24.Bauer, D.; Heeger, M.; Gebhard, M.; Benecke, W. Design and fabrication of a thermal infrared emitter. Sensors and Actuators A. 1996, 55, 57-63.
25.Laine, D.C.; Al-Jourani, M.M.; Carpenter, S.; Sedgbeer, M. Pulsed wideband IR thermal source. IEE Proceedings-Optoelectronics. 1997, 144, 315-322.
2013, 17, 141-153.
27.Yue, F.; Tomm, J.W.; Kruschke, D.; Glas, P.; Bzheumikhov, K.A.; Margushev, Z.C. PbS:Glass as broad-bandwith near-infrared light source. Optics Express. 2013, 21, 2287-2295.
28.Tu, J.; Howard, D.; Collins, S.D.; Smith, R.L. Micromachined, silicon filament light source for spectrometric microsystems. Applied Optics. 2003, 42, 2388-2397..
29.Inoue, T.; Asano, T.; Zoysa, M.D.; Oskooi, A.; Noda, S. Design of single-mode narrow-bandwidth thermal emitters for enhanced infrared light sources. Applied Physics Letters. 2013, 30, 165-172.
30.Tsai, M.W.; Chuang, T.H.; Meng, C.Y.; Chang, Y.T.; Lee, S.C. High Performance Midinfrared narrow-band plasmonic thermal emitter. Applied Physics Letters. 2006,
89, 1731161-1731163.
31.Capasso, F. High-performance midinfrared quantum cascade lasers. Optical Engineering. 2010, 49, 111102-1111029.
32.Troccoli, M.; Wang, X.; Fan, J. Quantum cascade lasers: high-power emission and single-mode operation in the long-wave infrared (λ>6 µm). Optical Engineering.
CHAPTER
3
T
HERMALI
NFRAREDC
AMERAC
ALIBRATION 3.1 BACKGROUNDWhenever using an instrument to detect specific features of a measurement, the
calibration and efficiency of the detector needs to be evaluated so further improvements
can be implemented on the instrument. While there are many different types of detectors
and different methods of calibration for each scenario, calibrating an infrared (IR) camera
presents a unique challenge because IR cameras uses a focal plane array of individual
detectors. Each detector, or pixel, outputs a single number that is summation of total
signal: the signal is a description of all detectable wavelengths. Today, IR cameras are
manufactured in large quantities and used in commercial, military, medical, and research
environments (1-8).
Methods have been reported to calibrate infrared cameras for their temperature
response since an IR camera‟s primary function is to identify temperature differences (9,
10). Calibration for a spectral response has been accomplished in a few scientific
scenarios. A spectrally calibrated infrared camera was set on the side of a rocket to
monitor the temperature of debris (11). The details of the method they used to determine
a spectral response of the camera were not fully explained. Other methods have been
used to spectrally calibrate the camera but would not be ideal for our situation because
(12, 13). However, these techniques do offer suggestions and valuable information about
IR camera systems.
Since the IR camera (FLIR A315) used in the instrument that is being developed
in our laboratory did not include a spectral response calibration profile, the camera‟s
spectral response was investigated and reported with the procedure listed below. The
camera‟s stated wavelength response range is 7.5 to 13 µm. With this technique, the
determined spectral response curve shows the camera begins to respond at 8 µm, and the
response peaks at 9.6 µm; at longer wavelengths, the response decays at a relatively
constant rate. This information will allow future development of a filter system that will
aid in identifying latent stains: this will not be discussed here.
3.2 EXPERIMENTAL
The FLIR A315 thermal infrared camera was spectrally calibrated; it uses a
320x240 uncooled microbolometer focal plane array (14). It has a Germanium lens with
an anti-reflective coating, which allows more light to be transmitted due. A Ge lens
would reflect more light because of its large refractive index (RI); since the
anti-reflective coating has an RI between air and germanium, this allows less light to be
reflected at each interface than an air/germanium interface. The camera was operated
using in-house software written in LabVIEW 2012 (National Instruments, Austin TX). In
order to have the largest number of pixels illuminated by the infrared light, the camera‟s
zoom was set to the minimum value. The temperature sensitivity range was set to -20 to
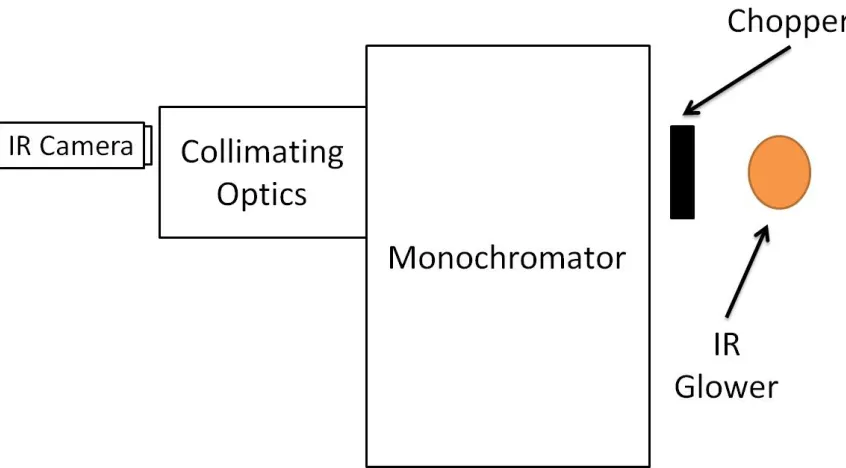
Figure 3.1 The IR camera is placed at the exit of the collimating optics. The collimating optics were not used with the standard detector. The IR glower remained in the same position during the measurement of the standard detector, but the chopper was removed.
To isolate specific wavelengths of light, a monochromator (MC), Optronic
Laboratories Inc. 750-M-S, was used; 5 mm circular entrance and exit apertures were
used. The LG 100-75 and LG 225-40 (both from Optronic Laboratories, Inc.) gratings
were used within the MC. The IR/Visible Dual Light source attachment (Optronic
Laboratories Inc., Model: 740-20D/IR) was used as the light source; the IR Glower was
operated at 48 W. The standard detector used was a pyroelectric detector (Optronic
Laboratories Inc., Model: OL 750-HSD-380). Collimating optics (Optronic Laboratories
Inc., Model 750-10C) were used while the camera was being used as a detector. A
chopper, which operates at 1 Hz and was made in-house for this experiment, was placed
between the light source and the MC‟s entrance; the chopper was controlled by the
LabVIEW program that was used to interface with the IR camera. Figure 3.1 shows the
current (AC) was calculated at each wavelength using a separate LabVIEW program; AC
image processing was explained and applied by Brook et. al. (15-17). The AC image was
calculated to remove the background from the images. Once the AC images were
calculated, they were processed using a custom Matlab that established the response
number of the camera.
To measure the response of the camera from the AC images, two 70x80 pixel
areas of the image were designated as the background, and an 85x80 pixel region was
used as the signal area. The average pixel value was calculated for each region; the
average of two background areas was subtracted from the average pixel value of the
signal area. AC images were calculated from 7000 nm to 18000 nm with measurements
every 100 nm. Figure 3.2 displays an image when the camera is not detecting radiation
and an AC image when radiation is detected.
Once the signal was calculated a specific wavelength, the signal were ratioed to
the response curve of the pyroelectric detector; this process compensated difference
intensities of the light source at different wavelengths.
response to the different wavelength of light. Image B shows a high response to the radiation at that wavelength: so high that the background is blacked out.
3.3 RESULTS & DISCUSSION
Figure 3.3 is the response curve for the IR camera. The camera did not observe
any radiation below 7.7 µm; this is different than rated by the manufacturer. The peak
sensitivity of the camera is at 9.6 µm. The IR camera begins to respond beyond 7.8 µm.
The response trickles to 50% at 13.6 µm, which is the cutoff wavelength listed by the
manufacture in reference 14.
The two gratings used had an overlapping region from 13.0 µm to 14.5 µm.
Within this region, the two gratings had a similar trend in response but the values for the
LG 100-75 (used for the wavelength region 7.0 to 14.5 µm) were at a slightly lower
value. To compensate for the difference in value, the ratio of LG 225-40 (used for
wavelengths beyond 13.0 µm) response to the LG 100-75 was calculated for wavelengths
between 13.0 and 14.5. The correction factor was applied to all response values for the
Figure 3.3 This is the response, or sensitivity, curve for the FLIR A315. From 7.0 to 14.0 µm, the LG 100-75 was used; beyond 14.0 µm, the LG-225-40 was used. This changing point was set by the MC‟s software and the manufacturer. The final response values were ratio to the maximum value so that the wavelength with the highest response would be equal to 1.
3.4 CONCLUSION
The response curve was calculated with the following procedure. This response
range was different than the stated response range because wavelengths below 8 µm do
not generate a response. This method could be adapted to be used with other cameras to
determine the differences in spectral sensitivity.
B
IBLIOGRAPHY1. Rogalski, A. History of infrared detectors. Opto-Electronics Review. 2012, 20(3), 279-308.
2. Kateb, B.; Yamamoto, V.; Yu, C; Grundfest, W.; Gruen, J.P. Infrared Thermal Imaging: a review of the literature and case report. NeuroImage. 2009, 47, T154-T162.
3. Bagavathiappan, S.; Lahiri, B.B.; Saravanan, T.; Philip, J.; Jayakumar, T. Infrared Thermography for condition monitoring – A review. Infrared Physics &
Technology. 2013, 60, 35-55.
4. Verhoeven, G. Imaging the invisible using modified digital cameras for
straightforward and low-cost archaeological near-infrared photography. Journal of Archaeological Science. 2008, 35, 3087-3100.
5. Peng, D.; Jones, R. Lock-in thermographic inspection of squats on rail steel head.
Infrared Physics & Technology. 2013, 57, 89-95.
221-235.
7. Deans, J.; Gerhard, J.; Carter, L.J. Analysis of a thermal imaging method for landmine detection, using infrared heating of the sand surface. Infrared Physics & Technology. 2006, 48, 202-216.
8. Safitri, A.; Mannan, M.S. Methane Gas visualization Using Infrared Imaging System and Evaluation of Temperature Dependence of Methane Gas Emissivity.
Industrial & Engineering Chemistry Research. 2010, 49(8), 3926-3935.
9. Horny, N. FPA camera standardization. Infrared Physics & Technology. 2003, 44, 109-119.
10.Bower, S.M.; Kou, J.; Saylor, J.R. A method for the temperature calibration of an infrared camera using water as a radiative source. Review of Scientific
Instruments. 2009, 80(9), 1-7.
11.Gauthier Jr., L.R.; Howser, L.M.; Prendergast, D.T.; Mattix, M.P. Radiometric dynamic scene processing for uncooled IRFPAs. In SPIE Proceedings 1996, Proceedings of the Infrared Imaging Systems: Design, Analysis, Modeling, and Testing XVII, Orlando, FL, April 17, 2006.
12.Mermelstein, M.D.; Snail, K.A.; Priest, R.G. Spectral and radiometric calibration of midwave and longwave infrared cameras. Optical Engineering. 2000, 39, 347-352.
13.Rice, J.P.; Lykke, K.R.; Yoon, H.W. A method for testing the spectral
responsivity of infrared cameras using tunable lasers. Proc. SPIE 5076, Infrared Imaging Systems: Design, Analysis, Modeling, and Testing XIV, 112 (August 25, 2003); doi:10.1117/12.487113.
14.FLIR A315 / A615 Thermal Camera Technical Specifications – FLIR. http://www.flir.com/cs/emea/en/view/?id=41955 (accessed June 27, 2013).
15.Brooke, H.; Baranowski, M.R.; McCutcheon, J.N.; Morgan, S.L.; Myrick, M.L. Multimode Imaging in the Thermal Infrared for Chemical Contrast Enhancement. Part 1: Methodology. Anal Chem.2010, 82, 8412-8420.
Part 2: Simulation Driven Design. Anal. Chem.2010, 82, 8421-8426.
C
HAPTER4
L
ATENTH
EATT
HERMOGRAPHY 4.1 INTRODUCTIONOur laboratory has made advances in alternative imaging methods using an
infrared camera to identify blood on fabrics (1-3). In the process, it was noticed that
fabrics experienced variation in their masses because of humidity changes in the
surrounding environment; this has been observed in other laboratories (4, 5).
An abundance of research has been done in different areas which encompass one
or more elements of our experimental technique that we discuss. Many different
techniques have been publish to study moisture content in a broad range of fabrics; these
studies focus on analyzing how moisture content contributes to comfort level, water
mechanics within fibers, and manufacturer properties (6-11). It has also been reported
that the heat of adsorption of water is higher than expected when water is adsorbed to a
sulfonic or an amino group (12). Vainer used a short wave IR camera (3-5 µm
wavelength region) to identify what he described as “thermal fire”: this was the process
of dipping a strip of fabric into room temperature water (16-18 °C) and the wicking
action caused temperature rise higher than expected (13). Most notably, he reported
flannel and poplin cotton experiencing an 8°C temperature rise. In another experiment, he
showed that water vapor yielded a thermal response by placing a piece of fabric above a
dish filled with room temperature water. Loskyll used a shortwave infrared camera to
time (14). The difference in temperatures is attributed to the heat of adsorption and the
heat of reaction.
With these concepts, we carried out our experiment by exposing bloodstained
fabrics to steam. The results were quite unexpected because this provided a contrasting
technique. We have explored this technique by applying algorithms to aid in identifying
regions of interests; however, calculating the range of each pixel in time offers spatial
information and provides an image that allows for areas of interest to be identified. In this
chapter, example results for two fabrics with bloodstains are shown: an acrylic fabric and
a polyester fabric.
4.2 EXPERIMENTAL
A Rowenta Portable Handheld Garment Steamer was used for all the experiments.
It has an 800W heater to generate steam. Deionized water and NMR grade deuterium
oxide (Cambridge Isotope Laboratories, Inc.) were used as sources for steam. The
steamer converts water to steam at a rate of 0.16 mL of per second; this was determined
experimentally by measuring the amount of water used over a period of constant
operation. It is important to note that the steam is not at a high temperature to harm the
sample: the author of the paper has exposed their hand to the steam only inches from the
exit port without harm. To monitor the sample, the FLIR A315 Thermal Infrared camera
was used. The camera records 16-bit data at 60 frames per second. The camera uses an
uncooled microbolometer detector that is sensitive to the 8-14 μm wavelength region.
In-house software, which was developed using LabVIEW© (National Instruments, Austin
TX), was used to control the camera and record data. All measurements were done in a
Two fabric samples were prepared using rat blood from the University Of South
Carolina School Of Medicine‟s Animal Research Facility. The first sample is a triple
dyed acrylic fabric that has 5 different dilutions of rat blood on the sample: „I‟ represents
neat blood, „X‟ represents 10x dilute blood, „V‟ represents 25X dilute blood, „L‟
represents 50x dilute blood, and the „C‟ represents 100x dilute blood. This sample fabric
was prepared 3 years for previous experiments. The other sample is a polyester fabric
with a pattern pressed onto the fabric; the fabric had two stains deposited on the surface.
This type of polyester felt silky to the touch; it was not the fuzzy type of polyester
material. A researcher wore a disposable nitrile glove and dipped their hand in diluted rat
blood then placed their hand on the fabric. The left handprint represents blood of 100x
dilute and the right represents 1000x dilute blood. At the time of steaming, the polyester‟s
bloodstains were 4 months old. After the blood dried, the hand prints are not visible to the
human eye. Both of these fabrics are show in Figure 4.1.
A fabric sample is positioned vertically; it supported by a steel backdrop. The
infrared camera is 30-inches away from the surface. The handheld steamer, which never
enters the camera‟s field of view, steams from 8-inches away from above the surface. A
Figure 4.1 Image A shows the acrylic fabric with a 12-inch ruler. One can observe the „I‟, the „X‟, and the „V‟, but the other two bloodstains are not visible. Image B show the polyester fabric with the sewn-in skull prints. The bloodstains are not visible even with close examination. The skull pattern is the type that is iron onto the fabric during production.
4.3 RESULTS & DISCUSSION
Blood is composed of two primary categories: 55% plasma and 45% cellular
components (15). The plasma is 90% water, which contains an assortment of dissolved
salts. The remaining portion of plasma is composed of plasma proteins and substances
that are transported in blood, such as nutrients and hormones. The cellular component is
primarily erythrocytes, or more commonly known as red blood cells. Erythrocytes are
primarily composed of hemoglobin, an iron containing protein that transports oxygen.
Rat blood is used in these experiments; the solids content of rat blood has been reported
to be roughly 20% by weight (16). There are a few main heating processes that can
happen when steam is exposed to fabric. An enthalpy of water adsorption can be
observed; these values have been studied in specific situations and differ in magnitude
between types of proteins (17). The bloodstains change the number of adsorption sites
two factors are exploited when steam is applied. The fabric‟s temperature will be
increased by the hot vapor being exposed to the surface.
Figure 4.2 is nine images that depict the process of exposing the fabric to hot
water vapor. Deuterated water was used in this experiment. Frame 1 and 300 shows a
traditional passive thermographic image. The bloodstains that are visible with the human
eye are observed in these images. The vapor exposure begins a few of frames before
frame 600. The bottom portion of the „X‟ stain has a higher intensity than the
surrounding areas when the steam comes into contact with fabric‟s surface. This is not
showing that the technique is sensitive to only blood; rather, it is sensitive to identifying
differences in hydrophobic properties on the surface. In an experiment not shown,
vacuum grease was applied to the same type of acrylic fabric. When exposed to the
steam, the greased area did not show a response and stayed at a lower temperature than
surrounding areas. In frame 900, the entire viewing region has been exposed to some
amount of steam (not evenly distributed), and the latent stains are visible. There are other
noticeable attributes about frame 900: drips of blood in random places (these were
accidently dripped during the original staining), the „V‟ stain has wicked out into the
fabric area, and „L‟ stain is visible in the images even though the surrounding area is dark
even though it was not the focus during the experiment. Between frame 1200 and 1500,
the steaming process ceases. In the „X‟, the „V‟, and the „C‟, the inner part of the letters
cools faster than outer edges that is observed in frame 1800, 2100, and 2400. In frame
2400, the ability to specifically identify areas that have latent stains is difficult because of
surface re-equilibrates to its original condition. The magnitude of temperature increases is
around 12-16 °C above room temperature.
Figure 4.2 The 9 images are thermographic images taken from the FLIR A315. The red number corresponds to the frame number. The vertical lines that are observed in frame 900 and beyond are creases in the fabric. About 30 seconds after frame 2400, the fabric returns to its original condition.
Figure 4.3 shows pixel data from a small area on the fabric. Three pixels were
selected: a pixel from the bottom-right portion of the „X‟, a pixel between the bottom
right of the „X‟ and the top right of the „C‟, and a pixel from the top right portion of the
„C‟. These pixels were chosen because of their close proximity to each other. Even
though there is a factor of 10 between the two dilutions of blood, the difference in signal
is not significant. The bloodstained areas remain at a higher temperature while the neat
Figure 4.3 Pixel data from steaming the acrylic fabric. The pink line, listed as the background, represents the neat acrylic fabric. The red and blue lines represent the „C‟ and the „X‟, respectively. Notice how the fabric experiences the same oscillation as the bloodstains yet the magnitude is difference. It also appears that the bloodstained areas have a higher slope than the fabric.
The polyester fabric yielded different observations than the acrylic fabric. Figure
4.4 shows six images from the steaming process. Deionized water was used in this
experiment. Frame 1 shows the typical thermographic image before steaming. Since the
fabric‟s surface is at the same temperature, the IR camera does not show the skull print
on the fabric. There are a number of creases are noticeable in the fabric; particularly,
there is a horizontal crease across the upper portion of the fabric that is noticeable in
frame 200. The steamer is expelling hot water vapor directly above the fabric at roughly
8-inches away. An outline of a palm is discernible; however, the large horizontal crease is
blocking a large portion of the steam from the bottom portion of the fabric in that frame.
Between frame 200 and 400, which is about 3 seconds in time, two hand prints are easily
side of the image) is fully visible. The 100x dilute handprint, which is not completely
shown in the camera‟s field of view, is also visible: only the hand index finger and the
thumb are visible in the IR images. In frame 600, the hand prints are not visible because
the response of the fabric is similar to the response of the bloodstained areas. Steam is
still being exposed to the sample until frame 630. In frame 800, portions of the
bloodstained area show a cooler signal but only above the crease that was previously
mentioned. The other areas exhibit a cooler signal in later frames. This is the opposite
than the acrylic fabric: the bloodstains retained a higher temperature than the rest of the
fabric, which is observed in „V‟ stain. There are areas of exception, such as the inner
portion of the „X‟. With the polyester fabric, the bloodstains cool faster than areas
without blood on the surface. Figure 4.5 shows pixel data from the fabric.
Figure 4.5 Pixel data from neat and bloodstained polyester fabric areas. These pixels were separated spatially by 1 cm.The bloodstained area shows a higher response to the steam initially, but the difference in response between the neat and bloodstained areas becomes less over time. At the end of the process, the bloodstained fabric cools to a lower temperature faster than neat the neat area as observed in Figure 4.4. This would lead to the following hypothesis: there is a small difference in the enthalpy of adsorption between blood proteins on polyester fabrics and neat polyester fabric, the blood on the surface of the fabric does not sign.
One of the main challenges with this technique is identifying a processing method
that identifies areas of interest for further investigation. Most researchers do not have to
time to sift through multiple thermographic movies trying to observe minor details. There
have been multiple attempts at applying different data processing techniques to aid in
identifying these areas of interests in the thermographic movies. Derivative processing
(first and second derivatives by spatial and time domain), background subtraction,
Savitzky Golay smoothing, image convolution using different kernels, and others
techniques have been attempted. The problem that arises is that each measurement and
sample is different from the previous. Applying a technique in a specific sample allows
the experimenter to identify the specific areas of interests: the same data processing
The method, so far, that yields the best results for the majority of the steaming
experiments is calculating the range of each pixel in time. This simple statistic allows for
visualization of intensity differences across the entire image while spatial information is
also displayed. This method was applied to the acrylic fabric and polyester fabric
samples. The results of calculating the range can be seen in Figure 4.6.
Figure 4.6 Here are range calculations for both measurements shown here. This can also be used to identify which area(s) was exposed to majority of the hot water vapor. Image A has a clear outline of each bloodstain that was deposited on the fabric. Image B shows the 1000x diluted bloodstain and the portion of the 100x stain that was within the camera‟s field of view.
4.4 CONCLUSION
In this process, we have identified a method to identify latent stains on fabrics
without contaminating, manipulating, or damaging the sample. This process is simple in
application yet complex because the number of different mechanisms controlling the
response generated by water vapor exposure. While the latent heat thermography is not
very selective, advances in IR camera technology make this technique very sensitive:
small differences in temperature changes can be observed. Data processing techniques
have been explored; however, most of these techniques have problems when applied to
and develop specific applications for this technique in industrial and forensic
applications.
B
IBLIOGRAPHY1. Brooke, H.; Baranowski, M.R.; McCutcheon, J.N.; Morgan, S.L.; Myrick, M.L. Multimode Imaging in the Thermal Infrared for Chemical Contrast Enhancement. Part 1: Methodology. Analytical Chemistry. 2010, 82, 8412-8420.
2. Brooke, H.; Baranowski, M.R.; McCutcheon, J.N.; Morgan, S.L.; Myrick, M.L. Multimode Imaging in the Thermal Infrared for Chemical Contrast Enhancement. Part 2: Simulation Driven Design. Analytical Chemistry. 2010, 82, 8421-8426.
3. Brooke, H.; Baranowski, M.R.; McCutcheon, J.N.; Morgan, S.L.; Myrick, M.L. Multimode Imaging in the Thermal Infrared for Chemical Contrast Enhancement. Part 3: Visualizing Blood on Fabrics. Analytical Chemistry. 2010, 82, 8427-8431.
4. Fuzek, J.F. Absorption and Desorption of Water by some Common Fibers.
Industrial & Engineering Chemistry Product Research Development. 1985, 24, 140-144.
5. Gibson, P.; Rivin, D.; Kendrick, C.; Schreuder-Gibson, H. Humidity-Dependent Air Permeability of Textile Materials. Textile Research Journal. 1999, 69, 311-317.
6. Hill, C.A.S.; Norton, A.; Newman, G. The Water Vapor Sorption Behavior of Natural Fibers. Journal of Applied Polymer Science. Sci. 2009, 112, 1524-1537.
7. Fohr, J.P.; Couton, D.; Treguier, G. Dynamic Heat and Water Transfer Through Layered Fabrics. Textile Research Journal. 2002, 72, 1-12.
8. Fan, J.; Cheng, X.Y. Heat and Moisture Transfer with Sorption and Phase Change through Clothing Assemblies: Part I: Experimental Investigations. Textile Research Journal. 2005, 75, 99-105.
9. Fan, J.; Cheng, X.Y. Heat and Moisture Transfer with Sorption and Phase Change through Clothing Assemblies: Part II: Theoretical Modeling, Simulation, and
Comparison with Experimental Results. Textile Research Journal. 2005, 75, 187-196.
11.Le, C.V.; Ly, N.G. Multilayer Adsorption of Moisture in Wool and Its Application in Fabric Steaming. Textile Research Journal. 1992, 62, 648-656.
12.Akiyama, G.; Matsuda, R.; Sato, H.; Hori, A.; Takata, A. Effect of functional groups in MIL-101 on water sorption behavior. Microporous and Mesoporous Materials. 2012, 157, 89-93.
13.Vainer, B.G. Focal plane array based infrared thermography in fine physical experiment. Journal of Physics D: Applied Physics. 2008, 41, 1-12.
14.Loskyll, J.; Stoewe, K.; Maier, W.F. Infrared thermography as a High-Throughput Tool in Catalysis Research. ACS Combinatorial Science. 2012, 14, 295-303.
15.Campbell, N.; Reece, J.; Urry, L.; Cain, M.; Wasserman, S.; Minosky, P.; Jackson, R. Biology, 8th ed.; Pearson: San Francisco, CA, 2008; pp. 911-915.
16.Donaldson, H.H. The Rat: Reference Tables and Data. Philadelphia, PA., 1915.