Experimental Investigation and Analysis of
Process Parameters for Laser Cutting Process
V.Senthilkumar1, P.Pon Karthick Raja2, R.Pravin Raj3, S.Raja Periyasamy4, S.Sakthidharan5
Assistant Professor, Department of Mechanical Engineering, TRP Engineering College, Tiruchirapalli, India1
UG Scholars, Department of Mechanical Engineering, TRP Engineering College, Tiruchirapalli, India 2,3,4,5
ABSTRACT: Laser cutting is a popular manufacturing process utilized to cut various types of materials more economically with good surface finish. Stainless steel is difficult to cut using laser with high speed rate ,due to back reflection in these materials. The width of laser kerf and quality of the cut edges are affected by laser power, cutting speed, assist gas pressure and stand-off distance. The experiment was designed and carried out on the basis of standard L16 Taguchi’s orthogonal array in which the four laser cutting parameters were arranged at three levels. The result shows that Kerf width (Kw) decreases with increase in power and stand-off distance and with decrease in assist gas pressure.Hardness value decreases due to machining.The width of laser cut or kerf, quality of the cut edges are affected by laser power, cutting speed, assist gas pressure, and stand-off distance between nozzle and the work piece material. From the analysis of mean values of variance, the significant laser cutting parameters were identified.
KEYWORDS: CO2 laser, CNC Machining ,Rockwell machining, Tool makers Microscope.
I. INTRODUCTION
Lasers that are capable of producing high power laser beams of high beam quality are suitable for cutting applications. The CO2 and Nd: YAG lasers are the two laser technologies have for long been the workhorses for high
power applications such as cutting. The CO2 laser has gained considerable acceptance as a cutting tool because a very
high power density can be achieved with such a laser and CO2 lasers are available in high power levels. The CO2 laser
and Nd:YAG laser with output power capabilities of upto 8,000 W and 4,500 W respectively are now available for cutting applications. The CO2 lasers with even higher output powers and precision cutting can be made.
II. LITERATURE REVIEW
Patel [2012], focus mainly on cut quality and the cut quality mainly decided by surface roughness, kerf width, and perpendicularity. The experiment was carried out on 5mm thickness M.S. plate by varying the parameter like; laser power, gas-pressure, and cutting speed. The factorial design was used for design of experiment and for find out the percentage contribution of process parameter used Minitab 15 software. Surface roughness was measured by Surface roughness tester SJ-201 and kerf width was measured by equipment including digital camera and the UTHSCSA image tool version 3.0 program. Prof.E.FallahiSichani .et.al [2012] has examined on plasma formation in CO2 fusion laser cutting of stainless steel by considering the input parameters of Power(4Kw), Thickness(6mm),Cutting Speed(1.26-2.94m/min), Gas pressure (18bar). He found that the output parameters are Kerf Width &HAZ(heat affected zone) which results in increase of cutting speed &heat transfer from melt pool to assist gas. K.A. Ghany& M.
Newishy[2015] predicted that surface roughness value reduces on increasing cutting speed & frequency and decreasing
laser power & gas pressure. Arun Kumar Pandey and Avanish Kumar Dubey studied the effect of laser cutting of Titanium alloy sheet and observed that lower values of pulse frequency, higher values of cutting speed and moderate pressure of gas results in lesser surface roughness. N. Rajaramet. al. in their work concluded that high powers and lower feed rates gave good surface roughness. Dhaval P. Patel and MrugeshB.Khatri identified that kerf width generally increases with increase in assist gas pressure and laser power and decrease in cutting speed. Ghany, K.A. &Newishy observed that increase in the frequency reduces the kerf width.
III. METHODOLOGY
3.1 Design of Experiments:
The Taguchi method has beenused, in which the experiments are performed as per standard Orthogonal Arrays (OA) while the optimum level of input process parameters (control factors) are decided on the basis of a statistical analysis of the experimental results. Based on the review of the literature, the selected parameters to be investigated were four, namely the laser power, the cutting speed, the stand-off distance and the pressure of the assist gas. This led to the use of an L16 orthogonal array. The experimental regions of these parameters were determined after the first experiments had been conducted that would identify the initial process parameters settings for which through cuts could be obtained. The Levels of each parameter are listed below
Table 1 – Levels of parameters
Levels & parameter Level 1 Level 2 Level 3 Level 4
Power 1800 2000 2200 2400
Speed 3500 4000 4500 5000
Pressure 6.5 7 7.5 8.5
Sod 0.7 0.9 1.1 1.3
According to L16, four parameters with three levels are considered. The parameters to be examined and the levels of each parameter are sorted out. The L16 orthogonal array used is presented below.
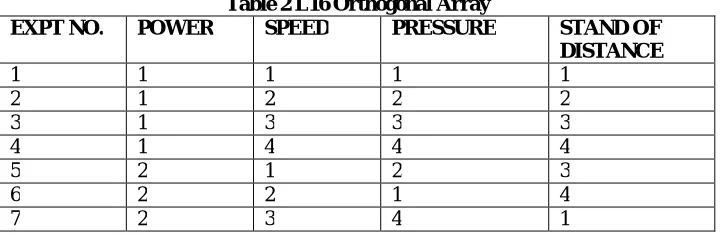
Table 2 L16 Orthogonal Array
EXPT NO. POWER SPEED PRESSURE STAND OF
DISTANCE
1 1 1 1 1
2 1 2 2 2
3 1 3 3 3
4 1 4 4 4
5 2 1 2 3
8 2 4 3 2
9 3 1 3 4
10 3 2 4 3
11 3 3 1 2
12 3 4 2 1
13 4 1 4 2
14 4 2 3 1
15 4 3 2 4
16 4 4 1 3
Machining Operations:
A CO2 laser cutting system was used for the performance of the experiments. The cuts were performed on 3 mm thickness stainless steel plate, with the use of O2, as assist gas and a 5 in. (127 mm) focusing lens.The specimens were made up of a linear cut of 10mmin length for measuring kerf width and with chamfering, square and curvature is done in order to measure the cutting edge hardness .The machine used for this machining was Truflow 4000. A stainless steel plate of 6 feet is cut into 200x200x3mm length work piece by power hacksaw and the corners are filled for better finish. Then the work piece is cleaned and dried.
Fig. 1MATERIAL BEFORE MACHINING Fig. 2 PROFILE TO BE CUT
The input parameters as per the Taguchi orthogonal array in feed into the machine by the CNC input system for each experiment. This process is done for all the 9 experiments and the work pieces are allowed to cool. The controller of the CNC input system is shown in the figure
IV. RESULT AND DISCUSSION
The below response was analysed with the help of above instruments and following the graphs and mathematical equations are obtained.
Table 3 Response Values for the experiment
TIME
KERF
WIDTH MEAN
HARDNESS
2.312 1.035 65.25
5.398 0.86 89.75
3.687 0.405 93.5
4.283 0.305 74.75
2.596 0.435 82
4.95 0.46 71.5
3.605 0.56 84.75
2.544 0.485 82.5
4.409 0.51 59.75
4.545 0.525 72.75
4.816 0.57 92.75
3.501 0.53 81.75
4.908 0.62 86.25
4.318 1.06 68.5
3.908 0.8 60.75
4.498 0.54 63.75
Kerf Width (Kw)
The width of a saw cut, which depends on Several factors: the width of the saw blade; the set of the blade's
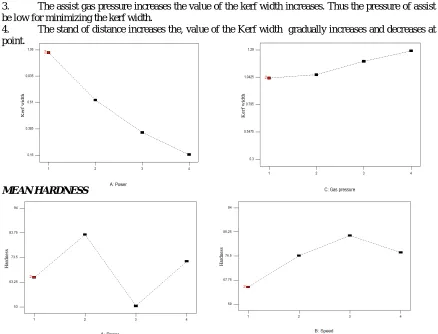
Fig. 4 Kerfwidth vs Parameters
From the above graph of kerf width it is observed that
1. The power increases, the value of the kerf width gradually decreases.
2. The value of the speed increases which results in reduction of kerf width gradually
3. The assist gas pressure increases the value of the kerf width increases. Thus the pressure of assist gas should be low for minimizing the kerf width.
4. The stand of distance increases the, value of the Kerf width gradually increases and decreases at the certain point.
Fig. 5 Mean Hardness vs Parameters
We observed from the graph that,
• Power increases, the value of the surface hardness has both sudden increase and decreases to a certain level of point.
• The value of the speed increases, the value of the surface hardness gradually increases and after a certain point it starts to decrease.
• Gas pressure increases, the value of the surface hardness remains constant for a particular gas pressure and then results in sudden increase and decrease of hardness.
• The value of the Stand of distance increases the value of, the surface hardness suddenly increases and then gradually decreases to a certain level.
MACHINING TIME:
Fig. 6 Machining time vs Parameters
It is shown that from the graph above given are
• Power increases the value of the machining time also gradually increases from point to point to a certain level.
• The value of speed increases, the value of the machining time gradually increase and decreasein nature.
• The value of the gas pressure increases the value of the machining time gradually decreases to a certain level
• The SOD increases the value of the machining time suddenly decreases and then increases to a certain point.
V. CONCLUSION
The experiment presented here is an overview of research work carried out in laser cutting process. From the above discussions it can be concluded that:
Increase in value of power results in gradual decreases in kerfwidth, machining time simultaneouslyincreases for every point and there is a sudden increment and decrement in hardness value.
Machining time and kerfwidth are inversely propotional,since increase in the value of speed decreases theirvalues, and hardness gradually increases and all of sudden decreses.
There is a increment in the value of hardness and kerfwidth, when the value of pressure increases and machining time reduces.At some point hardness remains constant and reduces.
Stand of distance have an similar impact on all kerfwidth, machining time and hardness.Since both increment and decrement happens when SOD increases.
Thus the relationship between the various values of input parameters and their corresponding response is studied for CO2 Laser cutting of stainless steel plate of 3mm thickness. The scope of this project can be increased by
optimizing the value of the input parameters for better quality of cut, in future.
REFERENCES
1. Dhaval P. Patel, Mrugesh B. Khatri, ―Optimization of High Power Co2 Laser Machining Centre‘s Machining Parameters by Experimental Analysis, International Journal of Engineering Research and Applications (IJERA), Vol. 2(Issue 2), 2012, 1190-1196.
2. Ahmet Cekic.et.al(2014)- 25th DAAAM International Symposium on Intelligent Manufacturing and Automation, DAAAM2014Definition of Mathematical Models of High-Alloyed Steel 1.4828 inCO2 Laser Cutting.
3. A.M. Orishich,A.G.Malikov,V.B.Shulyatyev,*, A.A. Golyshev-Experimental comparison of laser cutting of steel with fiber andCO2 lasers on the basis of minimal roughness 8th International Conference on Photonic Technologies LANE 2014
4. Jun Hu, Zhuoxian Zhang, Jingwen Luo, Xiaojun Sheng. ―Simulation and experiment on standoff distance affecting gas flow in laser cutting‖, journal of Applied Mathematical Modeling, Vol 35, 2011, 895–902.
Methodology‖,International Journal of Engineering & Technology, Vol 10(04), 13-21.
6. MilosMadic, MiroslavRadovanovic and LaurentiuSlatineanu, ―SurfaceRoughness Optimization In Co2 Laser Cutting By Using Taguchi Method", U.P.B. Sci. Bull., Vol. 75(Iss. 1), 2013, 97-106.
7. H.A. Eltawahni ,M.Hagino , K.Y.Benyounis , T.Inoue , A.G.Olabi- Effect ofCO2 laser cuttingprocessparametersonedgequalityand operating costofAISI316L
8. Sundar,A.K.Nath, D.K.Bandyopadhyay, S.P.Chaudhuri, P.K.Dey,D.Misra, ―Effect of process parameters on the cutting quality in lasoxcutting of mild steel‖, International Journal of Advanced Manufacturing Technology, Vol. 40, 2009, 865-874.
9. K.A.Ghany, &M.Newishy, ―Cutting of 1.2mm thick austenitic stainless steel sheet using pulsed and CW Nd:YAG laser.‖ Journal of MaterialProcessing Technology, Vol 168, 2005, 438–447.
10. B.S.Yilbas, ―Laser cutting quality assessment and thermal efficiency analysis‖, Journal of Materials Processing Technology, Vol(155-156), 2004, 2106-2115.