University of South Carolina
Scholar Commons
Theses and Dissertations
1-1-2013
Computational Analysis and Prediction of
Genome-Wide Protein Targeting Signals and
Localization
JHIH-RONG LIN
University of South Carolina - Columbia
Follow this and additional works at:https://scholarcommons.sc.edu/etd Part of theComputer Engineering Commons
This Open Access Dissertation is brought to you by Scholar Commons. It has been accepted for inclusion in Theses and Dissertations by an authorized administrator of Scholar Commons. For more information, please [email protected].
Recommended Citation
Computational Analysis and Prediction of Genome-Wide Protein Targeting Signals
and Localization
by
Jhih-Rong Lin
Bachelor of Engineering National Tsing Hua University, 2000
Master of Engineering
National Tsing Hua University, 2003
Master of Science
California State University, East Bay, 2009
————————————————————–
Submitted in Partial Fulfillment of the Requirements
For the Degree of Doctor of Philosophy in
Computer Science and Engineering
College of Engineering and Computing
University of South Carolina
2013
Accepted by:
Jianjun Hu, Major Processor
John Rose, Committee Member
Homayoun Valafar, Committee Member
Jijun Tang, Committee Member
Hongmei Zhang, Committee Member
Abstract
Computational prediction of protein subcellular localization can greatly help to
elu-cidate its functions. Despite the existence of dozens of protein localization prediction
algorithms, the prediction accuracy and coverage are still low. Several ensemble
al-gorithms have been proposed to improve the prediction performance, which usually
include as many as 10 or more individual localization algorithms. However, their
per-formance is still limited by the running complexity and redundancy among individual
prediction algorithms. In the first part of the dissertation, we propose a novel method
for rational design of minimalist ensemble algorithms for practical genome-wide
pro-tein subcellular localization prediction. The algorithm is based on combining a feature
selection based filter and a logistic regression classifier. Using a novel concept of
con-tribution scores, we analyzed issues of algorithm redundancy, consensus mistakes,
and algorithm complementarity in designing ensemble algorithms. We applied the
proposed minimalist logistic regression (LR) ensemble algorithm to two genome-wide
datasets of Yeast and Human and compared its performance with current ensemble
algorithms. Experimental results showed that the minimalist ensemble algorithm
can achieve high prediction accuracy with only 1/3 to 1/2 of individual predictors
of current ensemble algorithms, which greatly reduces computational complexity and
running time. Compared to the best individual predictor, our ensemble algorithm
improved the prediction accuracy from AUC score of 0.558 to 0.707 for the Yeast
dataset and from 0.628 to 0.646 for the Human dataset.
to predict nuclear localization signal (NLS). The major difficulty of NLS prediction
is that NLSs are known to have diverse patterns, but the knowledge to NLS patterns
is limited and only a portion of NLSs can be covered by the known NLS motifs. In
SeqNLS, on the one hand we propose a sequential-pattern approach to effectively
detect potential NLS segments without constrained by the limited knowledge of NLS
patterns. On the other hand, we introduce a model for NLS prediction which
uti-lizes the fact that NLS is one type of linear motifs. Our experiment results show
that our sequential-pattern approach is effectively in extensively searching potential
NLSs. Our method can consistently find over 50% of NLSs with prediction precision
at least 0.7 in the two independent datasets. The performance of our method can out
perform the-state-of-art NLS prediction methods in terms of F1-score.
The binding affinity between a nuclear localization signal (NLS) and its import
recep-tor is closely related to corresponding nuclear import activity. PTM based
modula-tion of the NLS binding affinity to the import receptor is one of the most understood
mechanisms to regulate nuclear import of proteins. However, identification of such
regulation mechanisms is challenging due to the difficulty of assessing the impact of
the PTM on corresponding nuclear import activities. In the third part of the
disserta-tion we proposed NIpredict, an effective algorithm to predict nuclear import activity
given its NLS, in which molecular interaction energy components (MIECs) were used
to characterize the NLS-import receptor interaction, and the support vector
regres-sion machine (SVR) was used to learn the relationship between the characterized
NLS-import receptor interaction and the corresponding nuclear import activity. Our
experiments showed that nuclear import activity change due to NLS change could be
accurately predicted by the NIpredict algorithm. Based on NIpredict, we developed a
systematic framework to identify potential PTM-based nuclear import regulations for
human and yeast nuclear proteins. Application of this approach has uncovered the
Table of Contents
Abstract . . . ii
List of Tables . . . vii
List of Figures . . . viii
Chapter 1 Introduction . . . 1
1.1 Background . . . 1
1.2 Motivation . . . 2
1.3 Contributions and Significance . . . 6
1.4 Organization of the Dissertation . . . 7
Chapter 2 Minimalist Ensemble Algorithms for Genome-wide Protein Local-ization Prediction . . . 9
2.1 Background . . . 9
2.2 Methods . . . 10
2.3 Results and Discussion . . . 17
2.4 Conclusions . . . 31
Chapter 3 SeqNLS: Nuclear localization signal prediction based on frequent pattern mining and linear motif attributes . . . 33
3.1 Background . . . 33
3.2 Materials and Methods . . . 36
3.3 Results and Discussion . . . 47
Chapter 4 Computational identification of post-translational modification (PTM) based nuclear import regulations by characterizing nuclear
localiza-tion signal-import receptor interaclocaliza-tion . . . 62
4.1 Background . . . 62
4.2 Material AND Methods . . . 65
4.3 Result AND Discussion . . . 73
4.4 Conclusions . . . 84
Chapter 5 Conclusions . . . 86
5.1 Summary . . . 86
5.2 Main Conclusions . . . 87
List of Tables
Table 2.1 Features used in localization prediction algorithms . . . 11
Table 2.2 Proteins distribution in different locations for the test datasets . . . 16
Table 2.3 Prediction performance(MCC Scores) of individual predictors for the Yeast Low-Res dataset . . . 17
Table 2.4 Prediction performance(MCC Scores) of individual predictors for the Yeast High-Res dataset . . . 18
Table 2.5 Prediction performance(MCC Scores) of individual predictors for the Human dataset . . . 19
Table 2.6 The most frequent predictors selected by the minimalist algorithm and the best combination of K predictors . . . 25
Table 2.7 ConLoc on the Yeast Low-Res dataset . . . 31
Table 2.8 ConLoc on the Human dataset . . . 31
Table 3.1 Prediction performance of the sequence-based predictor on the Yeast dataset . . . 47
Table 3.2 Prediction performance of the sequence-based predictor on the Hy-brid dataset . . . 49
Table 3.3 Prediction performance of the integrated predictor on the Yeast dataset 57
Table 3.4 Prediction performance of the integrated predictor on the Hybrid dataset . . . 58
Table 3.5 Performance of different NLS predictors on the Yeast dataset . . . . 59
Table 3.6 Performance of different NLS predictors on the Hybrid dataset . . . 59
List of Figures
Figure 2.1 Prediction performance of the optimal ensemble algorithms . . . . 21
Figure 2.2 Contribution scores of individual predictors . . . 23
Figure 2.3 Performance of the best ensemble . . . 27
Figure 2.4 Performance of minimalist-ensemble and top-k accurate ensemble . 28 Figure 3.1 Flow charts of predicting NLS . . . 39
Figure 3.2 Prediction performance of the sequence-based predictor . . . 48
Figure 3.3 Linear motif attributes of NLSs . . . 52
Figure 3.4 ROC curves for the PrDOS disorder feature and the NetSurfP RSA feature . . . 53
Figure 3.5 Prediction performance of the integrated predictor . . . 55
Figure 3.6 Effect of IRLC-masking . . . 56
Figure 4.1 Flowchart of building the NIpredict model . . . 66
Figure 4.2 Residue pairs defined at the domain-peptide interaction interface for the major site . . . 70
Figure 4.3 Average energy contributions of different binding site positions . . . 74
Chapter 1
Introduction
1.1 Background
A eukaryotic cell is organized into different membrane surrounded compartments
containing characteristic proteins and performing specialized functions. Functions of
proteins are thus closely associated with their subcellular locations. With enormous
amount of sequences emerged from the genome sequencing projects, it becomes
in-creasingly important to develop practical tools for functional annotation based on
the relevant features from sequences such as localization. Although experimental
high-throughput approaches have been developed and applied to determine proteins
localization [1, 2], they are extremely expensive and time consuming. Fast, accurate
and genome-scale computational methods for predicting subcellular localization of
proteins provide an attractive complement to experimental methods.
On the other hand, most proteins are synthesized in the cytoplasm and are
trans-ported to their target subcellular locations. The translocations of nascent proteins
are usually guided by targeting signals encoded within the amino acid sequences of
proteins. Genome-wide identification and deciphering of those targeting signals are
important for inferring localization of proteins and understanding the transporting
mechanism. Experimentally identifying protein targeting signals is usually done by
mutating a target segment in the sequence and then checking its effect on the
prediction of targeting signals provides a complementary method to assist biologists
to design the experiments.
Computational prediction of sorting signals has substantially reduced time and
cost for biologists to discover sorting signals by focusing their experiments on
puta-tive motifs. However, protein localization is more than an issue of binary outcomes
(either localized or not localized to a target compartment). Localizations of certain
proteins are regulated through interactions of their sorting signals with other proteins
during specific cell cycle(s) [5,6]. Deregulation of such machanisms is associated with
numerous cancers such as breast cancers, prostate cancers, and other diseases [7–10].
1.2 Motivation
In the past ten years, dozens of protein localization algorithms have been proposed
based on different information sources such as amino acid composition, sorting signals,
functional motifs, conserved domains, homology search, and protein-protein
interac-tion [11]. A variety of machine learning techniques, such as SVM and K-nearest
neighbour classifiers, have been used in these prediction algorithms. Although
exis-tent methods have achieved success at different degrees, a comprehensive evaluation
study has shown that many of the reported prediction accuracies are far from
be-ing sufficient for genome wide protein localization prediction [12]. Recently, several
research groups proposed to apply ensemble or integration of algorithms to protein
lo-calization prediction [13–17]. Different ensemble algorithms are used in those studies
such as weighted and adaptive weighted voting [13], protocol-based ensemble
algo-rithm [14], Linear Discriminant Analysis (LDA) [15], J48 decision tree (DT) [16],
and two-layer decision tree [17]. Most of these ensemble algorithms integrated 10
or more standalone prediction methods for localization prediction without
consider-ing their relationships such as redundancy and complementarity. This makes these
unnec-essary predictors into an ensemble algorithm may overfit the training data and result
in degradation of its prediction performance, which has been reported recently for
ensemble mitochondrion predictors [18]. in the first part of the dissertation, we
pro-posed a systematic work to evaluate 9 standalone localization prediction algorithms
and analyze their bias and relationships in the prediction space of the resulting
en-semble algorithms. We found that enen-semble algorithms based on the combination of
several specific predictors achieved comparable prediction performance as using all 9
predictors, suggesting that a high degree of redundancy exists among all individual
predictors. We thus proposed a minimalist ensemble prediction algorithm for
subcel-lular localization prediction and evaluated its performance on two data sets, which
showed high performance and significant reduction of computational complexity and
running time.
On the other hand, compared to DNA regulatory motifs, computational
predic-tion of targeting signals remains challenging due to their low conservapredic-tion at the
amino acid level. In the case of Nuclear Localization Signal (NLS), several NLS
prediction methods have been developed such as PSORT II [19], PredictNLS [20],
NLStradamus [21], cNLS Mapper [22], and NucImport [23]. PSORT II predicts NLSs
based on sequence patterns implemented as three simple rules according to the
clas-sification of NLSs [24]; the rules are mainly combinations of clusters of basic amino
acids K and R and gaps between clusters. PredictNLS predicts NLSs based on 194
potential NLS motifs, which are derived from 114 experimentally verified NLSs by
applying a silico mutagenesis approach. Nguyen Ba et. al. [21] found that NLSs
tend to have similar residue frequency distributions which are different from that of
background residues. Their NLStradamus algorithm detects NLSs by using a
sim-ple two-state or four-state HMMs to accommodate the frequency variations. cNLS
Mapper estimates classical NLS (cNLS) functionality of a peptide by calculating the
activity-based profiles, which are obtained from systematic amino-acid-replacement
analyses in budding yeast. NucImport [23] builds a Bayesian network to predict
nu-clear localization by incorporating various attributes related to nunu-clear importing. If
a protein is predicted as a nuclear protein, the location of its NLS is predicted as the
segment in the protein with the highest cNLS score in the inferred cNLS class based
on the dependencies with other attributes in the Bayesian network.
These five NLS prediction methods have achieved success at different degrees.
However, their prediction performances are still far from being sufficient to assist
biologists to discover putative NLSs in protein sequences of interest. Each of them
has their own shortcomings. Although a great portion of NLSs can be covered by
the rules used in PSORT II to detect NLS, quite many of the patterns covered by
the rules commonly exist in peptides which do not contain NLSs, leading to a high
false positive rate. The sensitivity of the PredictNLS algorithm depends on the
num-ber of NLS motifs it used, which has been extended by introducing the potential
NLS motifs generated using in-silicon mutagenesis analysis. But they are still too
specific and couldn’t effectively accommodate NLS variability [21]. The performance
of the NLStradamus algorithm strongly depends on its assumption that NLSs have
certain residue distributions. However, many NLS instances in our testing datasets
have shown very different residue frequencies. Both cNLS mapper and NucImport
algorithms are developed based on the characteristics of cNLS. However,
approxi-mately 43% of all nuclear proteins may use other transport mechanisms other than
the classical nuclear import pathway according to Allison Lange et al [25].
All the aforementioned NLS prediction methods heavily rely on sequence features
of NLS to predict NLSs. However, NLSs are known to have diverse sequence patterns
while the knowledge to NLS sequence patterns is limited. In the second part of
the dissertation, we propose a novel algorithm which apply frequent pattern mining
be used to effectively detect potential NLSs. In addition, we introduce a model which
utilizes the fact that NLS is one type of linear motifs. This model can integrate the
mined sequence patterns and the linear motif attributes of NLS to effectively predict
NLS.
In recent years, an increasing number of researches are devoted to studying nuclear
import regulation of proteins. The discovery of the import regulation mechanism for a
particular nuclear protein is of great interest since it implies a potential way to control
the protein’s activity [5]. Moreover, it contributes to uncovering the potential
biolog-ical pathways that regulate the associated biologbiolog-ical activities in the nucleus. Nuclear
import activity is mostly regulated through modulating the interactions between
nu-clear proteins and their binding import receptors [8]. In particular, modulating the
NLS binding affinity to its binding receptor by post-translational modification (PTM)
is the best understood mechanism (PTM-based nuclear import regulation) that
reg-ulates the nuclear import of proteins. In previous studies, the most common type of
PTM for nuclear import regulation is phosphorylation [5, 6, 26–28] while lysine
acety-lation has been found to be another frequent type [29–36]. The reason that nuclear
import can be regulated through the PTM is that nuclear import activity is directly
related to the binding affinity of NLS for its binding import receptor [37–39].
How-ever, identifying the PTM-based nuclear import regulation is difficult since PTM may
promote, repress or may not have obvious impact on the nuclear import activity [27].
The most commonly used approach to infer the PTM-based nuclear import
regu-lation is the site-directed mutagenic analysis [26, 32, 40–46]. This approach basically
mutates the NLS residue at the PTM site to a residue that either prevents the PTM
or mimics the residue after the PTM. It then evaluates the likelihood that the PTM
regulates the nuclear import of the protein based on the change of the
correspond-ing nuclear import activity. The strategy of mimickcorrespond-ing residue after PTM such as
the position-wise contributions of different amino acids to the nuclear import activity
are approximated in the activity-based profiles. However, the interaction between a
NLS and its binding import receptor is very sensitive to the NLS change. The
site-directed mutagenic analysis is thus not always reliable due to the difference between
the mimicking residues and the residues after PTM. Since the PTM-based nuclear
import regulation is now recognized as a common nuclear import regulation
mecha-nism, there is a need for developing quantitative methods to expand the identification
of more PTM-regulated nuclear proteins [27].
For the PTM-based nuclear import regulation, it is technically true that PTM
regulates the nuclear import of a protein through modification of its NLS residue(s).
However, the induced change on the interaction between the NLS and the import
receptor is the ultimate factor that governs the change on its nuclear import activity.
In other words, the induced change on the NLS-import receptor interaction should
better characterize the change of the nuclear import activity caused by PTM than
the difference of the NLSs. Therefore, in our method we first applied molecular
interaction energy components (MIEC) [47–50], which has been successfully used to
characterize domain-peptide interactions, to characterize the NLS-import receptor
interaction. Next, we used SVR to learn the relationship between the MIEC features
and the corresponding nuclear import activity, which is quantitated as NLS activity
scores [22] in the experimental dataset. The characteristic of our method (NIpredict)
is that it is a machine learning based method based on features calculated from
NLS-import receptor interaction interface, which can thus be applied to assess the impact
of PTM within NLS on the corresponding nuclear import activity.
1.3 Contributions and Significance
The research presented in this work addresses three major problems discussed in the
• Analyzing the existing 9 protein localization predictors systematically, which in
particular addresses issues of algorithm redundancy, consensus mistakes, and
algorithm complementarity in designing ensemble algorithms (in Chapter 2).
• Proposing a novel method for rational design of minimalist ensemble algorithms
for practical genome-wide protein subcellular localization prediction, which can
significantly reduce the number of individual predictors in a given ensemble
algorithm while maintaining comparable performance (in Chapter 2).
• Demonstrating the linear motif attributes of NLS such as disorder, relative
surface area, and relatively local conservation (in Chapter 3).
• Proposing an algorithm (SeqNLS) to predict NLS which outperforms other
state-of-the-art NLS predictors (in Chapter 3).
• Proposing an algorithm (NIpredict) to predict nuclear import activity effectively
based on NLS-import receptor interaction (in Chapter 4).
• Developing a systematic framework to identify potential PTM-based nuclear
import regulations for human and yeast nuclear proteins based on NIpredict (in
Chapter 4).
• Uncovering the potential nuclear import regulation mechanisms by
phosphory-lation and/or acetyphosphory-lation of three nuclear proteins including SF1, histone H1,
and ORC6 (in Chapter 4).
1.4 Organization of the Dissertation
The rest of the dissertation is organized into five chapters:
Chapter 2 analyzed 9 existing protein localization predictors, which in
complementarity in designing ensemble algorithms. A framework of designing
mini-malist ensemble algorithms for practical genome-wide protein subcellular localization
prediction was proposed, which could significantly reduce the number of individual
predictors in a given ensemble algorithm while maintaining comparable performance.
The work has been published in BMC Bioinformatics, 2012 [51].
Chapter 3 proposed a NLS prediction algorithm, SeqNLS. The method applied
frequent pattern mining techniques to address the issues of diverse patterns of NLS.
In addition, we demonstrated the linear motif attributes of NLS and designed an
algorithm to incorporate the linear motif features of NLS into our method, which
sucessfully improved the NLS prediction accuracy. The work has been accepted in
PLoS One, 2013 [52].
Chapter 4 proposed a nuclear import activity prediction algorithm, NIpredict.
The prediction is based on characterized NLS-import receptor interaction and can
be used to identify nuclear proteins whose nuclear import is regulated by PTM. We
applied our method in human and yeast genome and uncovered serveral potential
nuclear import regulation mechanisms.
Chapter 5 summarized the main results in the dissertation and presented some
Chapter 2
Minimalist Ensemble Algorithms for Genome-wide Protein Localization
Prediction
2.1 Background
Functions of proteins are closely correlated with their subcellular locations. For
exam-ple, Assfalg et al. [53] showed that there exists strong correlation between localization
and proteins fold and localization can be utilized to predict structure class of proteins.
It is thus desirable to accurately annotate subcellular location of proteins to elucidate
their functions. In the past ten years, dozens of protein localization algorithms have
been proposed based on different information sources such as amino acid composition,
sorting signals, functional motifs, conserved domains, homology search, and
protein-protein interaction [11]. A variety of machine learning techniques, such as SVM and
K-nearest neighbour classifiers, have been used in these prediction algorithms.
Al-though existent methods have achieved success at different degrees, a comprehensive
evaluation study has shown that many of the reported prediction accuracies are far
from being sufficient for genome wide protein localization prediction [12].
Recently, several research groups proposed to apply ensemble or integration of
al-gorithms to protein localization prediction [13–17]. Liu et al. [13] proposed weighted
and adaptive weighted voting algorithms in which the overall accuracy of a
stan-dalone algorithm is used as the weight. Laurila and Vihinen [14] proposed an
binary localization prediction algorithms such as TMHMM and Phobius. Park et
al. [15] developed a Linear Discriminant Analysis (LDA) method (ConLoc ) to assign
LDA optimal weights for weighted voting. Assfalg et al. [16] proposed two ensemble
localization algorithms; one is a scored voting scheme based on the ranks of the
pre-diction accuracy of the predictors; the other chose J48 decision tree (DT) classifier
as the integration scheme. Shen and Burger [17] proposed a two-layer decision tree
method to improve the prediction accuracy of a single subcellular location. Most of
these ensemble algorithms integrated 10 or more standalone prediction methods for
localization prediction without considering their relationships such as redundancy and
complementarity. This makes these ensemble algorithms computationally intensive.
Furthermore, incorporation of unnecessary predictors into an ensemble algorithm may
overfit the training data and result in degradation of its prediction performance, which
has been reported recently for ensemble mitochondrion predictors [18].
In this chapter, we evaluated 9 standalone localization prediction algorithms and
analyzed their bias and relationships in the prediction space of the resulting
ensem-ble algorithms. We found that ensemensem-ble algorithms based on the combination of
several specific predictors achieved comparable prediction performance as using all 9
predictors, suggesting that a high degree of redundancy exists among all individual
predictors. We thus proposed a minimalist ensemble prediction algorithm for
subcel-lular localization prediction and evaluated its performance on two data sets, which
showed high performance and significant reduction of computational complexity and
running time.
2.2 Methods
2.2.1 Standalone protein localization predictors
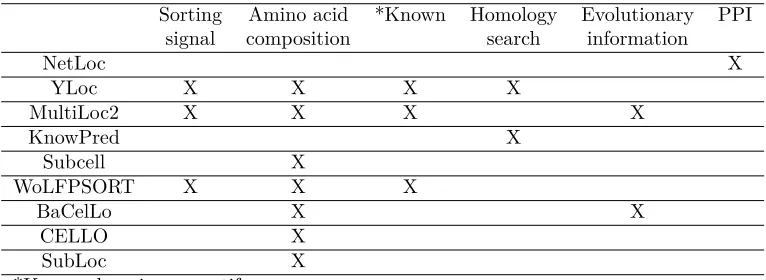
localiza-Table 2.1: Features used in localization prediction algorithms
Sorting Amino acid *Known Homology Evolutionary PPI
signal composition search information
NetLoc X
YLoc X X X X
MultiLoc2 X X X X
KnowPred X
Subcell X
WoLFPSORT X X X
BaCelLo X X
CELLO X
SubLoc X
*Known domains or motifs
able, and batch submission is supported. These algorithms include YLoc [54],
Multi-Loc2 [55], KnowPred [56], Subcell [57], WoLFPSORT [58], BaCelLo [59], CELLO [60],
SubLoc [61]. We also included NetLoc [62], a protein-protein interaction (PPI) based
prediction method. These prediction methods differ in the features that
character-ize proteins targeting different subcellular locations (Table 2.1) and the prediction
algorithms. These diverse features include sorting signals, amino acid composition,
known motifs or domains, homology search against a known dataset or database
such as SwissProt, evolutionary information such as phylogenetic profiles or sequence
profiles, and protein-protein interaction. The overlap of the used features among
lo-calization predictors suggests that redundant predictions could be made when these
prediction methods are combined to build an ensemble algorithm, which could
mis-lead the prediction behaviour of the resulting ensemble algorithm.
In addition to amino acid sequence information, protein-protein interaction has
been known as external information correlated to protein subcellular localization. A
number of algorithms have been developed to utilize PPI features to predict
pro-tein localization (Hishigaki et al [63], Lee et al [64] and Shin et al [65]). Recently,
our group developed NetLoc [62], a kernel-based logistic regression (KLR) method,
which can effectively extract PPI features to predict protein localization. Considering
ensem-ble algorithms to compare the ensemensem-ble performances with and without a PPI-based
predictor. In our experiments, PPI data of NetLoc is based on the whole
Saccha-romyces cerevisiae physical PPI dataset obtained from BioGRID database [66]. We
exclude proteins overlapped with our Yeast datasets from the PPI dataset to ensure
independency between the training and testing datasets.
2.2.2 Mapping of subcellular locations
Different localization predictors may have different subcell resolutions. In order to
compare their performances on genome wide datasets, we applied a location
map-ping scheme to map the subcellular locations of standalone predictors to unified 5
locations in the ensemble algorithms, including Cytosol, Mitochondrion, Nucleus,
Secretory (secretory pathway), and Others. Six classes of subcellular locations are
mapped to Secretory according to [55]: extracellular, plasma membrane, endoplasmic
reticulum, golgi apparatus, lysosomal, and vacuolar. Except for Cytosol,
Mitochon-drion, Nucleus, and Secretory, the remaining subcellular locations are categorized as
Others. For example, for CELLO, the following subcellular locations are mapped to
Secretory: extra, plas, er, vacu, golgi, and lyso; chlo, pero, and cytos are mapped
to Others. For WoLFPSORT, E.R., extr, plas, golg, lyso, and vacu are mapped to
Secretory; chlo, cysk, and pero are mapped to Others.
2.2.3 Contribution score
To explore the complementary relationship among the individual predictors used in
an ensemble algorithm, we calculated contribution scores [67] of component
stan-dalone prediction methods. This measure is used to evaluate the contribution of
each individual classifier to the ensemble algorithm, and has been used for pruning
large ensemble set. The main idea of the contribution score is that predictors that
higher since they make unique contribution and thus are essential for the
ensem-ble algorithm. On the other hand, predictors with low contribution scores tend to
make incorrect and majority predictions. The contribution score of a predictor in an
ensemble algorithm is calculated as follows: Contribution score of predictor i =
N ∑
j=1
(αi j(2v
(j)
max−v
(j)
pi(proteinj)) +βi jv
(j)
sec+θi j(v
(j)
correct−v
(j)
pi(proteinj)−v
(j)
max))
where:
αi j =
10 if potherwisei(protein. j)=realj and pi(proteinj) is in the minority group;
βi j =
10 if potherwisei(protein. j)=realj and pi(proteinj) is in the majority group;
θi j =
10 if potherwisei(protein. j), realj;
Symbols in the formula are explained as follows: for a protein j, the prediction
results of nine predictors in the order of predictor 1 to predictor 9 are Cytosol, Nucleus,
Nucleus, Mitochondrion, Nucleus, Cytosol, Nucleus, Nucleus, and Nucleus, while the
real localization of protein j is Cytosol. In this case, the majority votes (predictions)
are for Nucleus, the number of the majority votes is denoted as v(maxj) , which is 6; the
number of the second majority votes is denoted asv(secj) , which is 2; the number of the
correct votes is denoted as v(correctj) , which is 2; the prediction result of predictor i is
denoted as pi(proteinj) ; the number of predictors having the same prediction result
with predictor i is denoted as v(pj)
i(proteinj). From the formula, we can see that predictor
1 and predictor 6 have the same positive contribution, which is 2*6-2=10; predictor
negative contribution, which is -10. If the dataset used to learn contribution scores
has N proteins, then the final contribution score of a predictor is summation of its
N contributions. We normalized the final contribution scores (CS) with the formula:
(CS −µ)/σ where µ and σ are mean and standard deviation of contribution scores
among predictors.
2.2.4 Minimalist ensemble prediction algorithm
Existing ensemble algorithms tend to include as many as possible component
classi-fiers for better prediction performance. However, including redundant predictors not
only increases computational complexity and collecting effort, but also may lead to
over-fitting [9]. Moreover, predictors with poor performance could mislead the
ensem-ble algorithms especially those using majority voting schemes. It is thus desiraensem-ble to
find the minimal subset of predictors for achieving equally good or better prediction
performance. Several strategies can be used to find the minimal set of predictors:
exhaustive search of all possible combinations of component predictors, feature
selec-tion, and selecting top k most accurate predictors. We did an exhaustive search for
all combinations of K individual predictors to build different ensemble algorithms. It
shows that combining 6 out of 9 predictors can achieve the best performance when the
logistic regression classifier was used to integrate the predictions. However,
exhaus-tive search is a time consuming process especially when the set of available predictors
is large. Top-K accuracy selection method is straightforward and fast, but has the
limitation of neglecting the redundancy among individual predictors.
Here we proposed a minimalist ensemble design method to approximate the
small-est set of predictors with the bsmall-est possible prediction accuracy. The rationale is to
find the smallest subset of predictors whose predictions are highly correlated to the
real locations. The minimalist ensemble design problem is similar to feature selection
we chose the correlation based feature subset evaluator (CfsSubsetEval) [68] as the
attribute evaluator to evaluate correlation between a feature subset and the class.
Greedy-Stepwise method is used to search optimal feature subsets in different size of
K through the space: the starting point of search is set as the set with all available
predictors (assume size N). Each time Greedy-Stepwise algorithm will remove one
feature or predictor from the set which would produce a reduced set with the
high-est possible CfsSubsetEval Score. We continue the process until set size is 1, while
along the way the predictors in the set with size K are recorded as the output of our
minimalist ensemble algorithm. After the K individual predictors are selected based
on the training dataset, their predicted localizations for all proteins in the training
dataset will be used as features, and a machine learning based classifier, such as naive
Bayes, logistic regression, or decision trees is used to train a classifier to predict the
final subcellular localization. This method used to select minimalist set of individual
predictors can also be used for building ensemble algorithms based on weighted voting
or LDA.
2.2.5 Datasets preparation
Two genome-wide protein localization databases are used to build three datasets in
our experiments. The yeast dataset is obtained from Huh et al [1]. We excluded
pro-teins localized to Others (after location mapping) and multi-location propro-teins from
the yeast dataset. Two versions of the yeast dataset with different resolutions are
prepared; for the low-resolution yeast dataset (Yeast Low-Res), we extracted proteins
in Cytosol, Nucleus, Mitochondrion, Secretory after location mapping. For the
high-resolution yeast dataset (Yeast High-Res), we extracted proteins in Cytosol, Nucleus,
Mitochondrion, ER, Vacuole, Golgi, and Cell Periphery (plasma membrane and
ex-tracellular). The Human dataset is obtained from the LOCATE database [69] by
Extra-cellular). Then we removed all multi-location proteins. For both Yeast and Human
datasets, Blastclust with 30% sequence identity was used to remove redundant
se-quences. In addition, proteins overlapped with the training datasets of component
predictors in the corresponding ensemble experiment are removed. It should be noted
that the Yeast High-Res dataset is highly overlapped with the Yeast Low-Res datasets.
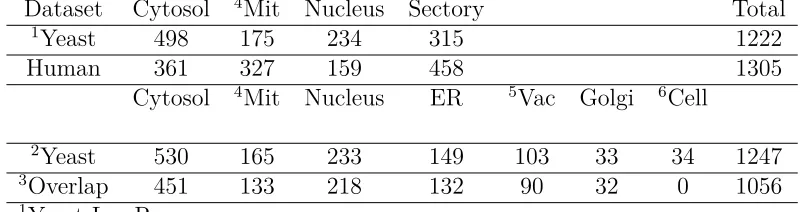
The final distribution of proteins in different locations for the three datasets is shown
in Table 2.2.
Table 2.2: The distributions of proteins in different locations for the test datasets
Dataset Cytosol 4Mit Nucleus Sectory Total
1Yeast 498 175 234 315 1222
Human 361 327 159 458 1305
Cytosol 4Mit Nucleus ER 5Vac Golgi 6Cell
2Yeast 530 165 233 149 103 33 34 1247
3Overlap 451 133 218 132 90 32 0 1056
1Yeast-LowRes 2Yeast-HighRes
3Overlap of Yeast-LowRes and Yeast-HighRes 4Mitochondrion
5Vacuole 6Cell Periphery
2.2.6 Evaluation of individual Predictors and ensemble algorithms
To evaluate the performance of predictors, accuracy and MCC were calculated using
the equations below: Accuracy: MCC: where TP, TN, FP, FN means true positive,
true negative, false positive and false negative predictions. It should be noted that
since localization prediction is a multi-class classification problem, MCC can only
be calculated for each location while an overall accuracy can be calculated for each
prediction method for a given dataset. In our experiments, 10-fold cross-validation
2.3 Results and Discussion
2.3.1 Evaluation of individual predictors
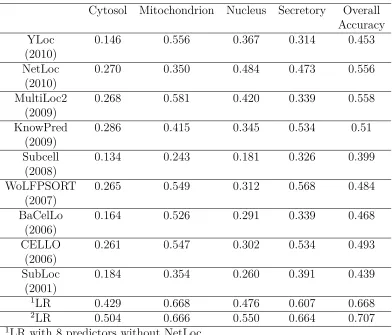
Table 2.3: Prediction performance(MCC Scores) of individual predictors for the Yeast Low-Res dataset
Cytosol Mitochondrion Nucleus Secretory Overall Accuracy
YLoc 0.146 0.556 0.367 0.314 0.453
(2010)
NetLoc 0.270 0.350 0.484 0.473 0.556
(2010)
MultiLoc2 0.268 0.581 0.420 0.339 0.558
(2009)
KnowPred 0.286 0.415 0.345 0.534 0.51
(2009)
Subcell 0.134 0.243 0.181 0.326 0.399
(2008)
WoLFPSORT 0.265 0.549 0.312 0.568 0.484
(2007)
BaCelLo 0.164 0.526 0.291 0.339 0.468
(2006)
CELLO 0.261 0.547 0.302 0.534 0.493
(2006)
SubLoc 0.184 0.354 0.260 0.391 0.439
(2001)
1LR 0.429 0.668 0.476 0.607 0.668
2LR 0.504 0.666 0.550 0.664 0.707
1LR with 8 predictors without NetLoc 2LR with all 9 predictors
We obtained the prediction results on three test datasets (Yeast Low-Res, Yeast
High-Res and Human) from the selected individual predictors using the web servers or
standalone programs and then evaluated their accuracy and MCC scores. The results
of 9 predictors for the Yeast Low-Res dataset are shown in Table 2.3, the results of 6
predictors for the Yeast High-Res dataset are shown in Table 2.4, and the results of
8 predictors for the Human dataset are shown in Table 2.5.
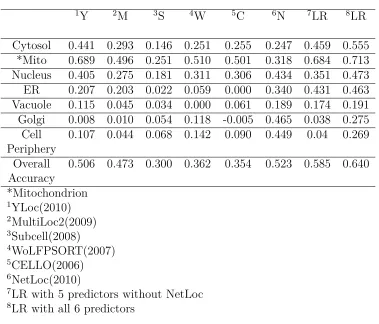
Table 2.4: Prediction performance(MCC Scores) of individual predictors for the Yeast High-Res dataset
1Y 2M 3S 4W 5C 6N 7LR 8LR
Cytosol 0.441 0.293 0.146 0.251 0.255 0.247 0.459 0.555 *Mito 0.689 0.496 0.251 0.510 0.501 0.318 0.684 0.713 Nucleus 0.405 0.275 0.181 0.311 0.306 0.434 0.351 0.473 ER 0.207 0.203 0.022 0.059 0.000 0.340 0.431 0.463 Vacuole 0.115 0.045 0.034 0.000 0.061 0.189 0.174 0.191 Golgi 0.008 0.010 0.054 0.118 -0.005 0.465 0.038 0.275 Cell 0.107 0.044 0.068 0.142 0.090 0.449 0.04 0.269 Periphery
Overall 0.506 0.473 0.300 0.362 0.354 0.523 0.585 0.640 Accuracy
*Mitochondrion
1YLoc(2010) 2MultiLoc2(2009) 3Subcell(2008)
4WoLFPSORT(2007) 5CELLO(2006) 6NetLoc(2010)
7LR with 5 predictors without NetLoc 8LR with all 6 predictors
on predicting Mitochondrion proteins. For the Yeast High-Res dataset (Table 2.4), we
can see that all predictors except NetLoc showed poor performance on predicting
pro-teins localized to secretory pathway compartments especially golgi, and cell periphery.
This suggests that PPI can be an effective feature for predicting low-resolution
com-partments. Predictors with relatively high accuracy on the Yeast Low-Res Secretory
proteins, such as CELLO and WoLFPSORT, don’t have corresponding performance
on predicting proteins localized to ER, Golgi, Vacuole in the Yeast High-Res dataset
which are highly overlapped with the Yeast Low-Res Secretory proteins (Table 2.3).
This means those predictors have difficulties in distinguishing smaller compartments
of secretory pathway. YLoc and MultiLoc2 have very different performances between
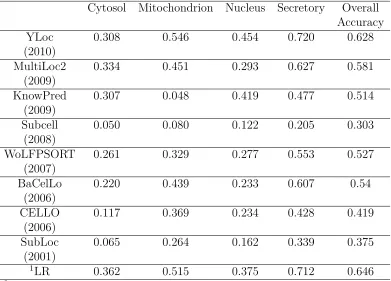
differ-Table 2.5: Prediction performance(MCC Scores) of individual predictors for the Hu-man dataset
Cytosol Mitochondrion Nucleus Secretory Overall Accuracy
YLoc 0.308 0.546 0.454 0.720 0.628
(2010)
MultiLoc2 0.334 0.451 0.293 0.627 0.581
(2009)
KnowPred 0.307 0.048 0.419 0.477 0.514
(2009)
Subcell 0.050 0.080 0.122 0.205 0.303
(2008)
WoLFPSORT 0.261 0.329 0.277 0.553 0.527
(2007)
BaCelLo 0.220 0.439 0.233 0.607 0.54
(2006)
CELLO 0.117 0.369 0.234 0.428 0.419
(2006)
SubLoc 0.065 0.264 0.162 0.339 0.375
(2001)
1LR 0.362 0.515 0.375 0.712 0.646
1LR with all 8 predictors
ent training datasets. For the Human dataset (Table 2.5), the Secretory proteins
(which are exclusively Extracellular proteins) are the easiest for YLoc, MultiLoc2,
and WoLFPSORT, which may suggest that these proteins have more distinct
fea-tures such as secretory pathway signals than the Yeast Secretory proteins. As shown
in Table 2.1, YLoc, MultiLoc2, and WoLFPSORT all use sorting signals as one of
their features. The variation of prediction performance of the individual predictors
implies that an ensemble algorithm may be able to integrate their strengths and
achieve better overall performance.
2.3.2 Ensemble performance
From Table 2.3 to 2.5 we can compare the performances between logistic regression
We can see that LR ensemble has better overall accuracy than the best element
predictor over the three datasets; for the Yeast Low-Res dataset and Yeast
High-Res dataset, LR ensemble have more than 10% improvement over the best element
predictors when integrating all available element predictors. However, LR ensemble
does not always have the best performance on each compartment. This is because the
ensemble training process is to optimize the overall accuracy while performance of
certain compartment(s) could be compromised. We can also see that when all of the
element predictors failed on certain compartments, such as Golgi and Cell Periphery in
the Yeast High-Res dataset, LR ensemble doesn’t have any improvement on predicting
those compartments.
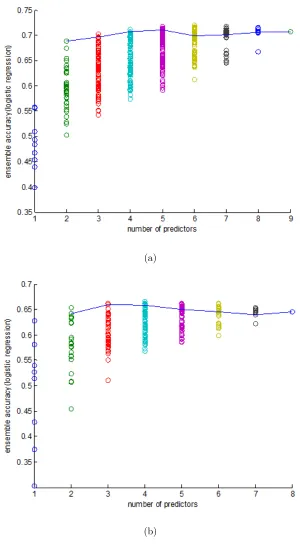
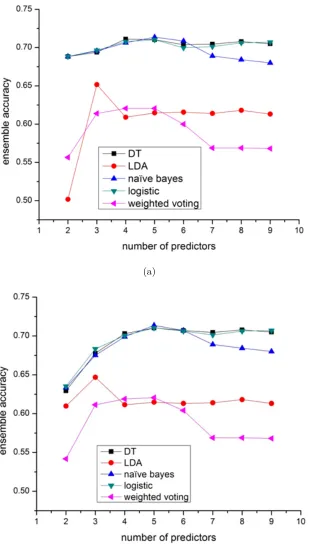
2.3.3 Prediction performance of the optimal ensemble algorithms using exhaustive
search
Here we evaluated the prediction accuracy of the logistic regression ensemble
algo-rithm with all combinations of K (K=2...9) predictors using 10-fold cross-validation.
Figure 2.1(a) shows the result tested on the Yeast Low-Res dataset. First, we found
that by using just three predictors, the ensemble algorithm can achieve comparable
performance as using nine predictors. The 3 predictors are NetLoc (PPI),
WoLFP-SORT and YLoc which cover most of the available features among the predictors. On
the other hand, the ensemble algorithm composed of predictors with low coverage of
features has poor prediction efficiency. It is also observed that when more predictors
were used, the performance discrepancy between the ensemble algorithms based on
different predictors became smaller. This indicates that the prediction performance
is more reliable as the number of predictors increases.
We also evaluated the ensemble performance on the Human dataset with all
com-binations of predictors including YLoc, MultiLoc2, WoLFPSORT, CELLO, SubLoc,
(a)
(b)
over the best individual predictor has been achieved by the LR ensemble compared to
the Yeast dataset. One reason is that the ensemble algorithm for the Yeast dataset
includes NetLoc which uses protein-protein correlation network information for
lo-calization prediction. This distinctive feature makes it complementary to the other
algorithms, which leads to significant performance boosting. Another reason may be
that the strengths and bias of different predictors are enlarged or reduced to different
degrees on different datasets, which may result in the change of complementary
re-lationship among predictors. The varying complementary rere-lationship thus leads to
different prediction accuracy of the ensemble composed of the same set of predictors
on different datasets.
2.3.4 Contributions of individual predictors to the ensemble algorithm
To explore the contributions of individual predictors to the ensemble algorithm and
their redundant or complementary relationships, we calculated their contribution
scores in the ensemble algorithm for the Yeast Low-Res and Human datasets. Nine
predictors are available for the Yeast Low-Res dataset and 8 predictors for the
Hu-man dataset. Figure 2.2(a) and 2.2(b) show the normalized contribution scores and
prediction accuracies of the 9 (8) predictors on the Yeast Low-Res dataset and
Hu-man dataset respectively. For the Yeast Low-Res dataset, YLoc2, Subcell,
WolfP-SORT, BaCelLo, CELLO, and SubLoc all have relatively low contribution scores,
which suggests that their predictions are highly redundant with the other
predic-tors’ predictions. We also found that the predictors simply using the most common
features(amino acids composition) such as CELLO, SubLoc, Subcell, all have
rela-tively low contribution scores, which suggests that the proteins whose localizations
can be correctly predicted by these predictors can also be predicted correctly by other
predictors. On the other hand, it can be observed that predictors using distinct
(a)
(b)
(PPI) has the highest contribution score because it used very different PPI
informa-tion compared to other predictors, which allows it to correctly predict proteins that
other individual predictors cannot. KnowPred applies a sophisticated local similarity
method to detect remote sequence homology and therefore might correctly predict
some proteins that most of others cannot. Another reason why NetLoc and
Know-Pred have relatively high contribution scores is that they don’t use other common
features so they are less likely to make the same wrong predictions like other
pre-dictors. For the Human dataset, YLoc, MultiLoc2 and KnowPred have the highest
contribution scores while CELLO, SubLoc, and Subcell still have the lowest
contribu-tion scores, which suggests that the latter three predictors’ correct prediccontribu-tions can be
covered by the other component predictors or that they tend to mislead the ensemble
algorithm by making majority incorrect predictions. This contribution score analysis
can thus be applied to evalute future new protein localization predictors in terms of
their unique prediction capability.
2.3.5 Prediction performance of the minimalist ensemble algorithm
To test the performance of our minimalist LR ensemble algorithm with K component
predictors, we run the minimalist algorithm to generate the combination of
predic-tors for each K to build the minimalist ensemble algorithms and then tested them
on the Yeast Low-Res and Human datasets. The results in Figure 2.1 show that
for the LR ensemble method, our minimalist ensemble algorithm can achieve
near-optimal performance for any given K value. We also found that using 3-4 individual
predictors can obtain near-best performance for all possible K values on the Yeast
Low-Res dataset. This means that our minimalist ensemble algorithm can use 1/2 to
1/3 of individual predictors used by existing ensemble algorithms to achieve similar
performance while remarkably reducing the computational effort.
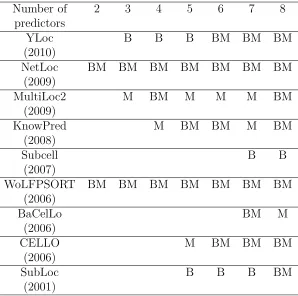
ensemble algorithms, Table 2.6 shows the most frequent predictors selected by the
minimalist ensemble algorithms during the 10-fold cross-validation and the best
com-bination for each K according to the exhaustive search of the LR ensemble on the
Yeast Low-Res dataset. It is interesting to find that NetLoc and WoLFPSORT are
the key component algorithms that are selected by the best combination and the
minimalist ensemble with different K components. YLoc is the second tier of
al-gorithms selected by the best combination, while MultiLoc2 is the second tier of
algorithm selected by the minimalist algorithm. The consistent difference of the
se-lected component predictors between the best combination and the minimalist after
the key component algorithms is due to that our minimalist algorithm used greedy
and stepwise method to search the optimal K component predictors.
Table 2.6: The most frequent predictors selected by the minimalist algorithm with size of each K (note by M) during the 10-fold cross-validation and the best combination of K predictors (noted by B) according to the exhaustive search result of the logistic regression ensemble on the Yeast dataset
Number of 2 3 4 5 6 7 8
predictors
YLoc B B B BM BM BM
(2010)
NetLoc BM BM BM BM BM BM BM
(2009)
MultiLoc2 M BM M M M BM
(2009)
KnowPred M BM BM M BM
(2008)
Subcell B B
(2007)
WoLFPSORT BM BM BM BM BM BM BM
(2006)
BaCelLo BM M
(2006)
CELLO M BM BM BM
(2006)
SubLoc B B B BM
2.3.6 Comparison of computational complexity
The computational complexity of the ensemble involves the effort to collect prediction
results from individual predictors either from local software running or from web
servers and the total running time. Since most of the predictors are available only
via web servers which are sometimes offline, it is desirable to have fewer component
predictors. As demonstrated in Figure 2.1, the minimalist algorithm can efficiently
find the key component predictors. Since only 4 predictors are needed for the ensemble
algorithm to achieve comparable performance of using 9 predictors, about 1/2 to 2/3
amount of computation time to collect prediction results can be saved.
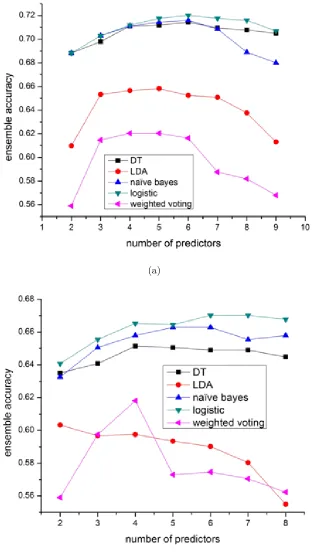
Several ensemble schemes have been proposed for building ensemble localization
prediction algorithms, including weighted voting [4] (weight is assigned based on
pre-dictor accuracy), LDA [6], and classifiers-based ensemble algorithms such as decision
tree (DT) [7]. It is interesting to compare their performance on the genome-wide
Yeast and Human datasets. Here we compared their best performance given K
in-dividual predictors selected by exhaustive search. As shown in Figure 2.3, weighted
voting has the worst performance and its performance degrades dramatically when
more individual predictors are included. This is because its prediction can be
eas-ily biased by redundant low-performance predictors. LDA ensemble is better than
weighted voting because it can assign LDA optimal weights to predictors and avoid
the prediction results being biased by low-performance predictors. However, it is
still a voting based algorithm which might not be able to capture the rules relating
the predictions of predictors to the real locations. For other classifiers-based (such
as naive Bayes, decision tree and logistic regression) ensemble methods, they yield
better prediction accuracy because these machine learning algorithms can better find
and learn the rules between the features (predictions of individual predictors) using
(a)
(b)
(a)
(b)
shows, if too many predictors are included, voting based ensemble algorithms such as
weighted voting and LDA show the trend of downgrading the performance.
Figure 2.3(a) and 2.3(b) showed the performance of the ensemble algorithms with
or without including the PPI based predictor NetLoc. It is observed that ensemble
algorithms without NetLoc have much less improvement over the best individual
predictors, which means that these ensemble algorithms except weighted voting can
automatically take advantage of the unique/beneficial component predictors (such
as NetLoc which uses a unique protein-protein interaction features) to improve the
performance. From Figure 2.3(b) we also noticed that LDA ensemble’s performance
could degrade dramatically when too many redundant predictors are included without
including predictor(s) with distinct property such as NetLoc.
We also compared the performances of the minimalist ensemble algorithms on the
Yeast Low-Res dataset. The result is shown in Figure 2.4(a), which demonstrates
similar relationship of the performance for the evaluated ensemble algorithms in
Fig-ure 2.3(a) and 2.4(b) shows the performance of the ensemble methods by selecting
the top K accurate predictors. We can see that the main peformance difference
be-tween the minimalist ensemble and top-K ensemble is when K is less than 4, which
means the top 4 accurate predictors can form a very complimentary group. However,
top K method is not reliable especially when the predictor with distinct features has
relatively low accuracy, or when many included predictors are highly redundant.
2.3.7 Comparison with other ensemble algorithms
There are several published and publicly available ensemble algorithms such as
Con-Loc [6] and PROlocalizer [5]. ConCon-Loc intergrated 13 different predictors and used
LDA as the ensemble scheme. PROlocalizer intergrated 11 different programs to
pre-dict localization of animal proteins. We tested ConLoc on our Yeast Low-Res and
although our datasets are not overlapped with ConLoc ensemble training dataset,
the performance result of ConLoc can still be overestimated since we didn’t exclude
proteins of our datasets that are overlapped with the training datasets of ConLoc’s
13 element predictors. To test our minimalist ensemble algorithm, we first collected
predictions of ConLoc’s 13 element predictors on the Yeast Low-Res and Human
datasets and then tested LR ensemble with 10-fold cross-validation. The results
(Ta-ble 2.7 and 2.8) showed that LR ensem(Ta-ble achieved higher accuracy than LDA based
ConLoc on both datasets, which is consistent with our previous experiment results
(Figure 2.3(a) and 2.3(b)) alghough ConLoc LDA used a different ensemble training
dataset.
To investigate the redundancy among ConLoc’s 13 predictors, we applied our
minimalist algorithm to select K out of the 13 predictors and tested them on the
Yeast Low-Res dataset and the Human dataset. The results (Table 2.7 and 2.8,
column 5) showed that for the Yeast Low-Res dataset, using only 4 predictors can
achieve equally good performance as using all the 13 predictors. The most frequent
4 predictors selected by our minimalist algorithm during the 10-fold cross-validation
are CELLO, Proteome Analyst, PTS1Prowler, and SherLoc. For the Human dataset,
using only 3 predictors can achieve better performance than using all the 13 predictors.
The most frequent 3 predictors selected by our minimalist algorithm during the
10-fold cross-validation are Proteome Analyst, PTS1Prowler, and SherLoc.
We also tested PROlocalizer which is an integration algorithm based mainly on
binary classifiers. However, the server was able to generate prediction results for only
399 out of 1305 proteins in our Human dataset. The overall prediction accuracy of
PROlocalizer on those 399 proteins is 0.81 while the standalone predictor YLoc alone
has an overall accuracy 0.84 on the same dataset. We argue that it is difficult to
construct a reliable protocol-based ensemble algorithm such as PROlocalizer when
Table 2.7: Comparison of the performance of ConLoc and Minimalist LR ensemble algorithm with 13 predictors on the Yeast Low-Res dataset
The best element ConLoc 1LR 2LR
predictor of ConLoc: SherLoc
Cytosol 0.301 0.441 0.489 0.472
Mitochondrion 0.574 0.622 0.708 0.731
Nucleus 0.341 0.461 0.537 0.541
Secretory 0.533 0.537 0.608 0.605
Overall 0.529 0.616 0.696 0.693
Accuracy
1LR ensemble with 13 predictors used in ConLoc
2LR+minimalist algorithm to select K out of 13 predictors in ConLoc, K=4
Table 2.8: Comparison of the performance of ConLoc and Minimalist LR ensemble algorithm with 13 predictors on the Human dataset
The best element ConLoc 1LR 2LR
predictor of ConLoc: Proteome Analyst
Cytosol 0.390 0.414 0.429 0.460
Mitochondrion 0.613 0.628 0.641 0.645
Nucleus 0.463 0.415 0.371 0.392
Secretory 0.754 0.721 0.749 0.758
Overall 0.644 0.664 0.689 0.703
Accuracy
1LR ensemble with 13 predictors used in ConLoc
2LR+minimalist algorithm to select K out of 13 predictors in ConLoc, K=3
of errors along its sequential inference steps. Instead, the machine learning based
ensemble methods can learn complementary rules among the predictors to function
as a “protocol”� to determine protein localization.
2.4 Conclusions
Although many protein localization prediction algorithms have been developed, the
prediction performance remains low and the features used to predict localizations are
variety of features by combining individual predictors. However, combining as many
as possible individual predictors, which is the most common strategy, has the
draw-back of high running complexity and low availability as well as risk of performance
degradation. The result of our minimalist ensemble algorithm showed that it is
pos-sible to significantly reduce the number of individual predictors in a given ensemble
algorithm while maintaining comparable performance. It is also observed that the
best component algorithm set tends to keep predictors with unique features, which
indicates that new features are the key to further improve the prediction accuracy for
localization prediction. The success of our minimalist ensemble algorithm based on
feature selection and logistic regression showed that supervised ensemble algorithms
based on machine learning can effectively capture the complex relationships among
Chapter 3
SeqNLS: Nuclear localization signal prediction based on frequent
pattern mining and linear motif attributes
3.1 Background
A nuclear localization signal is a protein peptide bound to carrier proteins for
traf-ficking nuclear proteins into the nucleus. As the most direct evidence for nuclear
localization, identification of NLSs can help to elucidate protein functions.
How-ever, experimental identification of such signals is costly and currently only a limited
number of NLSs have been identified. It is thus desirable to develop algorithms for
computational prediction of NLSs. Several NLS prediction methods have been
devel-oped such as PSORT II [19], PredictNLS [20], NLStradamus [21], cNLS Mapper [22],
and NucImport [23]. PSORT II predicts NLSs based on sequence patterns
imple-mented as three simple rules according to the classification of NLSs [24]; the rules are
mainly clusters of basic amino acids K and R and gaps between the clusters.
Pre-dictNLS predicts NLSs based on 194 potential NLS motifs, which are derived from
114 experimentally verified NLSs with a silico mutagenesis approach. Nguyen Ba et.
al. [21] found that NLSs tend to have similar residue frequency distributions which
are different from that of background residues. Their NLStradamus algorithm detects
NLSs by using a simple two-state or four-state HMMs to accommodate the frequency
variations. cNLS Mapper estimates classical NLS (cNLS) functionality of a peptide
ac-cording to the activity-based profiles, which are obtained from the systematic amino
acid-replacement analyses in budding yeast. NucImport builds a Bayesian network to
predict nuclear localization by incorporating various attributes related to the nuclear
importing. If a protein is predicted as a nuclear protein, the location of its NLS is
predicted as the segment in the protein with the highest cNLS score in the inferred
cNLS class based on the dependencies with other attributes in the Bayesian network.
These five NLS prediction methods have achieved different degrees of success.
However, their prediction performance is still far from being sufficient to assist
bi-ologists to discover putative NLSs in protein sequences of interest. Each of them
has their weakness. Although a great portion of NLSs can be covered by the rules
used in PSORT II to detect NLS, quite a few patterns covered by the rules exist
in peptides which do not contain NLSs, leading to a high false positive rate or low
prediction precision. The sensitivity of the PredictNLS algorithm depends on the
number of NLS motifs it used, which has been extended by introducing the
poten-tial NLS motifs generated using in-silico mutagenesis analysis. But they are still too
specific and couldn’t effectively accommodate NLS variability [21]. The performance
of the NLStradamus algorithm depends on its assumption that NLSs have certain
residue distributions. However, many NLS instances in our testing datasets have
shown very different residue frequencies. Both cNLS mapper and NucImport
algo-rithms are developed based on the characteristics of cNLS. However, approximately
43% of proteins localized to the nucleus may use other transport mechanisms other
than the classical nuclear import pathway according to Lange et al [25].
One of the challenges of NLS prediction is that functional NLSs are not
de-fined [70]. Many NLSs are short peptides that occur regularly in non-nuclear proteins.
In fact, NLS is one type of linear motifs as defined in the database of eukaryotic linear
motifs [71]. Linear motifs are short stretches of residues which are highly involved in
certain characteristics of linear motifs have thus evolved and might have contributed
to NLS variability: only a few residues within a linear motif are functionally
impor-tant, and mutation of a single residue can switch on/off the functionality [72, 73].
The nature of shortness, flexibility and sensibility provides linear motifs
evolution-ary plasticity to form a functional unit and fine-tune cell singling network over short
evolutionary distances, which, however, increases the difficulties in computational
identification of linear motifs such as NLSs.
In the past decade, many computational approaches have been proposed to
dis-cover linear motifs. There are two categories of the methods [72]: one is
super-vised methods aiming to identify new instances of known linear motifs in protein
sequences [71, 74–80]; the other is de novo methods for discovering new linear
mo-tifs [81–84]. The challenge of the former is to discriminate between true and false
positive matches. Most of such prediction algorithms take advantage of the
spe-cial attributes of linear motifs [85] to remove false positive matches that are
un-likely to be functional linear motifs. The latter de novo linear motif discovery
algo-rithms [81, 82, 84] are usually based on the enrichment analysis of candidate motifs
integrated with disorder prediction and evolutionary conservation. Since NLS is one
type of linear motifs, the framework of the first category may apply to predicting
NLSs. However, despite the availability of a number of NLS motifs [86, 87], they are
either too specific [21] or they only target a specific pathway of NLSs. To cover more
NLSs, we need a new approach to utilize linear motif attributes.
In this chapter, we propose a novel algorithm for NLS prediction based on
sequential-pattern mining and linear motif scoring. Our strategy is first to detect potential NLS
candidates using the sequential-pattern mining method, which are then scored in
terms of their likelihood of being (part of) NLS based on their sequence and
lin-ear motif features. The qualified candidate motifs will then be combined into NLS
3.2 Materials and Methods
3.2.1 Training and Testing dataset
We used 114 experimentally determined NLSs from NLSdb [86] as the source of the
positive training dataset for sequential pattern mining. Two NLSs without a specific
form in amino acid sequence and a reference citation were removed. 94 out of 112
were real NLSs of which the parent proteins could be found, while the rest 18 were
either synthetic NLSs or NLSs of which the parent proteins couldn’t be found. We
then removed the redundant NLSs in order to avoid non-functional residues being
enriched in the positive training dataset: given a NLS A, the redundant NLSs to A
are defined as NLSs whose parent proteins are highly homologous to the parent protein
of NLS A and are overlapped with NLS A in the alignment of their parent proteins.
To remove redundant NLSs, Blastclust with 90% sequence identity and 90% sequence
coverage was applied on the parent proteins of the 94 NLSs. If multiple NLSs were
overlapped in the alignment of their parent proteins which were in the same cluster,
then only one of the NLSs was kept; 4 out of the 94 NLSs were thus removed. In
the end, 108 experimentally verified NLSs were left in our positive training dataset
for sequential-pattern mining. We then collected 2238 non-nuclear proteins from the
BaCello dataset [59], from which 26772 non-overlapped peptides of length 40 were
randomly sampled for the negative training dataset for sequential-pattern mining.
The length 40 was determined because it approximated the longest NLSs in the
positive training dataset. To prepare the training dataset for linear motif scoring
(to be defined below), the 90 NLSs with known parent proteins used in the training
dataset of sequential-pattern mining were used as the positive training dataset. For
each of the 90 NLSs, a random amino acid segment of the same length in the same
parent protein which was not overlapped with any annotated NLS was collected to