University of South Carolina
Scholar Commons
Theses and Dissertations
1-1-2013
The Effect of Cancer Cachexia Severity and
Eccentric Muscle Contractions on Selected
Myofiber Metabolic Properties in Mouse Skeletal
Muscle
Joshua Earl Mangum
University of South Carolina - Columbia
Follow this and additional works at:https://scholarcommons.sc.edu/etd
Part of theExercise Science Commons, and theMedicine and Health Sciences Commons
This Open Access Thesis is brought to you by Scholar Commons. It has been accepted for inclusion in Theses and Dissertations by an authorized administrator of Scholar Commons. For more information, please [email protected].
Recommended Citation
T
HEE
FFECT OFC
ANCERC
ACHEXIAS
EVERITY ANDE
CCENTRICM
USCLEC
ONTRACTIONS ONS
ELECTEDM
YOFIBERM
ETABOLICP
ROPERTIES INM
OUSES
KELETALM
USCLEby
Joshua Mangum
Bachelor of Arts
University of South Carolina, 2009
Submitted in Partial Fulfillment of the Requirements
For the Degree of Master of Science in
Exercise Science
The Norman J. Arnold School of Public Health
University of South Carolina
2013
Accepted by:
James Carson, Director of Thesis
Raymond Thompson, Reader
Raja Fayad, Reader
ii
iii
A
BSTRACTCancer cachexia is a complex syndrome that induces skeletal muscle wasting and
dysregulation of skeletal muscle metabolism. Alterations in area of myofibers and
myofiber metabolic properties can significantly impact the function of skeletal muscle.
The purpose of this study was to examine the effect of cachexia severity and resistance
exercise training on frequency and area of selected myofiber metabolic characteristics
during cachexia-induced myofiber atrophy. Male ApcMin/+ (Min) mice were studied
during the progression of cachexia (16-20 weeks of age) and stratified into groups based
on the severity of cachexia. For the second study, male Min mice performed resistance
exercise (RE) for 7 sessions over 2 weeks during the initiation of cachexia. Myofiber
area and myofiber metabolic properties were examined through histological analysis
(H&E, SDH, and PAS) in the tibialis anterior (TA) muscle. Cachexia severity
progressively decreased TA cross-sectional area and frequency of high SDH activity
(OX) fibers however there was also a progressive increased frequency of high glycogen
content (HG) fibers. Regardless of SDH activity, myofiber area was decreased with
cachexia. In cachectic mice, RE increased high SDH activity fiber frequency and
selectively induced hypertrophy of low SDH activity (GL) fibers, however there were no
changes in frequency of high glycogen content fiber with RE. These results demonstrate
that during the progression of cancer cachexia, there is progressive myofiber atrophy
iv
of HG fibers. RE is able to increase frequency of OX fibers and induce hypertrophy of
v
T
ABLE OFC
ONTENTSACKNOWLEDGEMENTS ... iii
ABSTRACT ... iv
LIST OF TABLES ... vii
LIST OF FIGURES ... viii
CHAPTER 1:INTRODUCTION ...1
SPECIFIC AIMS ...7
CHAPTER 2:REVIEW OF LITERATURE ...8
CHAPTER 3: THE EFFECT OF CACHEXIA SEVERITY ON SELECTED MYOFIBER METABOLIC PROPERTIES IN MOUSE SKELETAL MUSCLE ...30
CHAPTER 4:THE EFFECT OF ECCENTRIC CONTRACTIONS ON SELECTED MYOFIBER METABOLIC PROPERTIES IN MOUSE SKELETAL MUSCLE ...61
CHAPTER 5:OVERALL DISCUSSION ...89
vi
L
IST OFT
ABLESTable 3.1 Body weight change, tibia length, muscle and epididymal
fat pad weights in 20-week-old male wild-type and ApcMin/+ mice ...47
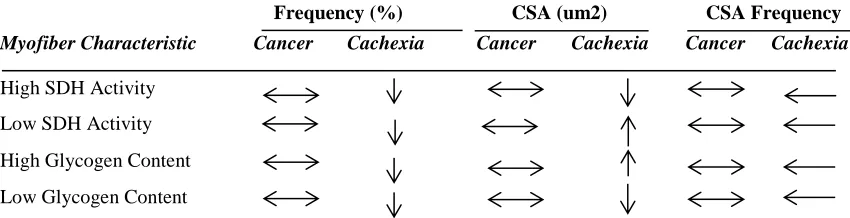
Table 3.2 Summary table of alterations in myofiber area and myofiber
metabolic properties in ApcMin/+ mice ...48
Table 4.1 Body weight change, tibia length, TA muscle weight in wild-type and ApcMin/+ mice ...77
vii
L
IST OFF
IGURESFigure 3.1 Tibialis Anterior (TA) myofiber area in wild-type and ApcMin/+ mice ...52
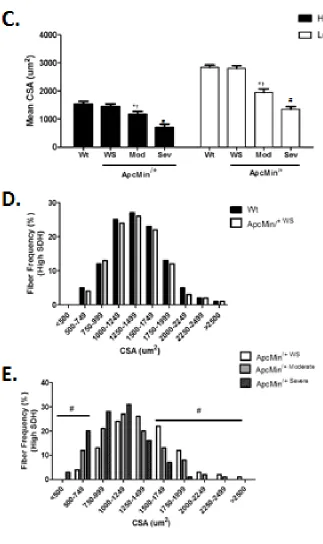
Figure 3.2 Frequency and size of high and low SDH activity myofibers in the TA of wild-type and ApcMin/+ mice ...54
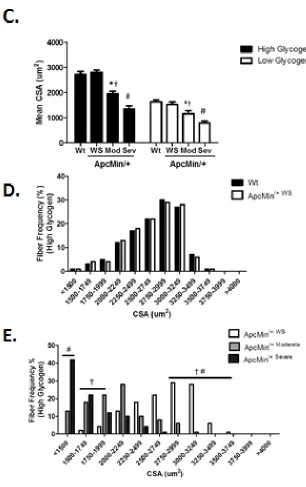
Figure 3.4 Frequency and size of high and low glycogen content myofibers in the TA of wild-type and ApcMin/+ mice ...57
Figure 3.4 Relationship between frequency and size of myofiber metabolic properties with moderate and severe cachexia ...60
Figure 4.1. Experimental design for resistance exercise training protocol ...81
Figure 4.2 Tibialis Anterior (TA) mass difference between exercise and control in wild-type and ApcMin/+ mice ...82
Figure 4.3 Tibialis Anterior (TA) myofiber area in wild-type and ApcMin/+ mice
with resistance exercise training ...83
Figure 4.4 Frequency and size of high and low SDH activity myofibers in wild-type and ApcMin/+ mice with resistance exercise training ...85
1
CHAPTER
1
I
NTRODUCTIONAccording to recently published data from the CDC and NIH, cancer is ranked as
the second-leading cause of death in the United States (1). NIH data indicates that the
new case diagnosis incidence rate per year from 2004-2008 for cancer was 553.0/100,000
and in 2012 it is estimated that cancer deaths in the United States were approximately
577,190 (1). The NIH estimates that over-all costs of cancer in 2007 were 226.8 billion
dollars with over half of that being direct medical costs and the other being related to
indirect mortality costs (1). Prostate, lung and colon/rectum are the three most prevalent
cancer types among men and breast, lung and colon/rectum are the three most prevalent
cancer types for women (1). Cachexia is a condition often seen during the progression of
cancer, which involves the unintentional loss of body weight from the wasting/atrophy of
both skeletal muscle and adipose tissue (3). Cachexia is estimated to be present in 80% of
advanced cancer patients and can be directly attributed to 20-40% of cancer related
deaths (4). The causes of cancer cachexia are not fully understood however increased
levels of inflammatory cytokines such as TNF-alpha, interferon-y and IL-6 are thought to
have a role. Inflammation during cachexia has a significant negative effect on skeletal
muscle (4, 5, 6), however, there are still questions relating to development of these
changes in skeletal muscle that have not yet been answered. During the progression of
cancer cachexia, there is a disruption in skeletal muscle structure, function and metabolic
1
Skeletal muscle is composed of three different fiber types: Type I
(slow-oxidative), Type IIa (fast-oxidative) and Type IIb (fast-glycolytic) fibers and all of these
fibers are characterized by specific metabolic properties as reflected by their intracellular
enzyme activity patterns (7). Type I and Type II can be classified independently of
myofibrillar ATPase enzyme activity, as Type I are solely oxidative, while Type II can
range from oxidative-glycolytic to primarily glycolytic. A critical component of each
muscle fiber are the mitochondria, which have a role in energy production, apoptotic
properties and overall the energy demands of the cell and are directly related to oxidative
capacity (8). Type I fibers have very high mitochondrial density while Type II-a fibers
have less and Type II-b have even less mitochondria. With higher mitochondrial
density, Type I fibers have much greater oxidative capacity than that of Type II fibers.
Muscle mitochondrial content is significantly decreased in wasting conditions associated
with heart disease, COPD and cancer cachexia, additionally Type II fibers are more
susceptible to cachexia and have greater losses in morphology and overall oxidative
capacity than that of Type I (9, 10). More specifically, gastrocnemius and soleus muscle
oxidative capacity, when measured through multiple techniques such as COX IV
expression and SDH enzymatic activity staining, is negatively affected by cancer
cachexia in ApcMin/+ mice, a mouse model of colorectal cancer (8). While there are
reductions in oxidative capacity during the progression of cancer cachexia, the
mechanisms behind this change in oxidative capacity have yet to be examined. A
potential relationship to this reduction in oxidative capacity and mitochondrial
dysfunction could be linked to changes in intramuscular energy stores/metabolism and
2
Glycogen and lipid can both serve as energy stores in skeletal muscle and vary
depending on muscle fiber type. Most endogenous fat is stored as triacylglycerol in both
subcutaneous and deep adipose tissue, however smaller amounts are deposited in skeletal
muscle fibers (intramuscular triacylglycerol – IMTG) and can be used as a substrate
source during exercise (11). Electron microscopic analysis of skeletal muscle has shown
that intramyocellular lipid droplets are located adjacent to the muscle mitochondria,
implying that these IMTG stores function as a readily available source of fatty acids for
oxidative purposes (12). Several studies have reported greater IMTG content in Type I
fibers than Type II fibers, indicating that greater fat oxidative capacity in Type I fibers is
associated with greater IMTG storage (12,13). These fatty acids are utilized in
beta-oxidation in which the fatty acids are broken down in the mitochondria to generate
acetyl-CoA for entry into the citric acid cycle for the production of ATP (14).
Carbohydrates can also serve as an intramuscular energy store during rest and exercise,
stored as intramuscular glycogen (15). Studies have demonstrated as exercise intensity
increases, carbohydrate oxidation increases while the oxidation of lipids decreases due to
factors such as: limited rate of mitochondrial fat oxidation, abundance of glycolytic
enzymes and a shift to fast glycolytic muscle fibers at high exercise intensities (15).
Intramuscular glycogen stores can be increased directly by dietary carbohydrate intake
known as “glycogen loading” and also have been observed to be increased as an exercise
training adaptation (16). Glycogen can be utilized through glycogenolysis producing
glucose-1-phosphate which enters to the glycolytic pathways, converted to pyruvate
which then can be utilized in the mitochondria (14). Several studies have also shown that
3
glycogen content are found in Type II fibers, even more in Type IIB (17). While the
initial stage of glycolysis occurs in the cytosol, later stages with end products of
glycolysis utilize the mitochondria for energy production from glycogen stores (14).
Resistance exercise training has been shown to have beneficial effects such as
mitochondrial biogenesis, with increased oxidative capacity through increased activity of
citrate synthase and succinate dehydrogenase (18). Resistance exercise is also known to
induce hypertrophy of skeletal muscle, however less is known of the response of
cachectic skeletal muscle to resistance exercise. Resistance exercise induces hypertrophy
of myofibers, while glycolytic myofibers tend to have the greater hypertrophy as
compared to oxidative myofibers with resistance exercise training. In regards to
previous research, only one published study has examined the effect of cancer cachexia
progression and changes in intramyocellular lipids and reported a significant increase
with the progression of cachexia severity (19), however no studies have examined the
effect of eccentric-induced hypertrophy in skeletal muscle on myofiber metabolic
properties. Intramuscular glycogen and lipid stores have a significant role in the energy
demands and oxidative capacity of skeletal muscle and while it has been established that
oxidative capacity is significantly reduced during the progression of cancer cachexia,
alterations in oxidative myofiber morphology and alterations in glycogen storage have
yet to be examined. Also it is not known if resistance exercise training can alter these
metabolic properties or morphology during cachexia.
Research has shown that cancer cachexia progression has numerous detrimental
systemic effects that can disrupt skeletal muscle. Our lab has demonstrated that with
4
to be greatly reduced in cachectic skeletal muscle, this has not been further extended to
examine the effect of cachexia severity . Our lab has established that in the ApcMin/+
mouse there is myofiber degeneration/regeneration (20), a hyperactivation of Akt and
pAMPK as well as a downregulation of p-mTOR (5). Risson et al. (21) found that in
their mTOR muscle specific KO model there is a hyperactivation of Akt, GSK3B and
downregulation of pmTOR and this was accompanied with myofiber atrophy and a loss
of oxidative capacity (21), similar conditions observed in our ApcMin/+ model.
Interestingly, they found that in the presence of these conditions, intramuscular glycogen
significantly increased. The conditions are very similar to our model and warrant the
further investigation of these variables in our model. To our knowledge, no studies have
examined any alterations in the metabolic properties such as frequency and size of SDH
activity myofibers and high and low glycogen content myofibers during the progression
of cancer cachexia. Also, while exercise through treadmill running has been utilized in
the ApcMin/+ mouse model suppressing IL-6 induced wasting, resistance exercise training
using electrical stimulation bouts has not been examined as an intervention in cancer
cachexia related to myofiber size, and frequency and size of SDH activity myofibers and
high and low glycogen content myofibers. There are critical clinical implications that are
being examined in this study in relation to how metabolic properties in skeletal muscle
are affected during cancer cachexia and if changes can be made to selected myofiber
metabolic properties with the intervention of resistance exercise. The proposed study’s
overall purpose is to examine the effect of cachexia severity and resistance exercise
training on frequency and area of selected myofiber metabolic characteristics during
5
induce myofiber atrophy and there will be a reduction in frequency and area of high SDH
activity myofibers and an increase in the frequency of high glycogen content fibers and
resistance exercise will attenuate the loss of low SDH activity myofiber CSA and
6
SPECIFIC AIMS
Aim 1. To determine the effect of cachexia severity on frequency and area of high and
low SDH activity fibers and high and low glycogen content fibers during
cachexia-induced myofiber atrophy
Aim 2. To determine the effect of resistance exercise training on frequency and size
of high and low SDH activity fibers and high and low glycogen content fibers during
the initiation of cancer cachexia.
With respect to expected outcomes, experiments in Aim 1 will establish if severity
of cachexia affects overall myofiber area and frequency and size of both high and low
SDH activity myofibers and high and low glycogen content myofibers. Aim 2 will
establish if resistance exercise during the initiation of cachexia will induce hypertrophy
and if there is a relationship in frequency and size of SDH activity myofibers and
glycogen content myofibers in conjunction with this hypertrophy. Overall, we expect to
find progressive decreases in frequency and area of high SDH activity myofibers and
increases in high glycogen content myofibers related to the atrophy with severity of
cachexia. Also, we expect to find that the intervention of resistance exercise will
increase mean myofiber area and increase the frequency of high SDH activity
myofibers, inducing hypertrophy in low SDH activity and high glycogen content
7
CHAPTER 2
Review of Literature
Cancer is a disease that affects millions across the world each year and still ranks
as the number two cause of death in America (1). While many underlying mechanisms
are understood regarding cancer and its effects during the progression, there are still
many unanswered questions as well. Cachexia is a condition often seen with cancer
which can lead to wasting of both muscle and adipose tissue. Some of the effects
associated with skeletal muscle mass loss during cachexia include a loss of contractile
proteins, decreased myofiber area and overall reduction in muscle weight (3). One of the
negative effects on skeletal muscle that has been examined is the loss of oxidative
capacity which is directly related to mitochondria and energy production, particularly in
slow oxidative fibers. Intramuscular energy stores, glycogen and lipids, have been
shown to have significant links to the oxidative capacity in skeletal muscle. T readmill
training has been established as a positive influence on oxidative capacity in skeletal
muscle during the progression of cancer cachexia, there are still gaps in the role of
resistance exercise on oxidative capacity and other metabolic changes during the
progression of cancer cachexia. The literature review for this Master’s Thesis is
stratified into 3 sections: (1) Cachexia overview and systemic effects, (2) Skeletal
muscle structure, metabolic properties and the effect of cancer cachexia, and (3) Exercise
8
review will give a general overview of cancer cachexia and the overall systemic effects.
The specific effects of the progression of cancer cachexia in skeletal muscle will also be
discussed, particularly in the ApcMin/+ model which is being used for this study. Since
the progression of cancer cachexia negatively impacts skeletal muscle, this review will
examine the changes in skeletal muscle. This review will focus on skeletal muscle
structure and metabolic properties in different types of skeletal muscle and changes that
occur during cancer cachexia. Finally this review will focus on exercise, both aerobic
and resistance exercise on its influence on healthy and cachectic systemic variables and
skeletal muscle specifically. Since resistance exercise is a specific aim of this study,
more focus will be on resistance exercise than aerobic.
1. Cachexia and Mechanisms
While there are different types of atrophy that can affect skeletal muscle and adipose
tissue, cachexia encompasses and can negatively affect both. The changes during the
progression of cancer cachexia are a major part of this research so understanding what is
known and not known during the progression is essential. The purpose of this section of
the review of literature is to clearly define cachexia and describe the systemic changes
and possible mechanisms of atrophy including changes in protein synthesis and
degradation as well as the possible role of inflammatory cytokines.
Cachexia. Cachexia derives from the Greek word “kakos” which translates to bad and
“hexis” which means condition (22). It affects nearly 80% of diagnosed cancer patients
and patients of other diseases as well. Cachexia has been shown to occur in acquired
immunodeficiency syndrome (AIDS), major trauma, severe sepsis and many others {4}.
9
derives from depletion of both adipose tissue and skeletal muscle mass as well.
Cachexia should not be confused with starvation which also exhibits a decrease in body
weight however these conditions differ in multiple facets. These conditions differ in the
fact that during starvation there is increased glucose production from the liver through
gluconeogenesis (production of glucose from alternative sources such as amino acids)
and during long- term starvation most fuel is derived from free fatty acids released from
adipose tissue which ultimately results in a conservation of muscle mass (19). However,
in cachexia there is an equal loss of adipose tissue and skeletal muscle mass, often times
with greater decreases found in skeletal muscle mass (4). The body composition
changes are dramatically different during the progression of cancer cachexia in that
body composition changes can often be reversed in simple starvation with the addition
of extra calories where this is not seen in patients with cancer cachexia (23). A
prospective randomized study examined the effects of frequent nutritional counseling in
chemotherapy cancer patients with the significant addition of calories and protein into
the diet with a control that had no counseling or change in diet. It was found that quality
of life and response rate to the addition of calories was not different as compared to the
control group (24).
Energy Metabolism. While resting energy expenditure (REE) can attribute to nearly of
70% of sedentary total energy expenditure, this can become altered during the
progression of cancer cachexia (25). Resting energy expenditure is often increased in
cancer patients, however studies have shown that this may vary depending on the type of
tumor. While no increases were seen in resting energy expenditure in colorectal cancer
10
cancer patients (25, 26). One of the links from changes in resting energy expenditure to
inflammation could arise from changes in protein synthesis in the liver. Elevated acute
phase response (APR) are defined as changes in liver protein synthesis which changes
the production of albumin to inflammatory markers such as CRP, fibrinogen and others
(27). There seems to be an association with elevated REE and elevated APR in response
which leads to increased levels of acute phase proteins which has been associated with
shorter survival times in cancer patients. Increased REE during cancer cachexia could
also be attributed to increased thermogenesis in skeletal muscle. Uncoupling protein 3
(UCP3), which is found in adipose and skeletal muscle (28), has been found to be
significantly elevated in cancer patients, particular those experiencing great weight loss
(29). There has been a suggestion that this increase in UCP3 mRNA can contribute to
the increased resting energy expenditure and be related to the overall tissue catabolism,
particularly skeletal muscle that is present during the progression of cancer cachexia.
Alterations in Protein Synthesis. Cachexia estimates for 20-35% of cancer related
deaths (30) and the loss of skeletal muscle in cancer cachexia patients has been linked to
reduced survival rates due to further complications in respiratory muscles and other
skeletal muscle dysfunction (31, 32). A contributing factor to the loss in skeletal muscle
mass is decreased levels of protein synthesis and increases in protein degradation.
Lundholm et.al (33) showed in a larger study of cancer patients, when matched with
controls, the cancer patients had significant decreases in protein synthesis rates and
increased fractional degradation rate of proteins. During the progression of cancer
cachexia while there is typically a reduction in protein synthesis rates and this has been
11
otherwise. In an animal model where there were no significant changes in food
consumption, a depressed protein synthesis rate and increased protein degradation rate
was still present (34). This indicates that the protein synthesis rate is affected not only
by energy intake and expenditure, however there is an alteration in underlying
mechanisms. eIF2a is a translation initiating factor in protein synthesis (35) and has
been suggested as a possible altered mechanism in the changes in protein synthesis. A
linear relationship between the phosphorylation of PKR which led to a phosphorylation
of eIF2a was observed in cancer patients as compared to controls which could be
responsible for the loss in myofibrillar proteins (36). Eley et.al (37) also noted in a
different study that there was hypophosphorylation of 4E-BP1, another translation factor
with increases in eEF2 leading to decreased translation elongation negatively affecting
protein synthesis rates. While the loss in muscle mass and loss of myofibrils during the
progression of cancer cachexia can be due to reductions in protein synthesis rates,
increases in protein degradation rates also are responsible.
Alterations in Protein Degradation. While alterations in protein synthesis have been
attributed to cachexia during the progression of cancer, alterations in protein degradation
also coincide with these which lead to detrimental effects. While there are multiple
proteolytic pathways for the degradation of proteins in skeletal muscle, the
ubiquitin-proteasome pathway has been the most researched. Khal et al (38) found in cachectic
cancer patients with weight loss greater than 10% that the ubiquitin-proteasome pathway
was most responsible for the degradation of proteins in skeletal muscle. One of the
major contributing factors to the increase in ubiquitin-proteasome activity is an increase
12
observed to lead to increased rates of proteolytic protein degradation via the
ubiquitin-proteasome with formation of reactive oxygen species and upregulation of Nf- kB
(40,41). This upregulation of NF-kB led to an increased production of other
inflammatory cytokines and increased breakdown of myofibrillar proteins (42). Studies
have suggested that these increased protein degradation rates through the
ubiquitin-proteosome pathway are partly responsible for the increased REE due to the requirement
of ATP in the proteolytic process (43). However, for lower weight loss patients, muscle
biopsies in some studies have shown that the ubiquitin-proteosome pathway was
unchanged and the loss was responsible from expression of mRNA for cathepsin B (44).
While other myofibrillar proteins do not seem changed, myosin heavy chain (MHC)
seem to be the greatest affected by the increase in the ubiquitin-proteosome activity
during the progression of cancer cachexia, which with the decrease in protein synthesis
leads to the skeletal muscle mass loss observed {16}.
The Role of IL-6. Interleukin-6 is a cytokine that has both pro-inflammatory and
anti-inflammatory characteristics (45). IL-6 is associated with chronic inflammation as IL-6
is necessary for the induction of Th17 cells, which are a subset of T helper cells (46).
Studies have shown elevated IL-6 levels in the blood and within the tumors in cancer
patients with various types of cancer including breast, colorectal, pancreatic and many
others (47, 48). Knupfer and Preiss (49) noted a distinct association between IL- 6
levels and tumor stage, size and survival rate. Becker et. al (50) found that IL-6 was
critical in the development colitis-associated cancer and growth of intestinal tumors
which could lead to activation of STAT3 as a downstream effect. IL-6 -/- mice in a
13
described a critical role of STAT3 activation though elevation of IL-6 for the
proliferation and apoptosis observed. IL-6 has also been linked to the increased
expression of VEGFR2, which contributes to vasculogenesis and angiogenesis, which
then promotes proliferation of cancerous tumor cells in the colitis cancer model (52).
IL-6 also can contribute to other types of cancer as Gao et. al (53) showed that there is
possible involvement in an IL-6/STAT3 signaling cascade in the proliferation of
adenocarcinomas and tumorigenesis in the lungs. Sansone et.al (54) also found a critical
role of IL-6/Stat3 activation and interaction in the development of tumors in breast
cancer. Downstream STAT3 activation via IL-6 expression has been shown to regulate
tumorigenesis in multiple lines of cancer, demonstrating a critical dependent role for IL-
6 during the development of cancer.
Proteolysis-inducing factor. Proteolysis-inducing factor (PIF) is a glycoprotein
produced by tumors and leads to decreases in protein synthesis and increases in protein
degradation (55). PIF has been detected in the urine of cachectic cancer patients of
multiple cancer lines however was not observed in weight-stable cachectic patients (56).
Some studies have shown specific PIF excretion in the urine related to the weight loss in
cachectic patients with prostatic and gastrointestinal tumors (57) however other studies
have disputed the significance of PIF in the weight loss of other cachectic patients (58).
Williams et. al (59) performed a longer study of PIF excretion during weight loss,
noting the majority of changes in PIF status were negative to positive. There seems to
be a dispute in the literature regarding the role and importance of PIF during the
development of cancer cachexia, however PIF does seem to have significance in the
14
cachexia. PIF is unlike cytokines as it is able to induce protein degradation in isolated
skeletal muscle and also can lead to cachexia in non-tumor-bearing mice without
changes in dietary intake (60). Interestingly, Todorov et. al (61) showed that PIF
produced overall body weight loss in mice, specifically in non-fat mass without decrease
in food intake. In this particular study, PIF was also observed to increase mRNA levels
of ubiquitin and other proteasome subunits in skeletal muscle, suggesting a significant
role in the previously mentioned ubiquitin-proteasome pathway of protein degradation.
In isolated myotubes, muscle atrophy was observed via PIF as it was shown to decrease
protein synthesis while increasing protein degradation. In this same study, the PIF was
shown to have no significant effect on actin however there was a depletion of myosin
(61). While an increase in proteasome activity is observed in cachectic patients
particularly by PIF, PIF has been shown to also increase TPPII. TPPII is tripeptidyl
peptidase II which is part of the downstream proteolytic cascade of the
ubiquitin-proteasome pathway (62). Both the separate ubiquitin-proteasome units and the increase in TPPII
by PIF have been suggested to be related to a link in activation of NFkB.
NF-kB. nuclear factor kB, NF-kB, also seems have a significant role in the
ubiquitin-proteasome pathway. NF-kB is suggested to be activated in response to PIF in which
the ubiquitin-proteasome pathway is further induced (63), leading to greater protein
degradation associated with the loss during cancer cachexia. Cai et. al (64), showed the
link of IKKB/NF-kB to the induction of ubiquitin-proteasome pathway which resulted in
very high levels of muscle wasting that were very similar to cachexia. Grannerman et. al
(65) demonstrated that this activation of NF-kB also suppressed mRNA for MyoD, a
15
Expression of MuRF1 and other subunits of the proteasome are also elevated due to
activation of NF-kB leading to muscle loss as well (65). Resveratrol confirmed the
activation of NF-kB to muscle wasting during the progression of cancer cachexia. Wyke
et. al (66) showed that resveratrol, which inhibits the activation of NFkB through other
targets, significantly attenuate the weight loss and protein degradation via the ubiquitin-
proteasome pathway in MAC16 tumor bearing mice. The formation of reactive oxygen
species via the activation of NF-kB by PIF has also been suggested as a link to the
skeletal muscle atrophy observed during the progression of cancer cachexia (67). IL-6
production from the activation of NF-kB also results in the proliferation of the STAT3
pathway which then leads to the increase in survival genes which then leads to the
production of other inflammatory cytokines (68). Thus, NF-kB in conjunction with
other factors play a significant role in the chronic inflammation and skeletal muscle
mass loss observed in cachectic cancer patients. While NF-kB and IL-6 seem to target
skeletal muscle specifically, there are cytokines such as TNF-a, which target adipose
tissue during the progression of cancer cachexia.
TNF-a. Tumor necrosis factor alpha (TNF-α) is another cytokine that has a critical role
in systemic inflammation during an acute phase reaction (69). While the definitive role
of TNF-a in the induction and progression of cancer cachexia still remains controversial,
some studies have attempted to define a role for TNF-a in cachexia. It is known that
individual variations in the TNF-a levels can attribute to polymorphisms, particular in
the A allele in the promoter region of the TNF gene (70). This variation can lead to
other downstream effects such as higher TNF-a transcription levels and an increased
16
development of cancer are not as consistent (73). Mader et. al (74) found that there was
no correlation between TNF-a levels and weight loss in cancer patients. However,
Karayiannakis et al.(75) observed that the levels of TNF-a in cancer patients was
inversely correlated with body weight and body mass index. While evidence shows that
TNF-a can induce lipid depletion in adipose tissue through various mechanisms (76, 77,
78), a true correlation linking TNF-a to the progression of cancer cachexia has yet to be
established and needs to be examined further. While numerous factors may affect the
inability to provide a direct link of TNF-a to degree of body weight loss, it seems that it
is more likely that TNF-a levels coincide with tumor size and development (4). While
individual alterations in cytokine levels and protein synthesis/degradation have a role in
the progression of cancer cachexia, the culmination of all these factors can greatly affect
multiple variables in cachectic patients.
Systemic Effects/ Quality of Life. While numerous specific effects from overexpression
of cytokines and alterations in certain pathways have been suggested as causation for the
reduction in skeletal muscle mass during cachexia, the culmination of all of these effects
can lead to overall changes in systemic variables for cachectic cancer patients. Cachexia
has been implicated as one of the most important factors in survival rates and quality of
living for cancer patients (79). DeWys et. al (80) performed a retrospective evaluation of
over 3000 cancer patients with differing types of cancer tumor types.
While moderate to severe weight loss was seen in 30-70% of patients, this wide range
can be attributed to multiple variables such as tumor site, size, type etc. Interestingly,
they found that there was a lower risk of weight loss in the breast and hematological
17
to lose 10% or more of their typical body weight. Buccheri and Ferrigo found that total
weight loss was the best indicator of prognosis in 388 cases (81). There also seems to be
a significant correlation of overall body weight change and survival. Hess et al (82)
observed ovarian cancer patients and found that the risk of death increased by 7% for
each 5% drop in body weight. It was also found that patients with the highest rate of
weight loss had a median survival rate of 7.5 months while patients with low rates of
weight loss had an average survival of 30.2 months (83). While changes in protein
synthesis and degradation rates along with inflammatory cytokines have been linked to
this weight loss, other variables also can contribute. Andreyev et al. (84) recorded data
from over 1500 patients receiving surgical and chemotherapeutic treatments. This
group observed that patients with greater weight loss had lower chemotherapy doses.
This weight loss was correlated with other variables including overall survival rates and
quality of life. Quality of life is a variable that is often affected by the progression of
cancer cachexia. Unlike other measurements, quality of life is a subjective measurement
assessed by every individual, however strong correlations are observed in quality of life
in cachectic cancer patients. As the progression of cancer continues, measurements of
quality of life have been shown to decrease in many patients (85). Since many of the
measurements for quality of life are subjective, they include ratings of measurements
such as fatigue, depression and other aspects of quality of life. Multiple studies have
associated quality of life with management and survival rates during the progression of
cancer cachexia. Definitions slightly vary from past studies, however current studies
typically define quality of life as an individuals perceived physical, mental and social
18
types of cancer. Coates et al. (86) found that overall quality of life and social
functioning were significantly predictive of survival in cancer patients and Dancey et al
(87) observed that overall quality of life was significantly associated with survival.
Langendijk et al (88) found that in 198 lung cancer patients, overall quality of life was a
strong prognostic factor in the survival rate. While quality of life is a subjective
measurement in the progression of cancer cachexia, it is a strong indicator of the
negative systemic effects of cachexia.
2. Skeletal Muscle (Structure, Metabolic Properties and Effect of Cachexia)
While the progression of cancer cachexia affects both adipose and skeletal muscle
tissue, the aim of this particular research is its effect on skeletal muscle. There are
different distinctions between types of skeletal muscle which will be examined in this
particular part of the literature review. One of the metabolic properties of skeletal
muscle that is being investigated is oxidative capacity. There is extensive research and
literature regarding oxidative capacity in healthy skeletal muscle and changes during the
progression of cancer cachexia. One of the variables of both of the aims is to examine
any possible changes in intramuscular glycogen stores. While much is known of this
and other intramuscular energy stores in healthy skeletal muscle, the research is more
limited in diseased muscle.
Phenotypes. There are 3 muscle types in humans: skeletal, cardiac and smooth muscle.
While these three types share some similarities, their differences vary depending upon
multiple factors. In skeletal muscle there are 3 primary fiber types: Type I, Type IIA
and Type IIB (89). These fiber types vary depending upon multiple differences in
19
oxidative, Type IIA fibers are fast oxidative and Type IIB are fast glycolytic. While
Type I fibers only use oxidative capacity for generation of force production, Type II
fibers can vary from oxidative to glycolytic depending upon sub-classification (90).
Type I fibers typically have large amounts of mitochondria which are responsible for the
increased oxidative capacity. Type IIA fibers also contain a significant number of
mitochondria, however they are much less than that of Type I fibers. Type IIB store
more glycogen than any other fiber type and have the lowest amount of mitochondria
present (91). While Type I fibers have a slower contraction velocity than other fiber
types, these are much more efficient in steady-state long time activities such as long
distance running (91). Type IIA fibers have a much higher contraction velocity and are
more useful in shorter activities than that of Type I fibers such as middle distance
running. Type IIB fibers have the greatest contraction velocity as ATP are split very
quickly however these fibers fatigue very fast and easily, therefore they are primary
fiber types that are used in very short distance activities such as sprinting (90). While
muscle fiber type shifts have been observed in sedentary and active individuals,
phenotype shifts have been observed in diseased patients, specifically cachexia.
Muscle Phenotype Shift/Loss During Cancer Cachexia. Certain muscles, such as the
gastrocnemius which is fast-twitch, seem to be more susceptible during muscle wasting
(92). While certain muscles do appear to be more susceptible to the wasting observed
during cancer cachexia, fiber type shifts have also been noted typically shifts towards a
faster, more glycolytic phenotype. Diffee et al.(93) noted that while no type IIB MHC
was detected in the control mice soleus muscles, Type IIB comprised of 19% of the
20
C-26 mice as compared to the control mice. While reductions were seen in the Type I
fibers, fiber loss and shifts were observed within the Type II fibers. Other studies have
also reported that during the progression of cancer cachexia there is a decline in muscle
mass that is also accompanied with a decrease in muscle protein concentration (94, 95).
These studies and others have suggested that this loss in the muscle mass is related to
the increased activity in the ubiquitin-proteasome pathway (96). Diffee et. al (93) also
noted that the MHC isoform content changes were very similar to other interventions
that had shown to decrease muscle mass such as spinal transection and decreased
mechanical loading (97, 98). All of these results indicate changes in the Type II MHC
isoforms and decrease in the amount of Type I MHC isoforms. While Type I muscle
fibers are affected by cancer cachexia, often times the greater losses are noted in the
Type II fiber types and shifts from Type IIB to Type IIA. One proposed mechanism
for the decreased loss in the Type I fibers and Type II fiber shift is PCG-1a. PGFC-1a,
peroxisome proliferator-activated receptor-y coactivator, is a transcriptional coactivator
that has multiple roles including mitochondrial biogenesis and more importantly the
fiber type conversion to a more oxidative phenotype in skeletal muscle (99).
Over-expression of PGC- 1a in mice has resulted in an attenuation of muscle mass loss
during denervation-induced atrophy, indicating an important mechanism in the
regulation of muscle mass (99). PGC-1a is reduced during the progression of cancer
cachexia which coincides with the loss in skeletal muscle mass (100) and it appears that
PGC-1a plays a significant regulatory role. This overall loss in skeletal muscle mass
has been validated in other studies demonstrating significant losses in mean cross
21
that the overall body weight in the ApcMin/+ mice had decreased 21% as compared to
control and that the soleus mean fiber cross sectional area had decreased 24% and the
gastrocnemius was reduced 45%, indicating and validating that Type II fibers, due to
lower oxidative capacity appear to be more susceptible to losses associated with the
progression of cancer cachexia (20).
Oxidative Capacity/Effect of Cachexia. The mitochondria are a critical regulator of
skeletal muscle mass during the progression of cancer cachexia due to its multiple roles
such as energy production, production of reactive oxygen species and others. The
increased turnover of mitochondrial proteins and also a suppression of mitochondrial
biogenesis have been suggested as a contributor to the loss observed in oxidative
capacity (8). Predominantly fast-twtich muscles such as the gastrocnemius and the
tibialis anterior seem to have the greatest reductions in muscle mass as compared to the
soleus, which has a much greater oxidative capacity. This loss is observed in the
progression of cancer cachexia, specifically colon cancer, as this has been observed in
the ApcMin/+ mouse (8,101) There is conflicting evidence as some have found that
precachectic oxidative capacity appears to serve as a protective effect during the
progression of cancer cachexia (102), however certain studies have shown otherwise
(103). Wang et al. (103) used LLC (Lewis lung carcinoma implantation) model of mice
and reported that there was increased mitochondrial biogenesis in the skeletal muscle of
the tumor-implanted mice. Interestingly, it was reported that the increased mitochondrial
biogenesis was not enough to rescue muscle loss and the over-expression of muscle
PGC-1a led to increased tumor size. There appears to be debate on exactly how and to
what degree cancer cachexia affects oxidative capacity in skeletal muscle and other
22
less susceptible to overall loss as compared to less oxidative fibers such as the EDL,
however this has not been concluded with certainty.
Intramuscular Glycogen Stores. Carbohydrates can be utilized as a substrate during
exercise and have been studied extensively (104,105,106). Carbohydrates can be stored
as intramuscular glycogen and then utilized during exercise. Depletion of intramuscular
glycogen has been noted as a limiting factor during prolonged exercise (104), while
some data has tried to argue that exhaustive exercise does not always coincide with
depleted intramuscular glycogen (107) however this is highly dependent upon training
status. Training status and availability of intramuscular glycogen stores contributes to
the degree that this becomes a limiting factor. One important factor that impacts
intramuscular glycogen storage is the rate of hepatic glycogen mobilization and
gluconeogenesis (108,109). Haff et al. (110) found that carbohydrate supplementation
improved intramuscular glycogen stores thereby improving performance and duration
during resistance exercise. While most literature indicates the critical role of
intramuscular glycogen in the performance particularly in short intense bouts, there
appears to be a few selected studies that dispute this dogma. Symons and Jacobs (111)
found that a strict low carbohydrate diet resulted in significantly lower intramuscular
glycogen stores versus the control diet. However, when both groups performed
short-term high intensity exercise, performance was not impaired when compared across the
groups. While certain diseases such as McArdles disease (112) can affect the ability of
muscle to utilize stored intramuscular glycogen, the literature is very limited in the effect
of diseases on intramuscular glycogen stores. Variations in diet and training status have
23
been examined, particularly in cancer cachexia. Stephens et al.(113) examined
intramyocellular lipid droplets and reported that these were increased in the presence of
cancer and increased as weight loss increased. However, intramuscular glycogen stores
have yet to be examined during the progression of cancer cachexia.
Cross Sectional Area Alterations. While metabolic changes have been reviewed, overall
changes occur within skeletal muscle during the progression of cancer cachexia such as
alterations in cross sectional area (CSA). Alterations in CSA are often associated with
the body weight changes that are observed during the progression of cancer cachexia.
CSA is a valid measurement of myofiber area and changes in CSA occur in many
muscles, however Type II fibers tend to show the greatest amount of change in CSA
(114, 115). The mass as well as the function are directly related to CSA in skeletal
muscle, these alterations during the progression of cancer cachexia can explain the
atrophy and loss of function that is often observed. Julienne et al (116) reported that
significant changes occurred in cross-sectional area of skeletal muscle rather than
changes in numbers when compared with controls. The more oxidative muscle such as
the soleus did not show reduction in cross sectional area however the fast-twitch
muscles such as the EDL and gastrocnemius were significantly reduced in cross
sectional area. While some have reported that the soleus is not significantly affected,
other studies have shown otherwise. Mehl et. al (20) reported that in ApcMin/+ mice the
soleus muscle in cachectic mice was significantly reduced as compared to B6 and was
associated with a reduction in Type I percentage of fibers and an increase in Type IIa
and TypeIIb. This indicated that while the soleus has been previously shown as less
24
reductions in cross-sectional area and fiber type changes. While the cross-sectional area
of fibers has been analyzed in the cachectic model, there have been no studies that have
examined the effect of the cachexia severity on CSA, oxidative myofiber morphology and
cross- sectional area of glycogen dense/depleted fibers to notate any changes if any are
present during the progression of cancer cachexia.
3. Exercise (Effects on Metabolic Properties and Cachexia)
Exercise has multiple health benefits that have been well established. Studies have
provided data that supports the benefit of both aerobic and resistance exercise during the
progression of wasting diseases. While the literature is quite extensive in the benefits of
aerobic exercise during the progression of cancer cachexia, there is a lack of evidence
from studies examining the effects of resistance training on skeletal muscle and other
systemic variables.
Systemic Effects/Benefits of Exercise. There is a mass of literature that indicates the
benefit of aerobic and resistance training exercise in both healthy and diseased persons.
Some of the benefits include lowered LDL cholesterol, improved neural
communication and stimulation, improved function of skeletal muscle and many
others. Exercise has shown to have benefits in the immediate and long term effects.
Altena et al. (117) reported significant beneficial changes in total cholesterol after only
4 weeks of aerobic exercise while in longer term studies, significant changes were
reported in body mass, systolic/diastolic blood pressure, waist circumference and V02
max (118,119,120). In regards to short term responses, multiple studies reported an
25
appreciable changes in HDL in the short term, however they were present in the long
term. Beneficial changes in body composition were also reported. In regards to
adiposity, multiple studies have reported significantly reduced body fat in the exercise
groups versus non-exercise control (118,122). These changes in body fat were also
associated with changes in waist and hip circumference. Murphy et al (119) found that
in both continuous and accumulated exercise groups, there were reductions in the waist
and hip circumference measurements. Studies have also reported improvements in
VO2 max after exercise as compared to non-exercise controls (123,124). While
multiple systemic effects are reported with exercise, there are beneficial effects in
skeletal muscle and adaptations occur over time with training.
Resistance Exercise and Adipose Tissue/Fat Metabolism. Resistance exercise has been
shown to have numerous beneficial effects, particularly on lean and fat tissue mass.
There is evidence that repeated bouts of resistance exercise training can improve body
composition by reducing fat mass and increasing lean body mass (125). Immediately
post exercise it has been reported that intramuscular triglyceride stores are reduced as
they were used for substrate fuel (126). This was further validated as resting respiratory
exchange ratio was reduced immediately (127) and 15 hours following a bout of
resistance exercise, suggesting fat oxidation post-exercise (128). Melanson et al. (129)
reported that there was an increase of 5% in 24 hour fat oxidation following a bout of
resistance exercise however it was not significant. Stich et al. (130) observed that after
60 minutes of exercise, lipolysis was at its highest rate which matched overall body fat
oxidation, suggesting the use of fats of whole body for substrate use during resistance
exercise. Orsmbee et al (128) reported that subcutaneous adipose tissue lipolysis and
26
literature has shown that resistance exercise will improve fat oxidation and
intramuscular triglyceride stores, however no work has been done with resistance
exercise in the cancer cachectic model to note if these changes will still occur.
Resistance Exercise and Skeletal Muscle. Both resistance training and aerobic exercise
has systemic beneficial effects as well as adaptations that occur in skeletal muscle
through training. One of the adaptations that occurs in skeletal muscle over time with
resistance training is known as hypertrophy. Hypertrophy refers to an increase in size
the myofibrils, rather than an increase in fiber number which is known as hyperplasia
(131). Most training studies have reported an increase in the cross-sectional area of
muscle fibers ranging from 20-45% (132). Hather et al. (133) reported that glycolytic
muscle fibers showed greater increases in cross-sectional area than that of oxidative
muscle fibers. With the increase in cross-sectional area of muscle fibers are indicative
of multiple changes that are occurring within the muscle fiber. Typically these are
changes in actin and myosin protein filaments, more myofibrils, more sarcoplasm as
well as increases in the connective tissue around the muscle fibers (131). Associated
with changes in the cross-sectional area of skeletal muscle during are muscular strength
gains. During the first few weeks of resistance training, much of the gain in strength is
due to neural adaptations, rather than the cross-sectional area of the skeletal muscle as
the motor unit recruitment increases and is more efficient. Longer term changes in
muscular strength can be associated with the changes in cross- sectional area of the
skeletal muscle. These changes in muscular strength can vary greatly as Kraemer
reported ranges of +7% to +45% (134).
27
metabolism associated with skeletal muscle have been reported with resistance exercise
training. An adaptation to exercise often noted is the increase in GLUT4 receptors.
GLUT4 is a protein that is the insulin-regulated glucose transporter that is found in
adipose and skeletal muscle (131). Improvements in glucose metabolism have been
reported in clients engaging in regular resistance exercise training and when tested,
improvements were noted in glucose tolerance and reduced insulin responses to oral
glucose (135,136). While there are adaptations to skeletal muscle with resistance
exercise, immediate effects have been noted and factors previous to the exercise can
affect the short-term effects. Tesch et al. (137) reported that bodybuilders completing a
circuit style weight lifting session had a muscle glycogen content that was 26% lower
post-exercise than when compared to baseline measurements. While this decline was
reported as modest, it still indicated that muscle glycogen was contributing to the
resistance exercise session. Based upon this information Essen-Gustavsson and Tesch
(138) repeated the same experiment however this time measuring muscle glycogen and
intramuscular triglycerides. Muscle glycogen content decrease was similar as before at
28% and intramuscular triglycerides also were reduced by 30% immediately post-
exercise. This data indicated that both muscle glycogen and triglycerides both
contribute as energy substrates during weight training. Limiting the intake of muscle
glycogen stores has also been shown to negatively affect performance. Leveritt and
Abernathy (139) reported that depletion of glycogen negatively affected performance.
The study was conducted with a control group and a group that was on a carbohydrate
restricted group for 48 hours plus exhaustive exercise prior to testing. Both groups were
28
extension trials, the squat performance had significantly decreased in the carbohydrate
restricted group. One of the major factors suggested by the authors was that the knee
extension trials were very short duration isokinetic bouts which energy production was
mainly from creatine phosphate, while the longer isometric squat exercise utilized more
glycogen, therefore the depletion of glycogen was more of an effect. While glycogen
depletion has been shown to negatively affect performance, particularly in isometric
exercise, glycogen loading has the opposite effect indicating the importance for
intramuscular glycogen content in skeletal muscle for performance. Haff et al (140)
while previously mentioned did a further study to examine the effect of muscle
glycogen stores and glycogen loading on performance. Control subjects drank a
placebo beverage while another group consumed a 250 gram carbohydrate supplement,
then rested for 3 hours. After the rest period both groups performed squats at 55% of
1-RM until exhaustion. The group that has consumed the carbohydrate supplement were
able to exercise significantly longer than the placebo drink group, the authors concluded
that the ingestion of carbohydrates increased the muscle glycogen stores aided in
improved performance in weight training activity.
Intramuscular Triglycerides and Resistance Exercise. While intramuscular
triglyceride stores can be utilized as a substrate during exercise, high accumulations of
intramuscular lipids have been linked to health problems. Multiple studies have noted
significant correlations between high intramuscular lipid contents and skeletal muscle
insulin resistance (141, 142) in obesity and Type 2 diabetes. High levels of
intramuscular lipids are also found in athletes as well which has been referenced as the
29
athletes, have similar intramuscular lipid content as that of insulin resistance obese and
type 2 diabetes patients (143). Changes in intramuscular lipid content have also been
noted in older individuals after beginning an exercise program associated with
improved overall fitness and oxidative capacity. Dubé et al. (144) found that just
moderate improvements in physical activity increased use of intramuscular
triglyceride stores, associated with improvements in intramuscular glycogen stores and
increased oxidative capacity. This study indicated that exercise has beneficial effects
on oxidative capacity associated with improvements on intramuscular glycogen and
triglyceride stores in healthy muscle. While many studies have examined the effects of
intramuscular energy stores and oxidative capacity in response to resistance exercise,
30
C
HAPTER3
T
HEE
FFECT OFC
ACHEXIAS
EVERITY ONS
ELECTEDM
YOFIBERM
ETABOLICP
ROPERTIES INA
PCMIN/+M
ICEABSTRACT
Cancer cachexia disrupts skeletal muscle metabolism in conjunction with muscle
mass loss. Alterations in myofiber area and metabolic properties can significantly impact
the function of skeletal muscle. The purpose of this study was to determine the effect of
cachexia severity on frequency and area of high and low SDH activity fibers and high
and low glycogen content fibers during cachexia-induced myofiber atrophy. Male
ApcMin/+ mice were studied during the progression of cachexia (16-20 weeks of age) and
stratified into groups based on the severity of cachexia [weight stable WS (no body
weight (BW) change), moderate (5-19% BW change) and severe (≥20% BW change)].
Myofiber area and myofiber metabolic properties were examined through histological
analysis (H&E, SDH, and PAS) in the tibialis anterior (TA) muscle. Cachexia severity
progressively decreased TA mass and TA mean myofiber cross-sectional area (CSA).
The frequency of high SDH activity fibers (OX) was reduced in mice with moderate and
severe cachexia (23% and 45%, p<0.01). Additionally, CSA was reduced in both OX and
low SDH activity (GL) myofibers. However, there was an increase in frequency of high
glycogen content fibers (HG) in both moderate and severe cachexia (24% and 55%,
31
controls and ApcMin/+ WS. These results demonstrate there is progressive myofiber
atrophy regardless of SDH activity with cachexia severity. Additionally, there is a
progressive reduction in the frequency of OX myofibers and an increase in the freqeuncy
HG fibers with cachexia severity.
INTRODUCTION
According to recently published data from the CDC and NIH, cancer is ranked as
the second-leading cause of death in the United States (1,2). The NIH estimates that
over-all costs of cancers in 2007 were 227 billion dollars with over half of that being
direct medical costs and the other being related to indirect mortality costs (1). Cachexia
is condition which involves a wasting of both adipose and skeletal muscle tissue and is
associated with over 50% of cancer patients and attributed to 40% of cancer deaths (3).
All of the mechanisms are not clear in regards to the progression of cachexia and multiple
inflammatory cytokines have been identified as possible contributors to the progression
(4). While much research has been done on skeletal muscle during the progression of
cancer cachexia (5, 8, 20), there are still numerous gaps in the research regarding specific
metabolic properties. Investigating and identifying the alterations in skeletal muscle
metabolic properties during the progression of cancer cachexia is essential in moving
towards treatment and further understanding the debilitating condition.
A hallmark characteristic of cachexia is a loss of both adipose and skeletal muscle
tissue (4). During the progression of cancer cachexia severity, there is an imbalance
between protein synthesis and degradation leading to the loss in skeletal muscle mass.
32
multiple proteolytic genes such as polyubiquitins, Ub ligases atrogin-1/MAFbx and
MuRF-1 which contribute to the increased protein degradation (3,6). Skeletal muscle is
composed of three different primary fiber types, and these have been shown to be
differentially affected during the progression of cachexia (20). These fibers are
characterized by specific metabolic properties as reflected by their intracellular enzyme
activity patterns; type I fibers are highly oxidative fibers and Type II can range from
oxidative-glycolytic (Type IIa) to solely glycolytic (Type IIb) (20). While there are
numerous metabolic properties that are specific to each muscle based upon their enzyme
activity pattern, certain specific metabolic properties in ApcMin/+ mice have yet to be
further investigated.
Oxidative capacity is defined as the maximal capacity of a tissue to utilize oxygen
for energy production, which is directly related to the amount of mitochondria in the
skeletal muscle fiber (8). While there are numerous methods that can be utilized to
measure oxidative capacity, a common histological technique is succinate dehydrogenase
(SDH) staining. The SDH enzyme is located in the inner membrane of the mitochondria
and oxidizes succinate to fumarate in Kreb’s cycle. The staining technique will stain the
SDH enzyme and a greater intensity of the staining indicates greater more mitochondria
and enzymatic activity, and this activity is indicative of oxidative capacity (9). Another
differential factor in skeletal muscle fiber types is substrate utilization. Type I fibers are
more oxidative utilizing free fatty acids (FFA) for energy production while Type II fibers
are more glycolytic using glycogen for energy production (145). Glucose is stored as
glycogen in skeletal muscle via glycogen synthase (GYS1 for skeletal muscle) and is
33
muscle glycogen content is periodic acid Schiff (PAS) staining. PAS staining is used to
detect polysaccharides such as glycogen. The greater the numbers of fibers with dark
intense staining has shown to strongly positively correlate with total skeletal muscle
glycogen content (46). Metabolism is known to be dysregulated with cachexia, however
specific myofibers metabolic properties related to skeletal muscle metabolism are less
understood. Elucidating any changes in myofiber metabolic properties during
cachexia-induced myofiber atrophy is essential for further examining the effects of cachexia on
skeletal muscle to move towards further understanding the mechanisms of change and
treatment of cachexia.
While human models of cachexia patients have been used in numerous studies,
the use of the ApcMin/+ mouse is a widely used method of examining the effects of the
progression of cancer cachexia as it has been shown to correlate and prove as an effective
model similar to humans (20). The ApcMin/+ model is from the alteration of the tumor
suppressor gene (Apc) and these mice are highly susceptible to spontaneous intestinal
adenoma formation which is very similar to the human model of colon cancer. Much
data has been shown using the ApcMin/+ model with increases in protein degradation,
reductions in protein synthesis, myofiber degeneration and other characteristics with the
progression of cancer cachexia (5, 8, 20). Oxidative capacity has been shown to be
reduced with a selected degree of cachexia in selected muscle however alterations in high
and low SDH activity myofibers has not been examined neither has high and low
glycogen content myofibers. Therefore, the purpose of this study is to examine the effect
of cancer cachexia severity on frequency and size of high and low SDH activity
34
atrophy. The hypothesis of this study is that cachexia severity will progressively induce
myofiber atrophy and will reduce the frequency and size of high SDH activity myofibers
however will increase the frequency of high glycogen content myofibers.
MATERIALS AND METHODS
Animals. All WT and ApcMin/+ mice used in this study were on a C57BL/6 background
and were originally purchased from Jackson Laboratories (Bar Harbor, ME). All mice
were bred at the University of South Carolina’s Colon Cancer Research Center Mouse
Core breeding facility that is housed in the University’s Animal Resource facility, as
previously described. For all mice in the study, the room was maintained on a 12:12-h
light-dark cycle with the light period starting at 0700. Mice were provided standard
rodent chow (cat. no. 8604 Rodent Diet; Harlan Teklad, Madison, WI) and water ad
libitum. Body weights and food intake were measured weekly. All animal
experimentation was approved by the University of South Carolina’s Institutional Animal
Care and Use Committee.
Determination of cachexia symptom severity. The inherent variability in cachexia
development between mice is a strength of the ApcMin/+ mouse model, and ApcMin/+ mice.
Cachexia severity was determined to classify the groups for the ApcMin/+ mice. Mice
were classified as having moderate or severe cachexia based on their body mass loss
change from peak body weight (16 weeks) to sacrifice (20 weeks). Mice were
categorized as having moderate cachexia if body weight at sacrifice was 5-19% change
35
at sacrifice was equal or greater to 20% change from peak body weight. This
categorization is based upon published studies from our lab (5, 8)
Tissue collection. Mice were given a subcutaneous injection of
ketamine-xylazine-acepromazine cocktail (1.4 ml/kg body wt). Skeletal muscles, spleens, livers, and tibias
were excised. The right tibialis anterior (TA) was placed in optimal cutting temperature
(OCT) solution and frozen in isopentane cooled in liquid nitrogen. All issues were rinsed
in PBS, snap frozen in liquid nitrogen, and stored at -80°C until further analysis.
Tissue morphological analysis. Cross-sectional area was performed as previously
described (20). Briefly, transverse sections (10 um) were cut from OCT mounted distal
TA muscle on a cryostat at -20°C. Hematoxylin and eosin (H&E) staining was performed
on sections for all muscle samples for cross-sectional area (CSA). Digital photographs
were taken from each H&E section at a 40x magnification with a Nikon spot camera, and
approx. 125 fibers/animal were traced with imaging software (ImageJ - NIH) in a blinded
fashion.
Succinate Dehydrogenase Staining. Succinate dehydrogenase (SDH) staining was
performed as previously described to characterize mitochondrial enzyme
function/oxidative capacity in the TA muscle (5). Sectioning of muscle was performed the
same as previously described. The frozen sections were dried at room temperature for 10
min. Sections were incubated in a solution made up of 0.2 M phosphate buffer (pH 7.4),
0.1 M MgCl2, 0.2 M succinic acid, and 2.4 mM nitroblue tetrazolium at 37°C for 45 min.
The sections were then washed in deionized water for 3 min, dehydrated in 50% ethanol