Abstract
Climatic disasters, environment-related reports, environmental conservation-related calls for savings and increasing concern for individuals about the future have forced companies to be more sensitive to the environment and social responsibility issues on the environment. In an increasingly competitive environment, these studies provide superiority to the companies, because as time passes, conscious consumers pay more attention to the environment and are turning to eco-friendly products.
The purpose of this study is, by analysing consumers’ environmentalist approaches and their attitudes and behaviors towards environment, to measure their attitudes towards green advertisements, towards companies that make green advertising and towards their products. Results has shown that there is a positive and meaningful relationship between “environmentalist approach”, “environmental purchasing behavior”, “attitude towards green advertising” and “attitude towards companies that make green advertising and towards their products”.
Key Words: Environmentalist Approach, Green Consumer, Green Advertisements, Green Marketing
1.LİTERATURE REVİEW
Since the economic growth of the last two centuries and consequently consumption has increased, the natural balance of the environment has begun to deteriorate (Girdhar and Kahlief, 2013). Concerns have arisen over how this distorted balance will affect our future, and over time these worries begin to reflect on the economic choices of the individual. Therefore, environmentalist companies that are carrying future worries have begun to be preferred (Zinkhan and Carlson, 2017). As a result, due to the depletion of natural resources (Chen and Chai, 2010) and climate change, the green environment is an important issue on the agenda of both consumers and producers (Haytko and Matulich, 2007). Moreover, as increasing competition drives companies to become a greener company, and green marketing concept based on green environmental responsibility has become a strategy for companies (Banerjee, 2002). Green marketing can be defined as “the designing, promoting, pricing and distributing efforts of a company to promote the idea of protecting the environment.” Although green marketing is one of the key points in modern business sustainability, primary concern has always been income and profit. For this reason, companies that focus on ecological balance in all operations are more environmentally friendly; while reducing environmental pollution, protecting natural resources and the environment, they try to maximize profits (Suki et al., 2015).
With each passing day the number of environmentalists consumers and environmentalist organizations has increased, and with the advent of legal sanctions, the efforts of companies to carry out their environmental activities have also increased (Chen, 2008). Approximately thirty years ago, only environmental pollution and air pollution were taken into account, today renewable energy, bio waste and many other issues are being studied academicically, social responsibility campaigns are being organized and advertisements are being published (Straughan and Roberts, 1999). Although there are many advertising and social responsibility campaigns for sustainability of environmental sensitivity, the studies show that the ecological environment, green environment and green product perception differ from on an individual basis. In other words, an advertising work does not affect every individual on an equal level. The demographic characteristics of the individual, the social environment they live in, or the status they have, etc. differentiates the perception of individuals. For this reason, companies that focus on the concept of green environment need to follow the ads they perform and determine which group these ads are affecting (Line et al., 2016).
The gradual expansion of the green market means that many consumers are adopting a positive attitude towards environmental issues as well as the importance of including environmental information in consumption decisions (Maignan and Ferrell, 2004; Grimmer and Bingham, 2010, Grimmer and Bingham, 2013). Roberts (1996) stated that if a consumer is exposed to environmental issues or has information about them, s/he will
Env
i
ronmental
i
st Approach
a
nd Attıtudes
Towards Green Advertısıng
Assoc. Prof. Dr. Pınar AYTEKIN
Izmir Democracy University Faculty of Economics and Administrative Science Department of Business Administration
Lec. Bahar ÇELIK
support or not support at that degree. For this reason, the activities carried out by social marketing studies have increased individuals’ awareness and sensibility green environment, future protection, consumed sources etc. (Smith and O'Sullivan, 2012). These consumers, called environmentalist consumers or green consumers, expect companies to be sensitive to the environment and to implement practices that do not harm the environment or reduce the harm to a minimum level (Fisher, 1990, Cross, 1990; Donaton and Fitzgerald, 1992). However, studies conducted by Shlossberg (1991) and Winski (1991) show that there is a weak relationship between the individual’s environmentalist attitudes and the behavior of purchasing environmentally friendly products.
According to Diamantopoulos et al. (2003); in some studies it’s found that older people are more sensitive to the environment (Jackson, 1983, Zeidner and Shechter, 1988), but in other studies (Van Liere and Dunlap, 1980; Schahn and Holzer, 1990; Vining and Ebreo, 1990; Scott and Willits, 1994) it’s found a negative relationship between age and green behavior. This negative relationship is likely to be due to the lack of resources among the younger members of the population. Although young people say they will use more resources to protect the environment in the future, many do not have the necessary financial resources to support environmental problems at this time.
In this study; consumers’ ecnvironmentalist approaches, environmentalist purchasing behaviours, attitudes towards green advertisements and attitudes towards companies that make green advertising and towards their products. In this direction; it is aimed to determine whether there is a relationship between consumer’s environmentalist attitudes and attitudes towards green advertisements and how persuasive and reliable the companies and their products are in the consumer’s eyes.
2.METHODOLOGY
The questionnaire used in the research was formed by using the scales of Haytko and Matulich (2007) and Girdhar and Kahlief (2013). In the first part of the questionnaire; there are 41 expressions regarding consumers’ environmentalist approaches, environmentalist purchasing behaviors, attitudes towards green advertisements, attitudes towards companies that make green advertising and towards their products. In the second part, there are questions about the demographic characteristics of consumers. Since the questions will be adapted to the social and cultural structures of the individuals living in Turkey, a preliminary survey was conducted with 50 individuals. Questions that were not understood according to the obtained data were excluded from the analysis and the investigation was continued with 32 items.
The main mass selected for the questionnaire consists of consumers who are over 18 years old and living in Kütahya. In studies to determine acceptable sample sizes for the main masses; when N ≥ 1.000.000, n = 384 units at 95% security level are considered sufficient (Sekaran, 2003: 294). In the light of this information, a face-to-face questionnaire was applied to 450 consumers by convenience sampling method. A total of 430 questionnaire forms were evaluated after 20 missing and incorrect questionnaire forms were taken out.
3.RESEARCH MODEL AND HYPOTHESİS
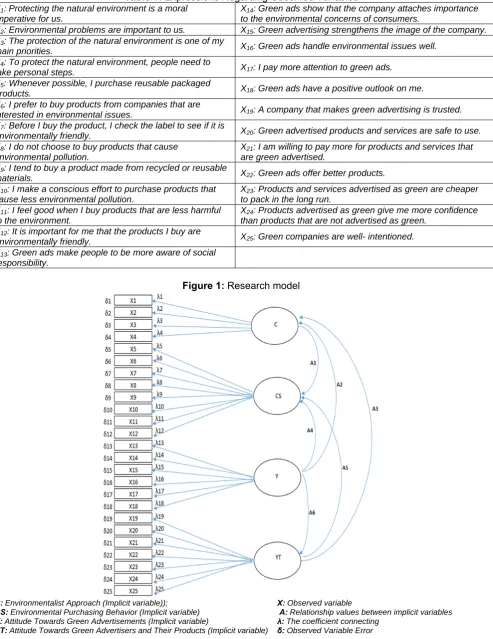
In the study, a suitable model was developed for the purpose as given in Figure 1. In the model, there are four implicit variables as seen in the Environmental Approach (C), Environmentalist Purchasing Behavior (CS), Attitude Towards Green Advertisements (Y), and Attitudes Towards Companies That Make Green Advertising and Towards Their Products (YT) and CS implicit variables will be treated as dependent variables. As it is seen, we assume that the C variable represents four, the CS variable represents eight, the Y variable represents seven, and the YT variable represents seven observed variables. If the analysis results are like as expected, the application of these variables will continue with the structural equation modeling.
In the frame of this model we determined the result of the literature search, the following hypotheses could be written;
H1: Positive attitude towards green ads positively affects attitude towards companies that make green advertising and towards their products.
H2: Positive attitude towards green ads positively affects environmentalist approach.
H3: Positive attitude towards green ads positively affects environmental purchasing behavior.
H4: Positive attitude towards green advertisers and their products affects positive environmental purchasing behavior.
Table 1: Expressions Regarding Observed Variables X1: Protecting the natural environment is a moral
imperative for us.
X14: Green ads show that the company attaches importance to the environmental concerns of consumers.
X2: Environmental problems are important to us. X15: Green advertising strengthens the image of the company. X3: The protection of the natural environment is one of my
main priorities. X16: Green ads handle environmental issues well. X4: To protect the natural environment, people need to
take personal steps. X17: I pay more attention to green ads. X5: Whenever possible, I purchase reusable packaged
products. X18: Green ads have a positive outlook on me.
X6: I prefer to buy products from companies that are
interested in environmental issues. X19: A company that makes green advertising is trusted. X7: Before I buy the product, I check the label to see if it is
environmentally friendly. X20: Green advertised products and services are safe to use. X8: I do not choose to buy products that cause
environmental pollution.
X21: I am willing to pay more for products and services that are green advertised.
X9: I tend to buy a product made from recycled or reusable
materials. X22: Green ads offer better products.
X10: I make a conscious effort to purchase products that cause less environmental pollution.
X23: Products and services advertised as green are cheaper to pack in the long run.
X11: I feel good when I buy products that are less harmful to the environment.
X24: Products advertised as green give me more confidence than products that are not advertised as green.
X12: It is important for me that the products I buy are
environmentally friendly. X25: Green companies are well- intentioned. X13: Green ads make people to be more aware of social
responsibility.
Figure 1: Research model
C:Environmentalist Approach (Implicit variable)); X: Observed variable
CS:Environmental Purchasing Behavior (Implicit variable) A: Relationship values between implicit variables
Y:Attitude Towards Green Advertisements (Implicit variable) λ: The coefficient connecting
4. FİNDİNGS
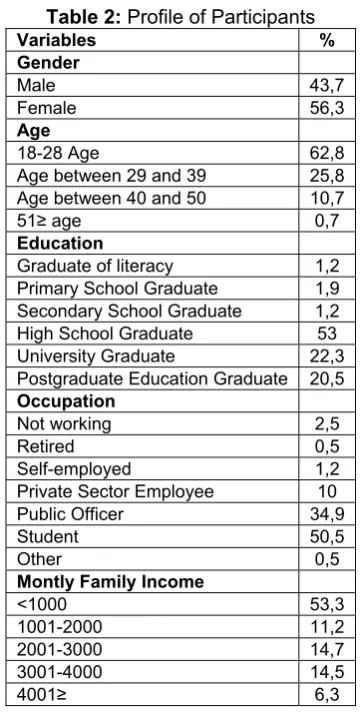
Four demographic variables related to participants are shown below in Table 2. Approximately 56,3% of the participants were women; 62,8% are in the age range of 18-28 years; 53% of them are high school graduates and 53,3% of them have the monthly family income below 1000.
Table 2: Profile of Participants
Variables % Gender
Male 43,7 Female 56,3 Age
18-28 Age 62,8
Age between 29 and 39 25,8 Age between 40 and 50 10,7
51≥ age 0,7
Education
Graduate of literacy 1,2 Primary School Graduate 1,9 Secondary School Graduate 1,2 High School Graduate 53 University Graduate 22,3 Postgraduate Education Graduate 20,5 Occupation
Not working 2,5
Retired 0,5 Self-employed 1,2 Private Sector Employee 10
Public Officer 34,9
Student 50,5 Other 0,5 Montly Family Income
<1000 53,3
1001-2000 11,2
2001-3000 14,7
3001-4000 14,5
4001≥ 6,3
The KMO and Barlett Test were used to determine if the data set is suitable for factor analysis. It is desirable that the value of KMO is above 60% (Nakip, 2006). The data set is suitable for factor analysis because the KMO value is 0,903> 0,50 at the 95% confidence interval. The Cronbach’s Alpha reliability coefficient of the questionnaire was calculated as 0,881.
The research consists of 2 stages. Explanatory factor analysis was first performed with the help of SPPSS 13.0. When factor analysis was applied to the data set, values were collected under four factor dimensions. Questions with factor loadings less than 0,50 as a result of factor analysis were excluded from the analysis (Comrey and Lee, 1992). Cronbach’s Alpha reliability coefficients of the sub-factors were found as 0,885 for the first factor, 0,896 for the second factor, 0,879 for the third factor and 0,759 for the fourth factor. As a result of the analysis with 25 items, the four factors were explained as “attitude towards green advertisements” (58,025%), “attitudes towards companies that make green advertising and towards their products” (62,328%), “environmental purchasing behavior (55,713%), “Environmentalist approach” (58,497%).
Table 3: Explicit Factor Analysis of Environmentalist Approach, Environmental Purchasing Behavior, Attitudes Towards Green Advertisements and Attitudes Towards Companies That Make Green Adveritising and Towards
Their Products
Factors Expressions Codes Factor Loads Explained Variance
Environmentalist approach KMO= 0,772 df=6 p<0,000 Cronbach’s alpha= 0,759
Protecting the natural environment is a moral imperative for us X1 ,796
58,497 Environmental problems are important to us X2 ,673
The protection of the natural environment is one of my main
priorities X3 ,654
To protect the natural environment, people need to take personal
steps X4 ,698
Environmental Purchasing Behavior KMO= 0,918 df= 28 p<0,000 Cronbach’s alpha= 0,885
Wherever possible, I purchase reusable packaged products X5 ,697
55,713 I prefer to buy products from companies that are interested in
environmental issues X6 ,693
Before I buy the product, I check the label to see if it’s
environmentally friendly X7 ,770
I do not choose to buy products that cause environmental pollution X8 ,734 I tend to buy a product made from recycled or reusable material X9 ,695 I make a conscious effort to purchase products that cause less
environmental pollution. X10 ,796
I feel good when I buy products that are less harmful to the
environment X11 ,582
It is important for me that the products I buy are environmentally
friendly X12 ,768
Attitudes Towards Green Advertisements KMO= 0,908 df= 21 p<0,000 Cronbach’s alpha= 0,879
Green ads make people to be more aware of social responsibility X13 ,735
58,025 Green ads show that the company attaches importance to
environmental concerns of the consumers’ X14 ,730
Green advertising strengthens the image of the company X15 ,758 Green ads handle environmental issues well X16 ,612
I pay more attention to green ads X17 ,689
Green ads have a positive outlook on me X18 ,689
Attitudes Towards Companies That Make Green Advertising and Towards Their Products KMO= 0,908 df= 21 p<0,000 Cronbach’s alpha= 0,896
A company that makes green advertising is trusted. X19 ,791
62,328 Green advertised products and services are safe to use X20 ,811
I am willing to pay more for products and services that are green
advertised X21 ,674
Green ads offer better products X22 ,810
Products and services advertised as green are cheaper to pack in
the long run. X23 ,667
Products advertised as green give me more confidence than
products that are not advertised as green X24 ,693
Green companies are well- intentioned. X25 ,806
Table 4: According to Demographic Characteristics of Attitudes Tendencies of Participants Towards Environmentalist Approach, Environmental Purchasing Behavior, Attitudes Towards Green Advertisements,
Attitudes Towards Companies That Make Green Advertising and Towards Their Products
Factor Gender Mean t
Sig. (2-tailed
)
Age Mean Educational Status Mean Occupation Mean Income Mean
Environme ntalist Approach
Female 1,41 2,11 ,035
18-28 29-39 40-50 51≥ 1,48 1,44 1,45 1,58 Literate Primary Elementary School High School University Postgraduate 1,50 1,63 1,25 1,49 1,42 1,46 Not working Self-employed State Officer Worker Private Sector Employee Housewife Retired Student Other 1,30 1,25 1,45 1,42 1,47 1,25 1,38 1,50 1,13 <1000 1.001-2.000 2.001-3.000 3.001-4.000 4.001≥ 1,49 1,40 1,44 1,49 1,39 Male 1,51 2,19 ,029
Environme ntalist Purchuasin g
Behaviour
Female 2,14 2,13 ,034
18-28 29-39 40-50 51≥ 2,29 2,08 2,15 2,50 Literate Primary Elementary School High School University Postgraduate 2,13 1,88 2,13 2,28 2,11 2,25 Not working Self-employed State Officer Worker Private Sector Employee Housewife Retired Student Other 2,08 1,68 2,22 1,79 2,02 2,50 1,94 2,32 1,88 Less than 1000 1.001-2.000 2.001-3.000 3.001-4.000 4.001≥ 2,27 2,19 2,18 2,15 2,26 Male 2,29 2,14 ,033
Attitudes Towards Green Ads
Female 1,78 4,19 ,000
18-28 29-39 40-50 51≥ 1,78 1,82 1,61 1,78 Literate Primary Elementary School High School University Postgraduate 1,97 1,89 2,66 1,88 2,03 1,93 Not working Self-employed State Officer Worker Private Sector Employee Housewife Retired Student Other 1,61 1,23 1,98 2,09 1,94 2,14 2,21 1,92 1,57 Less than 1000 1.001-2.000 2.001-3.000 3.001-4.000 4.001≥ 1,91 2,00 1,99 1,93 1,91 Male 2,05 4,33 ,000
Attitudes Towards Companies That Make Green Advertising and Towards Their Products
Female 2,46 2,21 ,028
18-28 29-39 40-50 51≥ 2,50 2,67 2,47 3,19 Literate Primary Elementary School High School University Postgraduate 2,43 2,61 2,74 2,53 2,57 2,56 Not working Self-employed State Officer Worker Private Sector Employee Housewife Retired Student Other 2,37 2,11 2,62 2,71 2,53 2,00 3,14 2,50 2,43 Less than1000 1.001-2.000 2.001-3.000 3.001-4.000 4.001≥ 2,52 2,58 2,66 2,55 2,41 Male 2,62 2,26 ,024
p<0,05
Figure 2: Path diagram showing the relationship between the environmental approach, environmental purchasing behaviour, attitudes towards green advertisements, attitudes towards companies that make green
C: Environmental Approach, CS: Purchasing Behavior, Y: Attitudes Towards Green Advertisements, YT: Attitudes Towards Companies That Make Green Advertising and Towards Their Products
According to the model study conducted by Lisrel 8.80, it was determined that there is a positive and meaningful relationship between “Environmental Approach”, “Environmental Purchasing Behavior”, “Attitudes Towards Green Advertisements” and “Attitudes Towards Companies That Make Green Advertising and Towards Their Products”. Table 1 shows the effect sizes of the standardized road coefficients in the model. At the same time, the effect size between the four implicit variables is also shown. Kline (2005) states that the impact value of about 0.30 is ‘middle’; 0,50 and above it means that the effect value is ‘high’ level. Impact Values below 0.30 are removed from the model.
The goodness of fit values of the sample data are evaluated to assess how well the model is suitable. The values of goodness of fit help to determine how consistent the model relations are. These values are the most basis of Chi-square. According to Jöreskog and Sörborm (2001), a high Chi-square value can be interpreted as a bad indicator of fit. However, when new parameters are added to the model, the value of RMSEA (Root Mean Square Error of Approximation) has been evaluated since it can be a random improvement in Chi-square value. Because not only it is easier to interpret the RMSEA value but also it provides independent estimates of sample size. Moreover, RMSEA is not influenced by the complexity of the model. In order to be able to accept the model, it is expected that the RMSEA value will be below 0.08 (Berberoğlu and Uygun, (2012), Kelloway, 1998, Şimşek, 2007). In addition to these values, the values of GFI (Godness of Fit Index), AGFI (Adjusted Godness of Fit Index) and SRMR (Standardized Root Mean Square Residual) were examined. According to this; it is expected that GFI and AGFI values should be 0.90 or higher, but it is stated that values of 0.80-0.89 can be accepted as appropriate values in some sources. The SRMR value should be less than 0.08 (Kline, 2005, Segars and Grover, 1993, Doll et al., 1994, Okur and Yalcin, 2012, Simsek-Özdilek, 2007, Berberoğlu and Uygun, 2012, Uygun et al. , 2010).
Table 5: Values of Model Goodness of fit
Values of Goodness of Fit Suggessted Values Model Values
RMSEA ≤ 0,08 0,068
SRMR ≤ 0,08 0,060
GFI ≥ 0,90/ 0,80-0,89 0,87
AGFI ≥ 0,90/ 0,80-0,89 0,84
and “Attitudes Towards Companies that Make Green Advertising and Towards Their Products”, and the change in one of these dimensions affects the other.
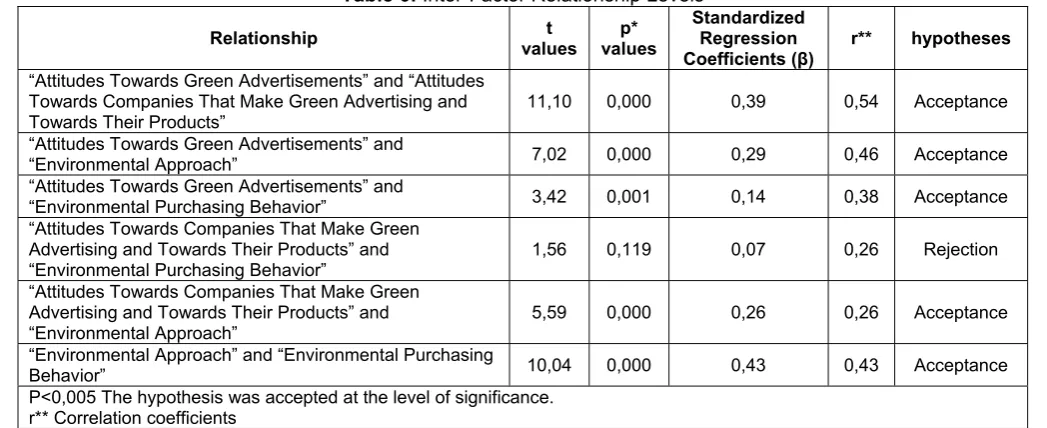
Table 6: Inter-Factor Relationship Levels
Relationship values t values p* Standardized Regression Coefficients (β)
r** hypotheses “Attitudes Towards Green Advertisements” and “Attitudes
Towards Companies That Make Green Advertising and
Towards Their Products” 11,10 0,000 0,39 0,54 Acceptance
“Attitudes Towards Green Advertisements” and
“Environmental Approach” 7,02 0,000 0,29 0,46 Acceptance
“Attitudes Towards Green Advertisements” and
“Environmental Purchasing Behavior” 3,42 0,001 0,14 0,38 Acceptance
“Attitudes Towards Companies That Make Green Advertising and Towards Their Products” and
“Environmental Purchasing Behavior” 1,56 0,119 0,07 0,26 Rejection
“Attitudes Towards Companies That Make Green Advertising and Towards Their Products” and “Environmental Approach”
5,59 0,000 0,26 0,26 Acceptance
“Environmental Approach” and “Environmental Purchasing
Behavior” 10,04 0,000 0,43 0,43 Acceptance
P<0,005 The hypothesis was accepted at the level of significance. r** Correlation coefficients
As it can be seen that, while the highest level of relationship is between “attitudes towards green advertisements” and “attitudes towards companies that make green advertising and towards their products” while the lowest level is between “environmental approach” and “attitudes towards companies that make green advertising and towards their products”. There was no significant relationship between “environmental purchasing behavior” and “attitudes towards companies that make green advertising and towards their products.” In other words, the change in “attitudes towards companies that make green advertising and towards their products” does not affect the “environmental purchasing behavior” of the individual.
CONCLUSİON,SUGGESTİONS AND CONSTRAİNTS
As a result of the analyzes it has been found that there is a statistically significant and positive relationship between “environmentalist approach” and “environmental purchasing behavior”, “attitudes towards green advertisements” and “attitudes towards companies that make green advertising and towards their products.” In addition, it has been determined that there is a statistically significant and positive relationship between “environmental purchasing behavior” both “attitudes towards green advertisements” and “attitudes towards companies that make green advertising and towards their products.” Finally, it has been seen that there is a statistically significant and positive relationship between “attitudes towards green advertisements” and “attitudes towards companies that make green advertising and towards their products.” The highest Spearman’s correlation coefficient was found between “attitudes towards green advertisements” and “attitudes towards companies that make green advertising and towards their products (r=0,556, p<0,05). These results show us that consumers who have an environmentalist approach can show more environmentalist purchasing behavior and are more sensitive to green advertisements, and attitudes towards companies that make green advertising and towards their products. In addition, it is understood that consumers who have positive attitudes towards green advertisements have a positive attitudes and point of view towards companies that make green advertising and towards their products. Therefore, as the environmental awareness increases in society, the importance given to green products also increases. Given the responsibilities of companies towards the environment, it is beneficial for them to produce environmentally sensitive products and to advertise them with the green advertisements they prepare.
buying behaviors. The result of older consumers making more environmental purchases is consistent with the work of Jackson (1983) and Zeidner and Shechter (1988). However, it is also necessary for young people to increase their sensitivity towards the environment, in particular to increase their demand for products with green advertisements. For this, it may be useful to give promotional messages to young people in green advertising. Due to the time and cost constraints of the research, the research is done in Kutahya, it is not possible to make the results of the project to be generalized in terms of Turkey. Conducting similar studies with consumers in other populations with more populations can also help to obtain more detailed and generalized results. In addition, the differences that can arise from the application of the research in the socially and economically diverse societies of Turkey can be evaluated.
REFERENCES
Banerjee, S. B. (2002). Organizational Strategies for Sustainable Development: Developing a Research Agenda for the NewMillennium. Australian Journal of Management. 27. pp. 105-119.
Berberoğlu and Uygun, (2012), Çevre Farkındalığı- Çevre Tutumu Arasındaki İlişkinin Yapısal Eşitlik Modeli İle Sınanması, Eğitim Fakültesi Dergisi, 25 (2), pp. 459-473.
Büyüköztürk, Ş. (2002). Sosyal Bilimler İçin Veri Analizi El Kitabı, İstatistik, Araştırma Deseni SPSS Uygulamaları ve Yorum, Pegem Yayıncılık, 3. Baskı, Ankara.
Chen, Y. (2008). The Positive Effect of Green Intellectual Capitol on Competitive Advantages of Firms. Journal of Business Ethics. Vol. 77 (3). pp. 271-286.
Chen, T. B., Chai, L. T. (2010). Attitude towards the Environment and Green Products: Consumers’ Perspective. Management Science and Engineering. Vol. 4 (2). pp. 27-39.
Comrey, A., L. and Lee, H., B., (1992), A First Course in Factor Analysis, (2th Edition), Hillsdale, Lawrence Erlbaum Associates Publishers, New Jersey.
Cross, F. (1990). The Weaning of the Green: Environmentalism Comes of Age in the 1990’s. Business Horizons. Vol. 33. pp. 40-46.
Doll, W. J. Weidong, X., Gholamreza, T., (1994), A Confirmatory Factor Analysis of the End-User Computing Satisfactionİnstrument, MIS Quarterly, 18 (4), pp. 453-461.
Donaton, S. and Fitzgerald, K. (1992). Polls Show Ecological Concern in Strong . Advertising Age. Vol. 63 (3). Fisher, A. (1990), What Consumers Want in the 1990’s. Fortune. Vol. 121. pp. 108-112.
Girdhar, R. and Kahlief, K. (2013). Examining the Environmentally Responsible Consumption Behaviour of University Students. ANVESHAK-International Journal of Management. Vol. 2 (2). pp. 224-232.
Grimmer, M. and Bingham, T., (2013), Company Environmental Performance and Consumer Purchase İntentions, Journal of Business Research, Vol. 66 (10), pp. 1945–1953.
Haytko, D. L. and Matulich, E. (2007). Green Advertising and Environmentally Responsible Consumer Behaviors: Linkages Examined. Journal of Management and Marketing Research. Vol. 1(2).
Jackson, JE. (1983). Measuring The Demand For Environmental Quality With Survey Data. J Polit. pp. 45:335. Aktaran: Diamantopoulos vd. (2003).
Jöroskog, K., B. and Sorbom, D., (1987), SIMPLIS: A Simlified Version of LISREL, Mooresville, IN: Scientific Software, Inc. Kelloway, E., K., (1998), Using LISREL for Structural Equation Modeling: A Researcher’s Guide, Newbury Park, CA: Sage. Kline, R., B., (2005), Principles and Practice of Structural Equation Modeling, New York: Guilford Press.
Line, N., D., Hanks, L. and Zhang L., (2016), Sustainability Communication: The Effect of Message Construals on Consumers’ Attitudes Towards Green Reastaurants, International Journal of Hospitality Management, 57, pp. 143-151.
Maignan, I. and Ferrell, O., C., (2004), Corporate Social Responsibility And Marketing: An İntegrative Framework, Journal of the Academy of Marketing Science, Vol. 32(1), pp. 3–19.
Nakip, M. (2006), Pazarlama Araştırması Teknikler ve (SPSS Destekli) Uygulamalar. Genişletilmiş 2. Baskı. Seçkin Yayıncılık.
Okur, E., Yalçın-Özdilek, Ş., (2012), Yapısal eşitlik modeli ile geliştirilmiş çevresel tutum ölçeği, İlköğretim Online Dergisi, 11 (1), pp. 85-94.
Roberts, J., A., (1196), Green Consumers in the 1990s: and Implications for Advertising, Journal of Business Research Vol. 36, pp. 217-231.
Scott, D and Willits, FK. (1994). Environmental Attitudes and Behavior: A Pennsylvania Survey. Environ Behav. 26(2):239 – 60. Aktaran Diamantopoulos vd. (2003).
Sekaran, U. (2003). Research Methods For Business: A Skill Building Approach, USA: John Wiley & Sons,Inc. Schlossberg, H., (1991), Innovation Seems to Elude "Green Marketers, Marketing News, Vol. 16 (20).
Segars, A., H., Varun, G., (1993), Re-Examining Perceived Ease of Use and Usefulness: A Confirmatory Factor Analysis, MIS Quarterly, 17 (4), pp. 517-525.
Smith, A. M. and O’Sullivan, T. (2012). Environmentally Responsible Behaviour in the Workplace: An İnternal Social Marketing Approach. Journal of Marketing Management Vol. 28 (3–4). pp. 469–493.
Straughan, R. D. and Roberts, J. A. (1999). Environmental Segmentation Alternatives: A Look at Green Consumer Behavior in the New Millennium. Journal Of Consumer Marketıng. Vol. 16 (6). pp. 558-575.
Suki, N., M., Suki, N., M. and Azman, N., S., (2015), Impacts of Corporate Social Responsibility on the Links Between Green Marketing Awareness and Consumer Purchase Intentions, Procedia Economics and Finance, 37 ( 2016 ), pp. 262 –268.
Şimşek, Ö., F., (2007), Yapısal Eşitlik Modellemesine Giriş, Temel Ilkeler ve LİSREL Uygulamaları, Ekinoks Eğitim ve Danışmanlık Hizmetleri, Siyasal Basın ve Dağıtım, Ankara.
Uygun, S., Şahin, Ç., Okur, E., (2010), Study on Development of Sensitivity Scale for Teaching Profession, 2nd International Symposium on Sustainable Development, http://eprints.ibu.edu.ba/408/1/ISSD2010Socialscience_p95-p104.pdfadresinden alınmıştır.
VanLiere, KD. and Dunlap, RE. (1980). The Social Bases Of Environmental Concern: A Review Of Hypotheses, Explanations and Empirical Evidence. Public Opin Q. 44, pp. 181 – 97 (Summer). Aktaran Diamantopoulos vd. (2003).
Vermillion, L., J. and Peart, J., (2010), Green Marketing: Making Sense of the Situation, Proceedings of the Academy of Marketing Studies, Vol. 15(1), pp. 68–72.
Vining, J and Ebreo, A. (1990). What Makes a Recycler? A Comparison of Recyclers and Non-Recyclers. Environ Behav. 22(1): 55 – 73. Aktaran Diamantopoulos vd. (2003).
Winski, J., (1991), Green Marketing: Big Prize, but no Easy Answers. Advertising Age, Green Marketing special report, GR3, Vol. 62.
Van der Zee, B. 2008. Green business, 1st edition: London: Dorling, Kingsley.
Zeidner, M. and Shechter, M., (1988), Psychological Responses to Air Pollution. Some Personality and Demographic Correlates, J Environ Psychol, Vol. 8, pp. 191 – 208, Aktaran Diamantopoulos vd. (2003).