Effect of Foreign Direct Investment on Public
Sector Employment Levels in Kenya
Justo Simiyu
Lecturer, Faculty of Business, Chuka University, Kenya
Peter Kiminza
Lecturer, Faculty of Business, Chuka University, Kenya
Abstract
The purpose of this study was to assess the effect of Foreign Direct Investment on public sector wage levels in Kenya. . FDI in an economy helps in promoting economic efficiency gains into the economy through the transfer of improved technology, managerial skills, organizational techniques, access to foreign markets through channels for marketing products, increasing employment opportunities and wages and improving standard of living. Purposive sampling method was used to select a sample of macroeconomic data on FDI and Public employment levels for 30 years between 1985 and 2014. Error correction model was developed from the data, which was used to make inferences on the relationship between FDI and public employment levels. Inferential statistics were obtained by applying the PcGive Ox-metrics and E-views. Prior tests on unit root were done using Augmented Dickey Fuller (ADF) test and Phillips Perron (PP) tests in comparison with the mackinnon critical value of standard neyman pearson framework. Also co integration was done through the use of Engle – granger (EG) approach and the Johansen Juselius approach to determine whether a long-run relationship exists.
Keywords: Foreign Direct Investment and Public Employment Levels
INTRODUCTION
Background of the Study
According to World Bank (2006) foreign direct investment (FDI) is an investment made by an enterprise or institution based in a country to obtain a sustainable management interest on a company or enterprise based in another country. Such investments take the form of merger and acquisition, which involves acquisition of existing interests, rather than new investments. According to Carkovic and Levine (2002), FDI is defined as involving an equity stake of 10 percent or more at the plant level. Heyman et al. (2007) use 50% cut – off in defining foreign ownership. This implies that for a firm to be regarded as having foreign investment, it has to have more than half its stake owned by foreign owners. Most researchers typically use this cut –off to define foreign direct investment. This study was based upon this definition of involving a foreign ownership of half equity stake of the company. According to Kojima (1975) FDI in an economy helps in promoting economic efficiency gains into the economy through the transfer of improved technology, managerial skills, organizational techniques, access to foreign markets through channels for marketing products, increasing employment opportunities and wages and improving standard of living.
In Kenya the level of FDI in Kenya has been low and stagnant since the year 2000 in comparison to a developing country like Ghana. For example, Ghana achieved higher FDI inflows than Kenya of 3.95 billion dollars in 2013, 4.9 billion dollars in 2012 and 144.9 million dollars in the year 2005. Although there are increased foreign direct investments in Kenya, the FDI levels still are low (Mathew, 2009). The FDI level to percentage of GDP has been ranging less than 0.5% since the year 2010 to 2012. The level of FDI has achieved only 1.55% of GDP in the year 2014, which indicated a small increase from 0.68% in the year 2013. This implies that Kenya achieved a total FDI of 990 million dollars in 2014 which was higher than 500 million dollars in 2013.
Livio (2013) indicated that the public sector share of employment in Canada declined during the 1990s and its growth resumed during the first decade of the 21st century. Specifically, there was a decline in the public sector share of employment starting in 1992, from 26.1 percent to 22.3 percent by 2003. Subsequently, an increase began, with a peak of 24.4 percent reached in 2010 and then a slight decline to 24.1 percent by 2013. The decline in the public sector share of employment in the 1990s was a response to the fiscal crisis brought about by large deficits and debts at both the federal and provincial levels. Public sector employment in Canada recently resumed growing faster than private sector employment. Public sector employment growth may indeed even crowd out private sector employment, leaving unemployment rates either unchanged or possibly higher.
According to Public Service Commission report (2015), the public sector employed an average of 701,000 employees in the year 2014 and 2015. In Kenya, only few workers find jobs in manufacturing, modern and formal firms with adequate technology. Kenya achieved total employment level of 60.3% (11.45 M) in the year 2010, 60.5% (12.12 M) in the year 2011, 60.9% (12.78 M) in the year 2012, 61% (13.52 M) in the year 2013 and 61.2% (14.32 M) in the year 2014 (KNBS report, 2015).
Kenya has experienced a slow growth of public employment levels. The Public employment level has increased by only 1% since 2010 to 2014. Also, Kenya has been experiencing a slow growth of FDI levels of 1.54% since 2010. The slow creation of employment in the public sector in the country stimulated this research to determine whether the slow growth of FDI could be the possible cause. This study therefore sought to determine the effect of FDI on public employment levels in Kenya.
Objective of the Study
The objective was to determine the effect of foreign direct investment on employmentlevels in public sector in Kenya.
MATERIALS AND METHODS
The study used the causal research design. This is a research design which determines the cause- effect relationship between variables. A checklist was used to collect data on FDI and public employment levels. A purposive methodology was used to collect data of between 1985 to 2014.
The data was collected, edited and imported in e-views and ox- metrics for analysis. The first step in the estimation process was to transform the data into natural logarithms to account for the non-linearities in the relationships .Unit root test was then conducted using Augmented Dickey Fuller test (ADF) and Phillip Pheron test (PP) to test the stationarity of the data. Subsequent differencing was done to make the data stationary. Additional terms or length of the lags in the first differences were based on the Akaike Information Criterion [AIC] and the Schwarz Information Criterion [SIC] to whiten the noise process. Determination of the optimal length of the lag was based on the minimum value of AIC and SIC. In other words extra lags [1, 2, 3 …… t-n] were added until the autocorrelation disappears.
Skewness goodness of fit test was used to determine the normality of the data. Skewness is used to determine whether the frequency curve of the distribution is not a symmetric bell-shaped curve making it stretched more to one side than the other thus rendering the data not to be normal (Aczel&Sounderpadian, 2002). Skewness statistic proves that the bell-shaped curve is stretched or not stretched to one side. According to Aczel&Sounderpadian (2002), data is normal and unbiased when skewness statistic is between the range of ±3.
The following Econometric model would be developed to reflect on effects of FDI on public employment levels. This is the model for estimating the economic variables. According to Gujarati (2003), the model estimates variables that have long – run equilibrium relationship.
∆ln ∆ln
Where:
: Public employments levels that is independent of FDI levels
ln FDI : Natural logarithm of Foreign Direct Investments
ln P E : Natural logarithm of Public employments
: Dummy variable for plant level controls : Dummy variable for Political instability
RESULTS
Normality Test
The test was done using skewness
FDI PbE
Mean 1.26E+08 668366.7
Median 54517276 677700.0
Maximum 9.44E+08 715100.0
Minimum 394430.6 574600.0
Std. Dev. 2.09E+08 32265.60
Skewness 2.948397 -1.068885
Kurtosis 10.98835 3.900706
Since the value of skewness for the data of all the variables was in the range of ±3, it implies that the data of all the variables was normal and unbiased.
Unit Root test
Variable LEVEL ADF-Test Statistic Value
Critical Value (5% sig.
level) Status
FDI Level -5.316156 -3.5796 Stationary
Public Employment 2nd difference -5.515646 -3.5943 stationary
The ADF value for FDI was -5.316 indicating that the data was stationary at level form. Public employment had to be differenced twice so as to be stationary with an ADF value of -5.516.
Cointegration Test
Cointegration test is done through the use of Engle – granger (EG) approach and the Johansen Juselius approach. This study used Engle – granger (EG) 2 step approach. The test involved estimating the variables using OLS and then testing whether the residuals of the results are stationary.
Variables Statistic Lag 0 Lag 1 Lag 2 Status
FDI & PbE t- ADF -5.998 -5.125 -4.719 Stationary
AIC -7.484 -7.516 -7.552
Diagnostic Tests Autocorrelation Test
Existence of autocorrelation is not a problem; the problem is the strength of the autocorrelation. A DW of zero implies that there exist positive autocorrelation, while DW of 4 implies high negative correlation level. A DW of value between 2 and 2.5 implies that there is no autocorrelation. A DW value of 2.57 indicated weak negative autocorrelation since the value lies between 2.5 and 4.
Multicollinearlity Test
Existence of multicollinearlity is not a problem; the problem is the occurrence of strong multicollinearlity.A coefficient of determination of 0.5305 and all significant coefficients implied that multicollinearlity is absent. Heteroscedasticity Test
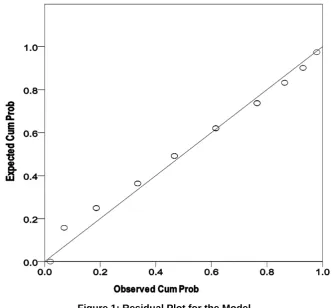
A residual plot was developed as below.
Figure 1: Residual Plot for the Model
The results from the figure showed that the plot of the residual values lied on a straight line. This implied that the variance of the residuals was constant, hence absence of heteroscedasticity.
Error Correction Model
According to (Gujarati, 2003), the model estimates variables that have long – run equilibrium relationship.
Variable Coefficient value Std. error t-value p-value
Constant -0.0537320 2.284e-17 -2.353e+15 0.0000
LNFDI 0.00919364 1.113e-18 8.259e+15 0.0000
DPs 0.0233223 3.249e-18 7.178e+15 0.0000
Residuals 7.95434e-17 1.127e-16 0.706 0.0243
R-squared 0.530484
The computed R-squared of 0.530484 implied that foreign direct investments predicted 53.05% of public employment and 46.95% was predicted by the error term.
The Model indicates that there exists a significant positive relationship between foreign direct investments and public employment levels at 5% significance level since the coefficient of FDI was 0.00919364 and a p – value of 0.00<0.05. The significance relationship existed because the p- value was less than 0.05. An increase in foreign direct investments by one unit increases public employments by 0.00919364 units. A decrease in foreign direct investments by one unit decreases public employments by 0.00919364 units.
This study is consistent with the study by Nicola et al. (2014) who analyzed the relationship between foreign ownership and employment using an original firm level dataset that covers 19 sub-Saharan African countries. The study found that the sectoral composition of the industries was in line with the hypothesis that inward FDI can promote the structural transformation of developing countries’ economies by creating more jobs in the modern sector.
DISCUSSION OF THE RESULTS
The objective involved the analysis of the effect of FDI on the public employment levels in Kenya. The t-statistic test done at 5% significance level showed that increase in FDI levels in Kenya had a significant increase in employment levels in the public sector and a decrease in FDI levels decreases the employment levels in the public with a p-value of 0.00<0.05 and a positive FDI coefficient of 0.00919364. The computed coefficient of determination (R2) was 0.53 implying that FDI levels predicted 53.05% of public employment levels.
The study concluded that there exist a significant positive relationship between FDI level and the public employment levels and 53.08% of FDI level would predict public employment levels. This implies that Increase in FDI levels increases the public employment levels.
The study concluded that the government should increase the level of FDI so as to increase the employment levels in public sector, since there exists a significant positive relationship between the two variables.
REFERENCES
Aczel, A., & Sounderpadian, J. (2002). Business Statistics fifth edition. New York: Irwin: McGraw hill companies.
Amankrah, J. (2014). Youth Unnepmloyment in Ghana. Journal of Labour statistics, 19. Ghana statistical service, Accra, Ghana.
Bera, A. K. & Kim, S.J. (2002), Testing constancy of correlation and other specificationsof the BGARCH model with an application to international equity returns, Journal of Empirical Finance 9, 171-195.
Carkovic, M. & Levine, R. (2002). Does foreign direct investment accelerate economic growth? Journal of economic
growth, university of minesota press, USA.
Granger,C. W. J., & Hatanaka, M. (1964): Spectral Analysis of Economic Time Series, Princeton University Press, USA
Gujarati, D.N. (2003). Basic Econometrics. 4Th Ed. New York: McGraw – Hill Inc.
Heyman, F., Sjöholm, F. & Gustavsson Tingvall, P. (2007). Is there really a foreign ownership wage premium? Evidence from matched employer–employee data. Journal of International Economics 73(2): 355–376.
Mathew, N. (2009). Foreign Direct Investments in kenya, Economic journal, 18. Retrieved from https://mpra.ub.uni-muenchen. de/34155/
Nichola, D. (2014). Foreign direct investment, wages and employment in sub- saharan. United nations industrial org. paper, 36.