R E S E A R C H
Open Access
Automatic and online setting of similarity
thresholds in content-based visual information
retrieval problems
Izaquiel L. Bessas
1, Flávio L. C. Pádua
1, Guilherme T. de Assis
2, Rodrigo T. N. Cardoso
3and Anisio Lacerda
1*Abstract
Several information recovery systems use functions to determine similarity among objects in a collection. Such functions require a similarity threshold, from which it becomes possible to decide on the similarity between two given objects. Thus, depending on its value, the results returned by systems in a search may be satisfactory or not. However, the definition of similarity thresholds is difficult because it depends on several factors. Typically, specialists fix a threshold value for a given system, which is used in all searches. However, an expert-defined value is quite costly and not always possible. Therefore, this study proposes an approach for automatic and online estimation of the similarity threshold value, to be specifically used by content-based visual information retrieval system (image and video) search engines. The experimental results obtained with the proposed approach prove rather promising. For example, for one of the case studies, the performance of the proposed approach achieved 99.5 % efficiency in comparison with that obtained by a specialist using an empirical similarity threshold. Moreover, such automated approach becomes more scalable and less costly.
Keywords: Information retrieval, Content-based retrieval systems, Similarity thresholds
1 Introduction
Nowadays, multimedia databases are applied in vari-ous fields, storing large amounts of data. Thereby, the development of image and video content-based retrieval systems (capable of efficiently managing such data) has increased as well the academic interest in the area [1, 2]. For the development of such systems, some inherent prob-lems must be solved: the selection of appropriate descrip-tors to represent images [1, 3]; the selection of appropriate similarity function to measure the similarity of the images being compared [1, 4]; and the definition of a suitable similarity threshold to be used by the systems [5–9].
The scope of possible techniques to solve the problems involved in the retrieval of content-based visual infor-mation makes necessary to use metrics that can assess the quality of the results obtained by different tech-niques. Such systems recover not only equal but also
*Correspondence: [email protected]
1Computer Science Department, Centro Federal de Educação Tecnológica de Minas Gerais, Av. Amazonas, 7675 Belo Horizonte, Brazil
Full list of author information is available at the end of the article
images similar to the searched image, making it necessary to evaluate responses returned to users. In this regard, some evaluation metrics are commonly used to describe the results obtained on an information retrieval system, namely precision, recall and F1 [10], which are classical metrics commonly used in information retrieval tasks.
After pre-processing input images (consultation), infor-mation retrieval systems compare them to the collection system and categorize them as either similar or dissim-ilar. Such verification is done through a similarity func-tionf, which measures similarity between images. After image comparison, the result of the similarity function is tested against aδsimilarity threshold to determine image similarity (the similarity threshold’s minimum acceptable score [6–9]). Images compared with the input image whose similarity values are greater or equal to δ are considered similar, and the remaining are considered dis-similar. Typically, the values calculated by the similarity functionf and defined for the value ofδsimilarity thresh-old are in a [0,1] range [5]; therefore, the closer the value returned byf is to 1, the more similar such images are.
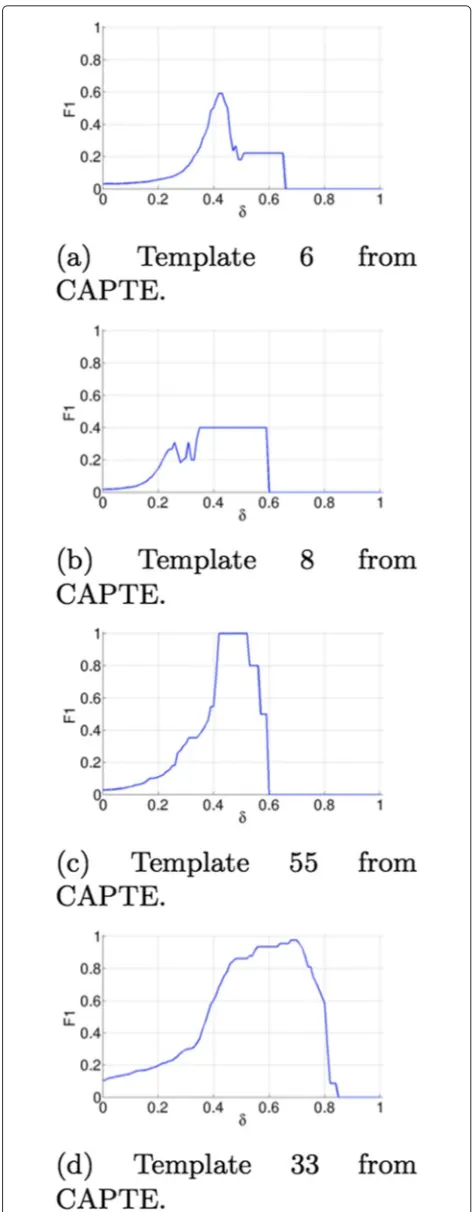
Often, the solutions used to define δ are based on specialist-developed templates for specific searches, aimed at representing the entire collection. For each search, templates compute precision, recall and F1 val-ues, considering differentδ values. In this case,δ values maximizing F1 measurements for the highest number of searches are selected and fed to the information retrieval system. Setting the δ value in this fashion is laborious, making it unfeasible in most cases (mainly because of the need to know the entire collection).
Considering, for example, Fig. 1a, b, c, d displays the results of analysis of four separate (content-based retrieval) searches per image with the SAPTE system (a content-based multimedia information retrieval sys-tem [11, 12] (FLA Conceição, FLC Pádua, ACM Pereira, GT Assis, GD Silva, AAB Andrade: Semiodiscursive Analysis of TV Newscasts based on Data Mining and Image Pre-processing, to appear). For each image anal-ysis result (Fig. 1a, b, c, d), corresponding F1 values are determined for different similarity threshold values. Here, the searched images are part of templates specifi-cally designed to evaluate the system’s performance; such images consist of key frames extracted from Rede Minas TV videos, present in SAPTE.
Figure 1a, b, c, d shows that to obtain the largest F1 value for a given search, a distinctδvalue should also be consid-ered for producing the best results. Therefore, automatic online setting of aδvalue increases search effectiveness.
To automatically estimateδin online applications, this study advocates the use of a metric based on internal cri-teria, possible to calculate without human intervention, as opposed to F1 calculation tied to external criteria and thus impossible to automate. Such metric is the silhouette coef-ficient [13] used to evaluate image clusters returning val-ues within a [−1. . .1] interval (better clusters presenting values closer to 1).
Our approach with automatic and online estimation of the objective similarity threshold through a dynamic sim-ilarity threshold value associated to individual searches enhances the efficiency of content-based visual infor-mation retrieval. More efficient automatic inforinfor-mation retrieval (without human intervention) contributes to generate specific web page repositories, along with improved information retrieval system feedback to users.
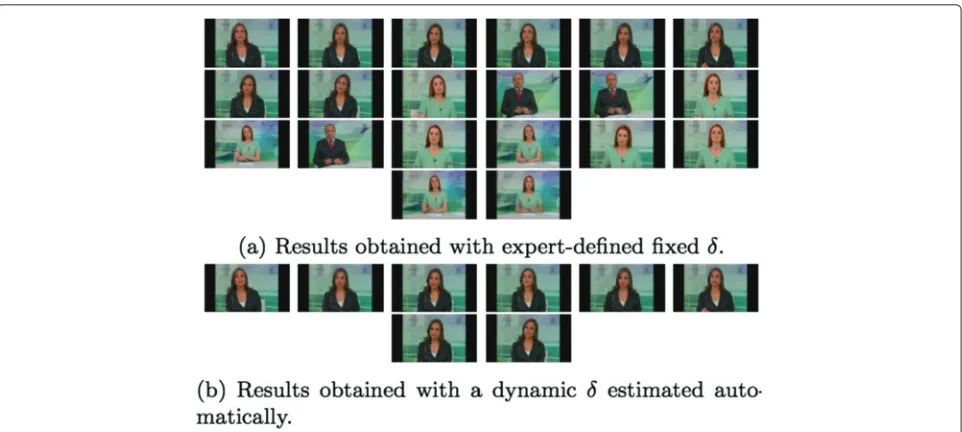
An example of improved search feedback to users is pro-vided by SAPTE systems, as shown in Fig. 2a, b. These respectively represent the response of SAPTE to a given search usingδ=0.83 (expert defined) andδ=0.86 (esti-mated by this study’s approach). In Fig. 2a, the definition of a fixed threshold reached 0.53 in terms of F1 for a spe-cific search, whereas this study’s proposal F1 reached a more efficient 0.89 (Fig. 2b).
The main contribution of the present work consists in to present and validate a new effective and efficient
Fig. 2Results returned by a search held with a fixedδ(expert-defined) and a dynamicδ(estimated automatically)
approach, named automatic setting similarity threshold (ASTS), to automatically estimate similarity thresholds in content-based visual information retrieval (CBVIR) problems. As far as we know, this is the first work in the literature to propose a simple and successful solu-tion for such a problem, which is specially challenging in online applications. We claim that ASTS represents a promising alternative to the current solutions, which are commonly based on specialist-developed templates. Unfortunately, the threshold setting processes of those solutions are prone to human error and demand on sig-nificant time and financial costs. Moreover, even though the aforementioned templates are computed by consid-ering only subsets of specific searches, their application is extended to searches involving the entire dataset, what frequently produces unsatisfactory results to end-users. Unlike those solutions, ASTS is capable to automatically and online estimate similarity thresholds associated to individual searches, enhancing the effectiveness and the efficiency of CBVIR processes.
This paper is organized as follows: Section 2 presents related work. Section 3 presents and discusses our pro-posed approach. Section 4 presents experimental results. Section 5 shows final considerations and future work.
2 Related work
Among studies aimed at improving content-based visual information retrieval systems, this one particularly addresses effectiveness improvement (i.e. system’s quality improvements through search, setting the automatic and online similarity threshold to be adopted).
Previous works outlined (aimed at improving such sys-tems) address the development of techniques solving
several related problems, namely the description mode of images contained in the system [2, 14–16], selection of the best similarity function [4, 17–19], creation of user pro-files [20], machine learning, task clustering and indexing, stochastic algorithms [3, 20–26] and similarity threshold estimation [5–7, 9, 27, 28], the latter being the problem addressed in this paper.
For instance, in [3], the authors present a method that combines a k-means clustering algorithm with a B + tree structure to improve system results obtained through search, returning only images of the closest clus-ters. Another study [22] aims at improved search results. Here, we combine an evolutionary stochastic algorithm (particle swarm optimization) with feedback relevance to understand, by iterative learning, the most relevant features to users and then properly consider the image feature descriptors according to what was learned dur-ing the interaction with the user. In a previous study [21], a two-stepped recovery of multimedia information was developed, with content-based visual information retrieval being performed only in the second stage. The first step consists of searching the collection for a top-K cluster, and only after this, the cluster formation was compared by content-based visual information retrieval. Content-based visual information retrieval occurs on a reduced cluster of the collection, thus enhancing recovery efficiency.
two techniques to reduce human interaction, namely (i) sample use and (ii) similarity cluster process. Hence, the formed groups are used for automatic calculation of recall and precision then that resultant groups contain only objects that represent singular real objects. These clusters identify relevant objects so that when a particular object cluster is used for search, all its remaining objects are labeled relevant. Consequently, this approach gener-ates a table of estimated recall and precision values from which it becomes possible to determine the appropriate similarity threshold for the application. Despite signifi-cantly reducing heavy expert reliance (usual in classical approaches), the proposed approach depends on special-ist intervention to indicate the number of dspecial-istinct objects contained in each sample. This limits the size of gener-ated samples and reduces the number of distinct objects, making it possible for specialists to quantify them.
A new approach [5] combines two strategies to elimi-nate human intervention [28, 29], during the recall and precision values estimation process. They are (i) use of agglomerative hierarchical clustering algorithms and (ii) use of the silhouette coefficient for cluster evaluation. The first form clusters from different similarity thresholds without notifying the number of groups to be gener-ated. Those are evaluated by the silhouette coefficient selecting the cluster with the highest silhouette coeffi-cient value. Expert dependency is thus eliminated from the estimation process of the best similarity threshold and similarity function. This process is based on the premise that selected clusters (according to the validation of the clustering process) properly partition examined objects, meaning that each group represents only one real object. This premise, for example, was very important for the high linear correlation between the silhouette coefficient and F1 formally recorded in [5]. In expert-prepared tem-plates used for recall and precision calculation, subjective external criteria may come into play. The absence of such information during the silhouette coefficient calculation potentially affects the linear correlation between this and F1 values.
In another study [5], the authors obtained relevant results by eliminating human intervention during the esti-mation of static similarity thresholds used by the sys-tem. However, the resultant information was used only as metadata for future similar applications, given the high computational cost of calculating silhouette coefficients, various different clusters and similarity functions for the entire collection (which excludes it from the dynamic def-inition of similarity thresholds). Despite being defined automatically, similarity threshold values remain used as a static similarity threshold, set and fixed for a given application. However, given that different searches may require different similarity threshold values, the definition of a single value for the latter ultimately compromises the
efficiency of searches. Another relevant question regard-ing the use of a sregard-ingle similarity threshold value is that it may lose quality with the addition of new objects to the collection.
Unlike the previous methods, this work proposes an automatic and online approach, named automatic set-ting similarity threshold (ASTS), capable of estimaset-ting the most suitable similarity threshold value in accordance with the silhouette coefficient for individual searches, without any previous knowledge of the collection. The silhouette coefficient, originally proposed in [13] for inter-pretation and validation of consistency within general clusters of data, is used as a simple quality measure of the clustering step of ASTS, allowing the automatic esti-mation of similarity thresholds associated to individual searches. Note that the silhouette coefficient is an inter-nal evaluation measure [30], which does not require an evaluated dataset, i.e. it does not require matching data instances to be known. As a result, our approach does not require human intervention.
3 Proposed approach
When using information retrieval systems, users expect to obtain a set of images somewhat connected with the searched object. Thus, provided answers should match the best image cluster present in the collection (collection images similar to the query). A previous study [13] indi-cates that a silhouette coefficient is a good cluster quality indicator, suggesting that this metric leads to a good F1 value if a good answer is obtained for any given search.
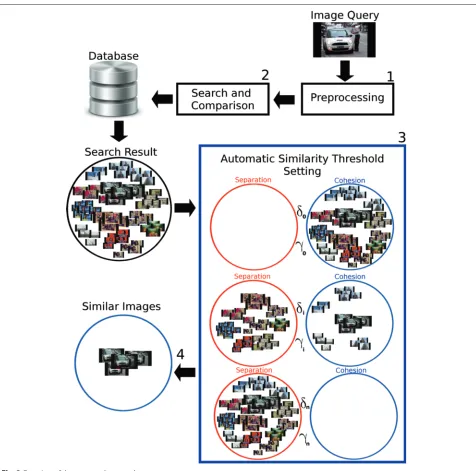
Figure 3 shows the proposed approach for automatic online setting of similarity thresholds. It can be described as follows: during searches, an input image supplied to the search system goes through a preprocessing (module 1) responsible for extracting the image’s signature. A search and comparison (module 2) then analyzes the image sig-natures stored in the repository (database) and compares them with the desired image using a similarity function.
Importantly, the visual signatures of images are based on color, shape and texture information and are estimated by using the method proposed in [12]. In that work, the authors address the development of a unified approach to content-based indexing and retrieval of digital videos from television archives and estimate visual signatures to represent key frames of video recordings. More specifi-cally, by using the method described in [12], we compute a visual signature for each image involved in our problem, containing 79 components (54 refer to color, 18 refer to texture and 7 refer to shape positions).
Fig. 3Overview of the proposed approach
cluster of images initially returned by the search and com-parison module into two clusters: (i) similar and (ii) dis-similar images to the query image. This step is executed by the similarity threshold automatic setting (module 3). The grouping is based on different similarity threshold values (δ0,. . .,δi−1,δi,δi+1,. . .,δn), where the group of similar images contains objects with a degree of similarity greater than theδi similarity threshold value and the dissimilar images contain the remaining ones. Eachδiis thus asso-ciated with a cluster evaluated by a silhouette coefficient (γ). The latter is associated with its correspondingδi. Each
δiassociated with a cluster is hereby also associated with aγi (γ0,. . .,γi−1,γi,γi+1,. . .,γn). Finally, users receive a
group of similar images (module 4) tied to the largest
γi value and to a more appropriate similarity threshold. In other words, it is a cluster of similar images match-ing the group that obtained the best silhouette coefficient evaluation.
Algorithm 1:Proposed approach
Input: query imageiq, silimilarity thresholdδ≈0
Output: Sub-cluster of similar images (Cm) associated with the bestδ
1 Search ofiqwith aδcollection similarity threshold; 2 Response setIfrom the system;
repeat
3 Generate newδvalue;
4 RegroupIaccording toδin a sub-cluster of similar images (Cm) and dissimilar images sub-cluster (Ct); 5 EvaluateCmandCtgenerated fromδ, to obtain the
γ related to this evaluation; untila stop criterion is achieved;
6 Return a sub-cluster of similar images (Cm) associated with the hightestγ value;
This section is arranged as follows. In Section 3.1, we present the complexity analysis of the proposed approach. In Section 3.2, we present the ASTS algorithm, which is used to define the similarity threshold.
3.1 Complexity analysis
Once the silhouette coefficient is calculated for different pairs (δ, [Cm,Ct]), its computational cost is determined considering that the proposal tries to solve the problem online. The computational cost of the similarity thresh-old setting strategy uses a silhouette coefficient function to select the best answer. Algorithm 1 acts as the basis for this strategy cost calculation since it presents the proposed approach.
The operations related to distance calculation between vectors are used here as a metric to determine the com-putational cost of silhouette coefficients, adopting the for-mula used to calculate computational costs, as defined in [13]. The cohesion’s computational cost is given byO(nm− 1), where nm is the amount of images in a Cm cluster, and the computational cost of separation isOKj=1njt
, whereKis the number of groups of dissimilar images (Ct) and nt is the number of images in each group Cjt. The amount of clusters for the proposed approach is always two (one of similar images and other of dissimilar images to the query image). The result (K = 1) thus reduces the separation computational cost toO(nt). The silhouette coefficient calculation cost for a single object isO(nm−1+ nt); the silhouette coefficient calculation cost for cluster equalsOn2m−nm+nt
. The total computational cost is On2mfor each cluster silhouette coefficient calculation. The computational silhouette coefficient is therefore dic-tated by the quantity of images in Cm: the more images in a group, the higher is the computational cost of its silhouette coefficient calculation.
The computational cost of the proposed approach is defined by the number of times the silhouette coefficient calculation is performed. IfNequals the number of times a silhouette coefficient is calculated to define the similar-ity threshold, the proposed approach cost isON×n2m. Thus, our proposed algorithm presents constant run-ning time (apart from silhouette coefficient computation, which presents squared complexity).
Once the computational cost of the silhouette coeffi-cient and the used similarity threshold setting strategy is known, adjustments can be made to achieve a better balance between runtime and effectiveness.
3.2 ASTS algorithm
The ASTS algorithm is a deterministic algorithm designed for automatic setting of similarity thresholds on the basis of a greedy paradigm. It consists of the heuristic used to estimate the best similarity threshold used in image searches (module 3 in Fig. 3). The ASTS is based on two steps: first, different similarity thresholds are explored to evaluate the quality of each one; second, the thresholds close to the best similarity threshold found by step 1 are exploited.
ASTS implementation requires establishing the follow-ing variables:landl– are the lower and upper limits for
δ, respectively;αis the increment value ofltol, which generatesδvalues having the initial exploration function (δ1,. . .,δi−1,δi,δi+1,. . .,δn), andα < (l−l);β evalu-ates the answers closer to the best solution found until then (withβ < α). The operation performed with the aid of β values is made through increases and decreases of theδvalue associated with the best solution. Algorithm 2 details the ASTS operation.
According to Algorithm 2, once input variables (l, l,
α,β) are defined and a set of answers (I) is obtained via an information retrieval system, Eq. 1 generatesδvalues contained within an l to l range (line 1). A cluster is made from eachδvalue (δ1,. . .,δi−1,δi,δi+1,. . .,δn) gen-erated by Eq. 1 so that for each δi, there is a cluster (Cδi
m,Ctδi) (line 3). For each cluster (Cmδi,Ctδi) generated by
δi, a silhouette coefficient (γδi) associated with the clus-ter is calculated reflecting its quality (line 4). This clusclus-ter generator method and respective silhouette coefficient evaluation is repeated for allδ values generated in Eq. 1 (line 2).
Once all solutions generated for the initial operation are evaluated, the solution with the highest γδi value is selected to ensure that it is the best one. The solu-tion is then stored in two clusters with two variables
δbetter+ ,γbetter+ ,δ−better,γbetter− upon which improve-ment is refined by increases and decreases (line 5). Thus, the refining process ofδ+better,γbetter+ is accomplished by increases and decreases inβvalues to the sameβvalue in
Algorithm 2:ASTS Input:I,l,l,α,β Output:R
1 generation of the initialδvalues for exploration of the search space:
/* Creation of clusters for each threshold generated by Eq. 1, being evaluated by the silhouette
coefficient */
2 fortodoδido
3 reassembles the answer setI, acording toδi, into two subgroupsCδi
mandCδti;
4 compute the silhouette coefficientγδito getCmδie Cδi
t ;
end
5 selectsδiassociated with the highestγδi, assigning it to
δbetter+ andγbetter+ ; the same values are assigned toδbetter− andγbetter− ;
/* Refinement of the best similarity threshold found earlier and
defined in δbetter+ and γbetter+ through β
increases */
6 repeat
7 δx=δ+melhor+β;
8 reassembles the answer setIaccording toδxinto two subgroupsCδx
m andCtδx;
9 compute silhouette coefficientγδxto obtainC
δx
/* Refinement of the previous best similarity threshold and defined by δ−better and γbetter− by β decreases */
11 repeat
12 δx=δbetter− −β;
13 reassembles the answer setIaccording toδxinto two subgroupsCδx
16 AssignsRto theCmcluster associated with the greatest value betweenγbetter+ andγbetter− ;
With the best current solution selected, δ values are increased and decreased throughβ. These produce newδx similarity thresholds, which in turn generate new clusters that are evaluated and related toγδxvalues (lines 7, 8, 9, 12, 13, and 14). This procedure is repeated until a certainδx similarity threshold produces aγδx worse than that of the current best solution, i.e.γbetter+ > γxeγbetter− > γxor until and 11). When a better solution is found, it replaces the current best (rows 10 and 15). Identical in their logic, both second and third operations repeat Algorithm 2 blocks (lines 6 and 11, respectively); while the first explores solutions close to the best current solution by similarity threshold increases, the second does so with decreases in the same value.
After finishing exploring solutions close to the initially selected better similarity threshold, Algorithm 2 returns to users a cluster of similar images associated with the highest value ofγ – in rangeγbetter+ andγbetter− .
4 Experimental results
To better present experimental results, this section is divided into four subsections. Section 4.1 describes exper-imental planning. Section 4.3 details the baselines used for performance comparison. Section 4.4 analyzes the linear correlation between F1 and silhouette coefficient metrics. Finally, Section 4.5 presents experimental results obtained by the proposed approach, comparing them against those of the defined baseline.
4.1 Experiment planning
The first experimental step was to select and organize the templates of three collections: “CAPTE” [11, 12], “Corel” [31] and “The INRIA Holidays dataset” [32].
The “CAPTE” collection consists of a set of 575 key frames extracted from 90 video blocks found on 11 TV shows aired on Rede Minas television channel [12]. The CAPTE collection is mainly composed of face images from the mentioned TV shows. The “Corel” collection consists of approximately 10,000 general purpose images, which are then reduced to 202 and distributed among 32 similar images classes manually labeled by researchers [31] (the template that was used in this study). “The INRIA Holidays dataset” collection [32] consists of 1491 gen-eral images separated into 316 semantically similar image classes.
With the collections and respective templates defined and ready to be used, its images were processed, generat-ing a database of image signatures for each one of them. A previously described method [12] was used to estimate images signatures (module 3 in Fig. 3).
results, namely cosine of the θ angle, Manhattan dis-tance, Euclidean disdis-tance, Pearson correlation coefficient and histogram intersection. These similarity functions were chosen because for their low computational cost and workability of the image signatures used.
4.2 Evaluation metric
We use a standard evaluation metric in information retrieval literature:f-measure (F1). This metric is defined in terms of precision (P) and recall (R). Precision is the ratio of the number of correctly returned images to the total number of returned images. Recall is the ratio of the number of correctly returned images to the total number of images that should be returned accord-ing to ground truth information. Finally, F1 measure is defined as the harmonic mean of precision and recall, as given by
F1= 2×P×R P+R
4.3 Baselines
Following, we detail each baseline used for performance comparison.
4.3.1 Threshold impact on performance
With the collections, the image description and the sim-ilarity functions established for each pair [template of a collection/similarity function], we calculated the F1 val-ues associated with different valval-ues of similarity threshold. This threshold was expanded from zero to one, by 0.01 increments.
Hence, it was possible to determine which similarity threshold leads to higher F1 (optimal δbest) for a given search using a specific similarity function. The optimalδ can thus be formally defined in Eq. 2:
δbest=argmaxF1gk,f
δi
, (2)
where gk represents the template related to a particular collection searchk,f is the similarity function used andδi, fori=1,. . .,nrepresents the similarity threshold consid-ered. The optimal delta represents the value of similarity threshold associated with the highest F1 in a given search kfor a specific collection when using similarity functions f. It is expected that optimalδvalues close to the automat-ically set similarity threshold proposed (δγ) produce more effective results.
Figure 4a, b, c presents the cumulative F1 sum reached by each pair [collection/similarity function] for all tested
δ values, representing “CAPTE”, “The INRIA Holidays dataset” and “Corel” collections, respectively.
Figure 4a, b, c also shows that a unique similarity threshold value does not guarantee optimum performance
Fig. 4Curve of the cumulative F1 sum for each pair [f,δ]: similarity functionf; similarity threshold consideredδ
in a content-based visual information retrieval system. However, it can produce satisfactory results if well defined. Through these figures, it is possible to determine similarity thresholds for each similarity function, leading to the system’s greatest cumulative F1 sum. These simi-larity thresholds (fixedδ) form the baseline, as presented in Table 1. Cumulative F1 sum values for each fixedδare used to compare and validate the results achieved with the approach proposed hereby (Table 2).
Table 1Fixedδvalues defined for each pair [collection/similarity function]
f CAPTE INRIA Corel
Cosine of theθangle 0.82 0.96 0.85
Pearson correlation coefficient 0.88 0.97 0.91
Histogram intersection 0.78 0.98 0.69
Euclidean distance 0.40 0.72 0.45
Manhattan distance 0.56 0.70 0.40
4.3.2 k-means analysis
Given that our proposed approach is based on cluster-ing similar images, we investigate the performance of k-means algorithm [33] retrieving relevant images. The k-means algorithm is a classical method for clustering. Here, we represent images by their descriptors and vary the number of clusters (i.e. thek parameter) to evaluate the performance ofk-means when compared to our proposed approach.
Specifically, we start by finding an initial set of images by conducting a query over the whole dataset. Hence, this set is used as input tok-means and a given number of expected clusters (i.e.k parameter). Finally, given the returned clusters found byk-means, we return to the user the cluster of images that have the highest average simi-larity value among the images within the cluster and the input image (i.e. the one used as query).
In Table 3, we present the results of cumulative F1 mea-sure with distinctkvalues. The best results obtained by k-means refer to “Corel” datasets, which is also the best results for our approach (i.e. ASTS) when consideringk equals to 4 and 8. For all testedk values, the proposed approach presents better results than the strong baseline, i.e. thek-means algorithm.
Moreover, the experiments show that as we increase the values of k, the performance of the k-means algorithm also increases. We believe that this happens because as we increase the number of clusters, the precision also increases. Another possibility is that precision increases but recall decreases, which is a well known trade-off in information retrieval literature. We avoid this by limiting the number of generated clusters to avoid empty empty groups of images.
Table 2Cumulative F1 sum for each pair [collection/similarity function] for fixedδvalues set (Table 1)
f CAPTE INRIA Corel
Cosine of theθangle 31.73 211.96 20.68
Pearson correlation coefficient 29.55 207.22 19.65
Histogram intersection 39.18 134.87 21.97
Euclidean distance 31.73 211.10 20.57
Manhattan distance 39.18 216.90 21.92
Table 3Cumulative F1 sum fork-means algorithm with distinct
kvalues
k CAPTE INRIA Corel
k=2 3.9492 6.0073 9.2071
k=4 5.6523 9.6352 14.1657
k=8 - 13.6408 18.3246
We also compare the performance ofk-means algorithm and our proposed approach. For this comparison, we used the cumulative F1 measure and the Euclidean distance as similarity metric. The results are summarized in Table 4. We vary thek values for each query for all datasets and present the mean, standard deviation, absolute F1 values and the relative gains of our approach over thek-means algorithm.
The results presented in Table 4 show that the per-formance of our ASTS algorithm is mostly higher than the performance of the k-means baseline. A different behavior is observed for the “Corel” dataset when con-sideringk = 4 andk = 8. Note that the performance of thek-means algorithm is worst than the performance of our approach when using fixedδ. We observe that our approach presents a better performance than the tested baseline. Besides the lower performance of k-means, it has a disadvantage that the number of clusters needs to be specified beforehand. This can be difficult for large datasets and, as shown in experiments, has consider-able impact on the method’s performance. Contrarily, the proposed ASTS algorithm avoids this problem, which rep-resents an advantage for researchers and practitioners. Finally, we observe that even when keeping fixed values forδ the proposed ASTS algorithm has a higher perfor-mance thank-means algorithm for datasets “CAPTE” and “The INRIA Holidays dataset”.
4.4 Linear correlation
A high linear correlation between F1 and silhouette coef-ficients ensures quality in this approach’s estimations. Therefore, for each collection searched, linear correlation between these metrics was calculated. For all collections, observations revealed both high and low/almost non-linear correlation between the metrics. Only the “Corel” collection obtained results where the linear correlation was less than zero.
Table 4Cumulative F1 sum reached by ASTS andk-means for eachkvalue
CAPTE
kvalue F1 mean Standard deviation Cumulative F1 sum byk-means Cumulative F1 sumk-means relative toδγ
2 0.0658 0.0669 3.9492 13.18 %
4 0.0942 0.1014 5.6523 18.86 %
The INRIA Holidays dataset
kvalue F1 mean Standard deviation Cumulative F1 sum byk-means Cumulative F1 sumk-means relative toδγ
2 0.0190 0.0429 6.0073 3.3 %
4 0.0304 0.0728 9.6352 5.3 %
8 0.0431 0.1125 13.5408 7.5 %
Corel benchmark
kvalue F1 mean Standard deviation Cumulative F1 sum byk-means Cumulative F1 sumk-means relative toδγ
2 0.2877 0.2474 9.2071 86.92 %
4 0.4426 0.3378 14.1657 133.73 %
8 0.5726 0.3562 18.3246 172.99 %
affect cluster evaluation through silhouette coefficient cal-culation. Therefore, a higher or lower linear correlation between F1 and silhouette coefficient may be obtained for different templates of the same collection.
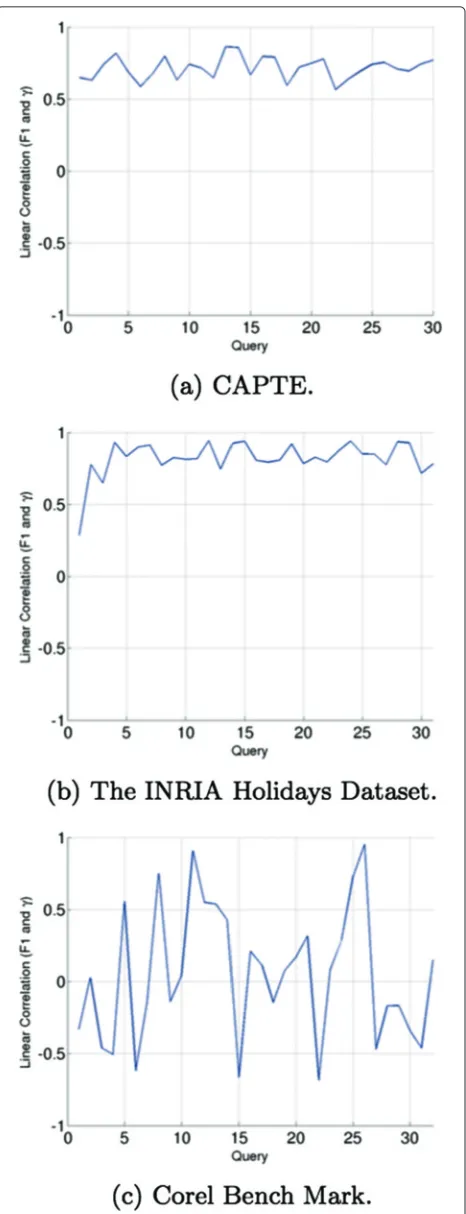
Figure 5a, b, c1maps the linear correlation between such metrics for each search of the “CAPTE”, “Corel” and “The INRIA Holidays dataset” collections. The “CAPTE” col-lection template reveals that 63 % of the searches achieved a linear correlation above 70 %, with an average linear correlation of 54 %. In total, 80 % of the “The INRIA Holidays dataset” templates queries reached a linear cor-relation above 70 %, with an average linear corcor-relation of 78 %. The “Corel” template results were not as good as the first two: only 12 % of the searches attained linear correla-tion results above 70 %, with an average linear correlacorrela-tion of only 5 %.
As previously stated, a satisfactory linear correlation between F1 and silhouette coefficients is not always possi-ble. However, the linear correlation between these metrics may improve: the closer the decision criteria on the simi-larity between images is to that used by experts and by the system, the better the linear correlation between F1 and the silhouette coefficient is. Thus, according to the results obtained in this subsection, a lower efficacy is expected for the “Corel” collection when using the proposed approach.
4.5 Proposed approach evaluation
To evaluate the proposed approach, the ASTS algorithm was implemented and executed for the three collections
and for five defined similarity functions. The evaluation of the retrieval process is the same for all datasets. The input query image is randomly chosen from a given cluster and the ground truth data are the other images that compose the given cluster. The aim is having as high as possible values for precision and recall, which leads to high F1 values.
In [5], the authors conducted a set of experiments to evaluate the correlation between F1 and silhouette coef-ficient metrics, using four similarity functions on six datasets. These experiments demonstrated that, when the silhouette coefficient is highly correlated with the F1, the similarity threshold value that maximizes the F1, on a pair dataset/similarity function, also maximizes the sil-houette coefficient. Based on this result, we can say that a high linear correlation between F1 and silhouette coeffi-cient metrics ensures efficiency in our proposed approach. Therefore, for each collection searched, linear correlation between these metrics was calculated. For all collections, observations revealed both high and low/almost non-linear correlation between the metrics. Only the “Corel” collection obtained results where the linear correlation was less than zero.
Fig. 5Linear correlation between F1 and the silhouette coefficient for each template
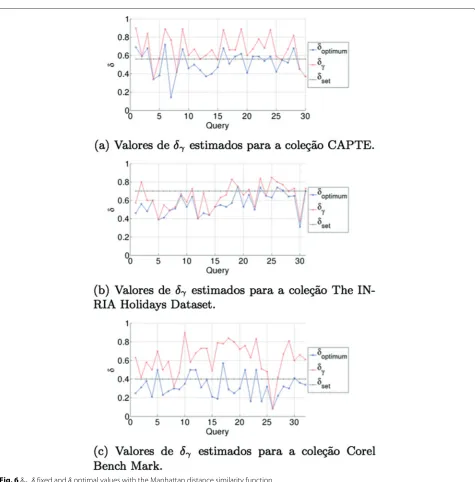
Figure 6a, b shows that ASTS could estimate similarity thresholds (δγ) close toδ optimal values. Such behavior often leads to high F1 values. Figure 6c shows that most of ASTS searches estimatedδγ values distant from optimal
δ(given the linear correlation observed in this collection; see Section 4.4).
To assess result quality of the proposed approach, we compared our cumulative F1 sums with those attained by expert-set fixed similarity thresholds (baseline). Table 5 shows the cumulative F1 sum reached by ASTS, by similarity function used, considering all searches of the same collection. Table 2 presents the ASTS performance achieved by the baseline, in which we present F1 mean, F1 standard deviation, cumulative F1 for k-means and cumulative F1 fork-means relative to a fixed delta.
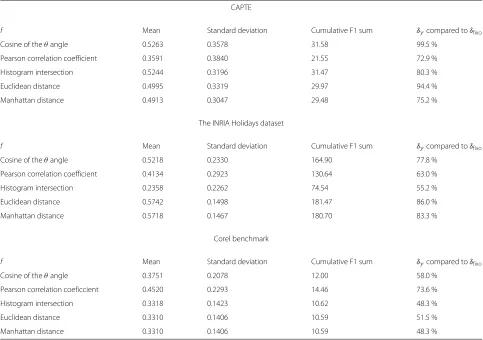
Table 5 shows the collections where ASTS achieved the best results (“CAPTE” and “The INRIA Holidays” dataset). In the “CAPTE” collection, all ASTS-evaluated similarity functions achieved performances greater than 70 % when compared with a cumulative F1 sum for a fixed similarity threshold. In addition, in two other cases, the sums resemble those obtained with a fixed similarity threshold (99.5 and 94.4 %). “The INRIA Holidays dataset” collection also obtained good results, except for the sim-ilarity histogram intersection function, which achieved only 55.2 % of what was achieved with this same func-tion when using a fixed similarity threshold. However, the remaining collection reveals performances superior to 60 %: two cases stood out with 86.0 % (for Euclidean dis-tance) and 83.3 % (for Manhattan disdis-tance). Only one case of the “Corel” collection achieved a performance superior to 70 %.
Fig. 6δγ,δfixed andδoptimal values with the Manhattan distance similarity function
signature. Therefore, the closer the criterion used by specialists is to that used for similarity calculation by similarity functions f, the greater is the linear corre-lation between these measures and the better results become.
We also investigate the computational costs per query. The experiments were implemented in MATLAB and run on a Intel Core i7 2.1 GHz with 32 GB of memory. In Fig. 7, we show the running time for each query as well as the average for the CAPTE dataset2. As we can see, there is variation on running time for each query.
4.6 Parameter sensitivity
In this section, we investigate the impacts of different parameter settings on the overall performance of our method. First, we discuss the sensitivity of theα param-eter, which refers to the number of initial solutions to be searched in the first step of our algorithm. Hence, we dis-cuss the sensitivity of theβparameter, which refers to the number of answers closer to the best solution found at a given interaction.
Table 5Cumulative F1 sum reached by ASTS for each similarity function
CAPTE
f Mean Standard deviation Cumulative F1 sum δγcompared toδfixo
Cosine of theθangle 0.5263 0.3578 31.58 99.5 %
Pearson correlation coefficient 0.3591 0.3840 21.55 72.9 %
Histogram intersection 0.5244 0.3196 31.47 80.3 %
Euclidean distance 0.4995 0.3319 29.97 94.4 %
Manhattan distance 0.4913 0.3047 29.48 75.2 %
The INRIA Holidays dataset
f Mean Standard deviation Cumulative F1 sum δγcompared toδfixo
Cosine of theθangle 0.5218 0.2330 164.90 77.8 %
Pearson correlation coefficient 0.4134 0.2923 130.64 63.0 %
Histogram intersection 0.2358 0.2262 74.54 55.2 %
Euclidean distance 0.5742 0.1498 181.47 86.0 %
Manhattan distance 0.5718 0.1467 180.70 83.3 %
Corel benchmark
f Mean Standard deviation Cumulative F1 sum δγcompared toδfixo
Cosine of theθangle 0.3751 0.2078 12.00 58.0 %
Pearson correlation coeficcient 0.4520 0.2293 14.46 73.6 %
Histogram intersection 0.3318 0.1423 10.62 48.3 %
Euclidean distance 0.3310 0.1406 10.59 51.5 %
Manhattan distance 0.3310 0.1406 10.59 48.3 %
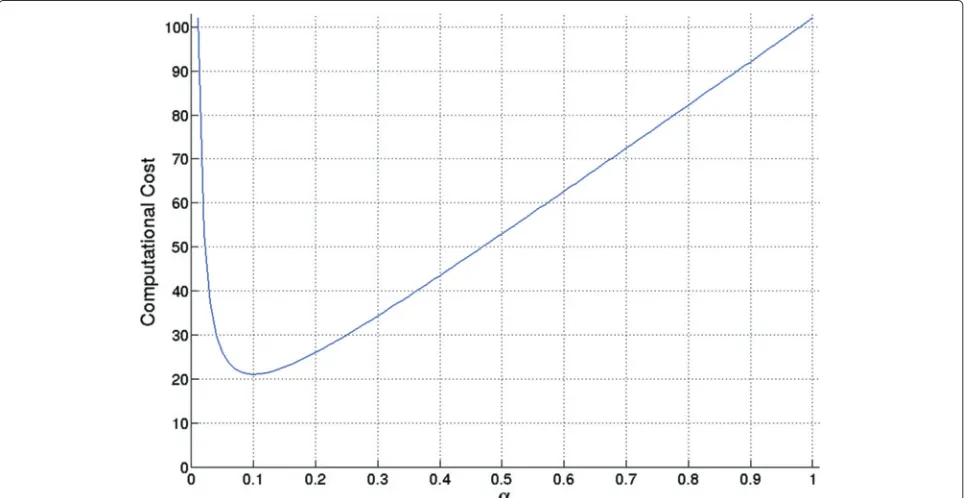
parameter. As we increase theαvalues from 0.1, the com-putational costs also increase, because we are considering more candidate solutions.
Effect of α andβ combinations. In Fig. 9, we investi-gate how different combinations ofα andβ parameters affect computational performance of our ASTS algorithm. When decreasing values ofβleads to more computational costs because we are considering a larger solution space. The opposite is also valid, i.e. increasingβvalues leads to less computational costs because we are considering more restricted regions in solution space.
5 Conclusions
The main challenge of this study is the dynamic and auto-matic setting of an appropriate similarity threshold value to be used in searches of content-based visual informa-tion retrieval systems. To accomplish this, we proposed an approach using a metric silhouette coefficient in which basic principles were implemented through an ASTS algo-rithm (also adopted here).
Performed tests revealed promising ASTS results. For example, the “CAPTE” and “The INRIA Holidays dataset” collections (with the greatest number of images) showed
performance close to 100 %, obtained automatically (with cumulative F1 sums of the proposed approach compared with the baseline cumulative F1 sum). Notably, however, the templates of each collection contained semantically similar images (simple image signature techniques com-bined with similarity functions appropriate to this type of signature), thus producing good results. The techniques used on the “Corel” collection were not sufficient for the image descriptors to properly represent the characteristics that determine image resemblance, thus being irrelevant to the proposed approach.
In general, our approach achieved good results, often reaching high performances very close to those achieved by fixed specialist set similarity thresholds. Such results encourage the continuation of this work, to solve a ques-tion that significantly enhances the quality of content-based visual information retrieval systems.
Fig. 7Computational costs per query for CAPTE dataset
online. Image signatures used hereby are classic models. They work with global characteristic descriptors, describ-ing images with a sdescrib-ingle vector (with low computational cost for both signature calculation and for its comparison through similarity functions). However, such signatures
may not be so effective to describe image signatures work-ing with local features. On the other hand, signature calculation on the basis of local characteristics and the calculation of its similarity (comparison of a set of vec-tors rather than a single vector) have high computational
Fig. 9Computational costs of ASTS algorithm varyingαandβparameters
cost, particularly when compared to techniques working with global characteristics. It is therefore necessary to pre-vent silhouette coefficient computational cost increases, rendering the proposed approach unfeasible.
As future work, we plan to investigate better image rep-resentation as well as appropriate similarity functions to compare their signatures. Such way of representation and comparison directly impacts this proposal’s effectiveness and efficiency. A balance between these two characteris-tics (or the predominance of one over the other) depends on what is expected of the system to which the proposed approach is applied. The improvement of such techniques aims to produce high linear correlation between silhou-ette coefficients and F1s, which will help to generate good results in the information retrieval process.
Endnotes
1Figures concerning the linear correlation for “CAPTE”
and “The INRIA Holidays dataset” collection searches present only a data sample.
2Since results for Corel and INRIA datasets are similar,
we omit these results.
Competing interests
The authors declare that they have no competing interests.
Acknowledgements
The authors gratefully acknowledge the financial support of FAPEMIG-Brazil under Procs. APQ-01180-10 and APQ-02269-11; CEFET-MG under Procs. PROPESQ-088/12, PROPESQ-076/09 and PROPESQ-10314/14; CAPES-Brazil and CNPq-Brazil.
Author details
1Computer Science Department, Centro Federal de Educação Tecnológica de
Minas Gerais, Av. Amazonas, 7675 Belo Horizonte, Brazil.2Computer Science Department, Universidade Federal de Ouro Preto, Morro do Cruzeiro, Ouro Preto, Brazil.3Departamento de Física e Matemática, Centro Federal de Educação Tecnológica de Minas Gerais, Av. Amazonas, 7675 Belo Horizonte, Brazil.
Received: 22 September 2015 Accepted: 16 February 2016
References
1. R Datta, D Joshi, J Li, JZ Wang, Image retrieval: ideas, influences, and trends of the New Age. ACM Comput. Surv.40(2), 5–1560 (2008). doi:10.1145/1348246.1348248
2. MTF Tannús, Comparação de técnicas para a determinação de semelhança entre imagens digitais Master’s thesis, Universidade Federal de Uberlândia (2008)
3. E Yildizer, AM Balci, TN Jarada, R Alhajj, Integrating wavelets with clustering and indexing for effective content-based image retrieval. Knowledge-Based Syst.31, 55–66 (2012)
4. G Chechik, V Sharma, U Shalit, S Bengio, Large scale online learning of image similarity through ranking. J. Mach. Learn. Res.11, 1109–1135 (2010)
5. JB dos Santos, CA Heuser, VP Moreira, LK Wives, Automatic threshold estimation for data matching applications. Inf. Sci.181(13), 2685–2699 (2011). doi:10.1016/j.ins.2010.05.029
6. E Schallehn, K-U Sattler, G Saake, Efficient similarity-based operations for data integration. Data & Knowledge Eng.48(3), 361–387 (2004) 7. M Ortega-Binderberger, Integrating similarity based retrieval and query
refinement in databases. PhD thesis, University of Illinois at Urbana-Champaign (2002)
8. M Ortega-Binderberger, Integrating similarity based retrieval and query refinement in databases. Technical report, University of Illinois at Urbana-Champaign, Champaign, IL, USA (2002)
10. RA Baeza-Yates, B Ribeiro-Neto,Modern information retrieval. (Addison-Wesley Longman Publishing Co., Inc, Boston, MA, USA, 1999) 11. MHR Pereira, CL de Souza, FLC Pádua, G Silva, GT de Assis, ACM Pereira,
SAPTE: A multimedia information system to support the discourse analysis and information retrieval of television programs. Multimed Tools and Appl.74, 10923–10963 (2015)
12. CL de Souza, FLC Pádua, GT de Assis, GD Silva, CFG Nunes, A unified approach to content-based indexing and retrieval of digital videos from television archives. Artif. Intell. Res.3, 49–61 (2014)
13. P Rousseeuw, Silhouettes: A graphical aid to the interpretation and validation of cluster analysis. J. Comput. Appl. Math.20(1), 53–65 (1987) 14. RdS Torres, AX Falcão, Contour salience descriptors for effective image
retrieval and analysis. Image and Vision Comput.25, 3–13 (2007) 15. A Vadivel, AK Majumdar, S Sural, inProceedings of International Conference
on Intelligent Sensing and Information Processing, 2004. Characteristics of weighted feature vector in content-based image retrieval applications, (2004), pp. 127–132. doi:10.1109/ICISIP.2004.1287638
16. T Gevers, AWM Smeulders, PicToSeek: combining color and shape invariant features for image retrieval. IEEE Trans. Image Process.9(1), 102–119 (2000)
17. AD Doulamis, ND Doulamis, Generalized nonlinear relevance feedback for interactive content-based retrieval and organization. Circuits and Syst. Video Technology, IEEE Trans.14(5), 656–671 (2004)
18. S Aksoy, RM Haralick, Feature normalization and likelihood-based similarity measures for image retrieval. Pattern Recogn. Lett.22(5), 563–582 (2001) 19. G-D Guo, AK Jain, W-Y Ma, H-J Zhang, Learning similarity measure for
natural image retrieval with relevance feedback. Neural Networks, IEEE Trans.13(4), 811–820 (2002)
20. M Montebello, inProceedings of the 21st Annual International ACM SIGIR Conference on Research and Development in Information Retrieval. Optimizing Recall/Precision Scores in IR over the WWW (ACM, New York, NY, USA, 1998), pp. 361–362. isbn: 1-58113-015-5
21. A Arampatzis, K Zagoris, SA Chatzichristofis, Dynamic two-stage image retrieval from large multimedia databases. Inf. Process. Manag.49(1), 274–285 (2013). doi:10.1016/j.ipm.2012.03.005
22. M Broilo, De Natale, FGB, A stochastic approach to image retrieval using relevance feedback and particle swarm optimization. Multimed. IEEE Trans.12(4), 267–277 (2010). doi:10.1109/TMM.2010.2046269
23. M Cord, PH Gosselin, S Philipp-Foliguet, Stochastic exploration and active learning for image retrieval. Image and Vision Comput.25(1), 14–23 (2007) 24. N Doulamis, A Doulamis, Evaluation of relevance feedback schemes in
content-based in retrieval systems. Signal Process. Image Commun.21(4), 334–357 (2006)
25. S Tong, E Chang, inProceedings of the ninth ACM international conference on Multimedia. Support vector machine active learning for image retrieval (ACM, New York, NY, USA, 2001), pp. 107–118
26. J-T Horng, C-C Yeh, Applying genetic algorithms to query optimization in document retrieval. Inf. Process. Manag.36, 737–759 (2000)
27. R da Silva, RK Stasiu, VM Orengo, CA Heuser, Measuring quality of similarity functions in approximate data matching. J. Informetrics.1(1), 35–46 (2007) 28. RK Stasiu, CA Heuser, R da Silva, inProceedings of the 17th International
Conference on Advanced Information Systems Engineering. Estimating Recall and Precision for Vague Queries in Databases (Springer-Verlag, Berlin, Heidelberg, 2005), pp. 187–200. isbn: 3-540-26095-1, 978-3-540-26095-0 29. RK Stasiu, CA Heuser, Quality evaluation of similarity functions for range
queries. PhD thesis, Universidade Federal do Rio Grande do Sul (2007) 30. CD Manning, P Raghavan, H Schütze, et. al.,Introduction to information retrieval, vol. 1. (Cambridge University Press, Cambridge, 2008), p. 496 31. Q Lv, W Josephson, Z Wang, M Charikar, K Li, Ferret: a toolkit for
content-based similarity search of feature-rich data. ACM SIGOPS Oper. Syst. Rev. Proc. 2006 EuroSys Conf.40(4), 317–330 (2006)
32. H Jégou, M Douze, C Schmid, Improving bag-of-features for large scale image search. Int. J. Comput. Vision.87(3), 316–336 (2010)
33. CM Bishop,Pattern recognition and machine learning, 1st edn., vol. 1. (Springer, New York, 2006)
Submit your manuscript to a
journal and benefi t from:
7Convenient online submission 7Rigorous peer review
7Immediate publication on acceptance 7Open access: articles freely available online 7High visibility within the fi eld
7Retaining the copyright to your article
![Fig. 4 Curve of the cumulative F1 sum for each pair [f, δ]: similarityfunction f; similarity threshold considered δ](https://thumb-us.123doks.com/thumbv2/123dok_us/886299.1106525/8.595.304.541.89.511/fig-curve-cumulative-pair-similarityfunction-similarity-threshold-considered.webp)
![Table 1 Fixed δ values defined for each pair [collection/similarityfunction]](https://thumb-us.123doks.com/thumbv2/123dok_us/886299.1106525/9.595.57.291.647.731/table-fixed-d-values-defined-pair-collection-similarityfunction.webp)