University of South Carolina
Scholar Commons
Theses and Dissertations
1-1-2013
Food Environment and Birth Outcomes In South
Carolina
Xiaoguang Ma
University of South Carolina
Follow this and additional works at:https://scholarcommons.sc.edu/etd Part of theEpidemiology Commons
This Open Access Dissertation is brought to you by Scholar Commons. It has been accepted for inclusion in Theses and Dissertations by an authorized administrator of Scholar Commons. For more information, please [email protected].
Recommended Citation
Ma, X.(2013).Food Environment and Birth Outcomes In South Carolina.(Doctoral dissertation). Retrieved from
FOOD
ENVIRONMENT
AND
BIRTH
OUTCOMES
IN
SOUTH
CAROLINA
by
Xiaoguang Ma
Bachelor of Medicine Peking University, 2005
Master of Philosophy
The University of Hong Kong, 2007
Submitted in Partial Fulfillment of the Requirements
For the Degree of Doctor of Philosophy in
Epidemiology
Arnold School of Public Health
University of South Carolina
2013
Accepted by:
Angela Liese, Major Professor
Jihong Liu, Committee Member
James Hardin, Committee Member
Guang Zhao, Committee Member
Dedication
This dissertation is dedicated to my brilliant, loving, and supportive wife, to
my exuberant, sweet, and smart little girl, and to my always encouraging and
ever faithful parents and sister. Without your love and support, I could never have
Acknowledgements
The first person I would like to give sincere gratitude is my supervisor Dr.
Angela Liese, who not only provides essential elements to develop my academic
abilities and skills, but also plays an important role in establishing my faith,
thinking and inspiration to scientific researches. I joined her group in 2011
summer. From then, I was absolutely sure that I got on the right track for my
Ph.D. study. No one could imagine how kind and patient she is and how much
guidance and assistance she throws on me. I know I will work independently
some day; however I believe I will never feel lonely because her guidance and
direction will inspire me in a long time maybe forever.
I would like to thank my co-supervisor and friend Dr. Jihong Liu for her
patient and inspirational guidance and suggestions on my Ph.D. study,
dissertation work and also life in Columbia. I really appreciated her help on my
teaching and consulting practicum, and all work related to maternal child health. I
would also like to acknowledge my dissertation committee members, Dr. James
Hardin and Dr. Guang Zhao. Without their valuable comments and feedbacks I
cannot complete my study and dissertation in such a short time. I would like to
thank Dr. Nancy Fleischer for her valuable comments and suggestions on
My next gratitude goes to Timothy Barnes and James Hibbert, the senior
Ph.D. student and GIS expert in our group. I really appreciate their help and
guidance on several projects and my dissertation. I am also grateful to my
previous advisor Dr. Natalie Colabianchi (who has moved to University of
Michigan), colleagues from other departments, including Dr. Bethany Bell from
Department of Education, Dr. Darcy Freedman from Department of Social Work,
Dr. Sarah Battersby, and Mr. Lynn Shirley from Department of Geography, for
their comments on my papers and help on data preparation.
I cannot find words to thank Chao Li and Jiayu Wang, who share every
piece of joy and pain with me and always stand there when I needed. My special
acknowledgement will be given to the teammates from USC Chinese Soccer
Team, the Riverside roommates, and all my friends in USC. Thank all of you for
filling up my best memory in Columbia.
I conduct my consulting practicum and request the data from South
Carolina Department of Health and Environmental Control. I would like to
especially acknowledge Mr. Michael Smith, Dr. Daniela Nitcheva, Mr. Sung-Jun
Kim, and Mr. John Allen for their assistance and help.
My greatest appreciation belongs to my wife Hong who is a Ph.D. student
in Department of Chemistry and Biochemistry, for her endless understanding and
love, with which I have never doubted my chase and future. I would like to kiss
love my little angel Rachel. I always appreciate this gift of love from the God.
Last but not the least, I would like to express my enormous thanks to my
your support and understanding, I cannot even know who I am and what I am
living for. If my mother were with me today, she might well have been pleased
Abstract
An increasing number of studies examined the association between
neighborhood characteristics and birth outcomes. However, the results can be
difficult to compare because of the variety of indicators used to characterize the
neighborhood. As an important neighborhood characteristic, the food
environment is associated with residents’ nutrition status, diet quality, and related
health outcomes. In addition, the food environment has been found to influence
women’s diet quality during pregnancy, which is a key factor in predicting birth
outcomes. However to date, studies on food environment and birth outcomes are
extremely limited.
This study examined the association between food environment
(evaluated by both neighborhood- and individual-level indicators) and birth
outcomes using data from all South Carolina births in 2008-2009. Birth outcomes
were analyzed as continuous outcomes (birth weight and gestational age) and
dichotomous outcomes (low birthweight (LBW) and preterm birth (PTB)). To
facilitate comparison with other studies, a Neighborhood Deprivation Index (NDI)
was used to identify the association between neighborhood characteristics and
birth outcomes.
First, we identified those data associated with the food desert, a
(USDA) characterizing neighborhood income and access to supermarkets, to
evaluate the food environment and its relationship with the birth outcomes. We
found that mothers living in food deserts did not have different birth outcomes
compared to those living in areas with high neighborhood income and easy
access to supermarkets. Neighborhood income is more important than food
access in predicting birth outcomes.
Second, we estimated the association between mothers’ accessibility
(distance to the nearest store) and availability (count of stores within 1 mile
around mothers’ homes) to various types of food outlets and birth outcomes in an
eight-county area in South Carolina. The results suggested that accessibility and
availability of convenience stores were each associated with adverse birth
outcomes. No significant associations were captured for healthy food outlets and
limited service restaurants with birth outcomes.
In the end, we examined the relationship between NDI and adverse birth
outcomes. Propensity score matching (PSM) analyses identified neighborhood
deprivation as associated with increased risk of LBW among non-Hispanic
whites, and with increased risk of PTB among non-Hispanic blacks. However,
random effects logistic regression models identified the association between
neighborhood deprivation and adverse birth outcomes only among non-Hispanic
Table of Contents
Dedication ... iii
Acknowledgements ... iv
Abstract ... vii
List of Tables ... xiii
List of Figures ... xv
List of Abbreviations ... xvi
Chapter 1. Introduction ... 1
Rationale.. ... 1
Conceptual Framework ... 5
Specific Aims ... 6
Research Questions ... 7
Hypotheses... 8
Chapter 2. Literature Review ... 12
Birth Outcomes: Incidence, Definition and Consequences ... 12
Individual-Level Risk Factors of Birth Outcomes ... 14
Neighborhood-Level Risk Factors of Adverse Birth Outcomes ... 17
Neighborhood Deprivation Index and Birth Outcomes... 19
Food Environment and Dietary Intake ... 20
Measures of Food Environment ... 22
Food Environment and Birth Outcomes ... 27
Racial Disparities on Adverse Birth Outcomes ... 29
Chapter 3. Methods ... 33
Study Area ... 33
Study Design ... 34
Food Outlet Data ... 34
South Carolina Birth Certificate Data ... 38
2000 US Census Data ... 41
USDA Food Desert ... 42
Accessibility and Availability of Food Outlets ... 43
Neighborhood Deprivation Index ... 44
Birth Outcomes ... 45
Confounders, Effect Modifiers, and Mediators ... 46
Edge Effects ... 48
Regression Models and Multilevel Analysis ... 48
Propensity Score Matching ... 50
Chapter 4. Food Desert and Birth Outcomes: Effects of Neighborhood Income and Community Food Access ... 62
Abstract…. ... 64
Introduction ... 66
Methods… ... 69
Results….. ... 73
Conclusion ... 81
Chapter 5. Built food Environment and Birth Outcomes in South Carolina ... 85
Abstract…. ... 87
Introduction ... 89
Methods… ... 91
Results….. ... 95
Discussion ... 97
Conclusion ... 102
Chapter 6. Neighborhood Deprivation and Adverse Birth Outcomes in South Carolina ... 108
Abstract…. ... 110
Introduction ... 112
Methods… ... 114
Results….. ... 118
Discussion ... 121
Conclusion ... 125
Chapter 7. Summary ... 135
Validity of Food Outlet Data ... 135
Quality of Birth Certificate Data ... 137
Food Environment Measures ... 138
PSM Method in Birth Outcome Research ... 139
Food Environment and Gestational Hypertension ... 140
Summary of the Findings ... 147
Racial Disparities ... 148
Implications and Future Directions ... 149
Bibliography ... 154
Appendix A. Sample of South Carolina Birth Certificate Questionnaire ... 180
Appendix B. Exemption Letter from the Institution Review Board at University of South Carolina ... 183
List of Tables
Table 2.1 Food environment measures by dimension of access ... 32
Table 3.1 Characteristics of live births in South Carolina (N=123,759) ... 58
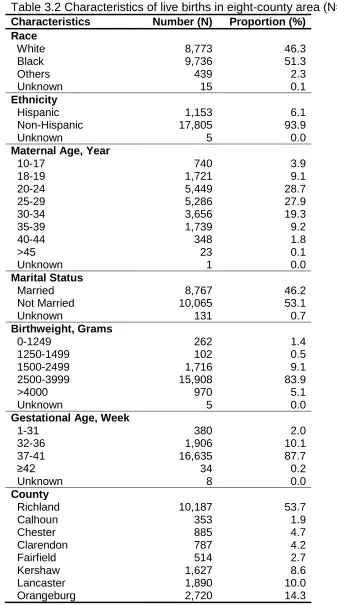
Table 3.2 Characteristics of live births in eight-county area (N=18,963) ... 59
Table 3.3 Summary of missing data in birth certificate data ... 60
Table 3.4 Number of various types of food outlets in eight-county area ... 61
Table 4.1 Maternal and offspring characteristics of live births in South Carolina (2008-2009), according to neighborhood income and food access ... 83
Table 4.2 The association between matrix of income and food access and birth outcomes in South Carolina ... 84
Table 5.1 Characteristics of sample in eight-county area in South Carolina ... 104
Table 5.2 Summary of distance to the nearest food outlet and count of food outlet in 1 mile buffer by food outlet type in eight-county area in South Carolina ... 105
Table 5.3 The association between distance to the nearest food outlet (log-transformed) and birth outcomes in eight-county area in South Carolina .... 106
Table 5.4 The association between count of food outlets in 1-mile buffer (categorical) and birth outcomes in eight-county area in South Carolina ... 107
Table 6.1 Loadings of variables of first principal component from PCA ... 129
Table 6.2 Characteristics of sample by quartiles of neighborhood deprivation index in South Carolina ... 130
Table 6.3 Covariates imbalance across Neighborhood Deprivation Index quartiles prior to and after matching by race in all births 2008-2009 in South Carolina ... 131
Table 6.3 Covariates imbalance across Neighborhood Deprivation Index
Table 6.4 Difference of prevalence of low birthweight and preterm birth between Neighborhood Deprivation Index quartiles after propensity score matching by race in all births 2008-2009 in South Carolina ... 133
Table 6.5 The association between Neighborhood Deprivation Index quartiles and low birthweight and preterm birth from random-effect logistic
regressions by race in all births 2008-2009 in South Carolina ... 134
Table 7.1 The association between matrix of income and food access and
gestational hypertension in South Carolina ... 152
Table 7.2 Distance to the nearest food outlet and number of food outlet in 1 mile buffer by gestational hypertension in eight-county area in South
List of Figures
Figure 1.1 Conceptual frameworks of neighborhood characteristics and birth
outcomes in previous studies ... 10
Figure 1.2 Conceptual framework of food environment and birth outcomes ... 11
Figure 3.1 Study area ... 53
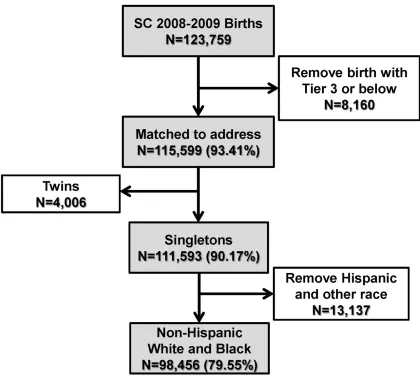
Figure 3.2 Birth certificate data flow for birth in South Carolina ... 54
Figure 3.3 Birth certificate data flow for birth in eight-county in South Carolina .. 55
Figure 3.4 Diagram of data flow of USDA food desert designation ... 56
Figure 3.5 Directed Acyclic Graph in the study ... 57
Figure 4.1 Birth weight (top) and gestational age (bottom) distribution for categories of four-level food desert ... 82
Figure 5.1 Study area with 10-mile buffer zone and food outlets ... 103
Figure 6.1 Distribution of neighborhood deprivation index by race in South Carolina ... 126
Figure 6.2 Distribution of Neighborhood Deprivation Index in South Carolina (Census tract level) ... 127
Figure 6.3 Propensity score overlap by level of neighborhood deprivation for non-Hispanic white (upper panel) and black (lower panel) ... 128
List of Abbreviations
AGA ... Appropriate Size for Gestational Age
BMI ... Body Mass Index
CDC ... Centers for Disease Control and Prevention
CI ... Confidence Interval
DAG ... Directed Acyclic Graph
D&B ... Dun & Bradstreet
DHEC ... Department of Health and Environmental Control
DHHS ... Department of Health and Human Services
ERS ... Economic Research Service
FD ... Food Desert
FFFI ... Fresh Food Financing Initiative
GIS ... Geographic Information System
GPS ... Global Positioning System
HA ... High Access
HFFI ... Healthy Food Financing Initiative
HI ... High Income
IUGR ... Intrauterine Growth Restriction
LA ... Low Access
LBW ... Low Birthweight
LFSFD ... Licensed Food Services Facilities Database
LI ... Low Income
LSA ... Limited Supermarket Access
MSA ... Metropolitan Statistical Areas
NAICS ... North American Industry Classification System
OR ... Odds Ratio
PC ... Principal Component
PCA ... Principal Component Analysis
PRAMS ... Pregnancy Risk Assessment Monitoring System
PSM ... Propensity Score Matching
PTB ... Preterm Birth
Q ... Quartile
RUCA ... Rural Urban Commuting Area
SCAN ... South Carolina Community Assessment System
SD ... Standard Deviation
SEDAC ... Socioeconomic Data and Applications Center
SES ... Socioeconomic Status
SF3 ... Summary File 3
SGA ... Small for Gestational Age
Treasury ... Department of The Treasury
TRF ... The Reinvestment Fund
US ... The United States
USDA ... United States Department of Agriculture
CHAPTER 1
Introduction
Rationale
Approximately 6 million pregnancies occur each year in the United States.
While most women have a full term pregnancy and deliver a healthy infant, a safe
and healthy pregnancy is not experienced by all women. Infant mortality is the
most important indicator of birth outcomes. Infants with adverse birth outcomes
such as low birthweight (LBW) and preterm birth (PTB), are at a greater risk of
dying in infancy (McCormick, 1985; McIntire et al., 1999). LBW occurs in
approximately 1 of every 12 babies born each year in the United States (US), and
it is an important predictor of future morbidity and mortality (JAMA, 2002). PTB
affects more than 500,000, or 12.2% of live births in the United States annually
(Martin et al., 2012). In addition, PTB is a leading cause of infant mortality and
morbidity. Surviving LBW and/or premature infants may face lifelong health
problems (Behrman et al., 2007).
At the individual-level, birth weight (or LBW) has been associated with risk
factors including maternal age (Friede et al., 1987; Valero De Bernabe et al.,
2004), marital status (Holt et al., 1997), health behaviors such as smoking,
socioeconomic status (SES) (O'Campo et al., 2008; Pearl et al., 2001), and
stress (Lesage et al., 2004). While for PTB, known risk factors are multiple
pregnancies, problems with the uterus or cervix (Flynn et al., 1999), maternal
health behaviors such as smoking, alcohol, substance use, and sexual behaviors
(Nordentoft et al., 1996; Peacock et al., 1995; Windham et al., 1995), maternal
infections (Goldenberg et al., 2000), maternal SES factors (Peacock et al., 1995),
and stress (Dole et al., 2003; Nordentoft et al., 1996; Peacock et al., 1995).
Neighborhood-level factors may influence individual-level biological and
behavior factors through a variety of mechanisms which may cause adverse birth
outcomes such as LBW and PTB. In particular, the physical, social and economic
conditions of the neighborhood may have effects on behaviors, stress, nutritional
status, and physical health of the mothers living in the neighborhood which may
result in adverse birth outcomes. Neighborhood factors including income/wealth
(Farley et al., 2006; Masi et al., 2007; O'Campo et al., 2008; Pearl et al., 2001),
employment (Masi et al., 2007; O'Campo et al., 2008; Pearl et al., 2001),
violence and crime (Masi et al., 2007; Messer et al., 2006b; Schempf et al.,
2009), and racial/ethnical composition (Masi et al., 2007; Nkansah-Amankra et
al., 2010b; Reichman et al., 2009; Schempf et al., 2009), were found to be
related to LBW and PTB (Metcalfe et al., 2011). Living in a poor neighborhood
has a negative impact on birth outcomes independent of individual risk factors.
However, the results in these studies could be difficult to interpret and compare
because of the variety of indicators used to characterize the neighborhood
neighborhood characteristics and allow being comparable among these studies.
A standardized Neighborhood Deprivation Index (NDI) was developed according
to Census sociodemographic factors and it may be an appropriate neighborhood
indicator (Messer et al., 2006c).
The built food environment is an important characteristic of the
neighborhood environment. The built food environment has been associated with
dietary intake and various health outcomes such as obesity and hypertension
(Bodor et al., 2008; Franco et al., 2009; Jago et al., 2007; Laraia et al., 2004;
Larson et al., 2009a; Moore et al., 2008b; Morland et al., 2002; Pearce et al.,
2008, 2009). Research found that proximity of supermarkets is positively
associated with diet quality among pregnant women (Laraia et al., 2004).
Nutritional intake during pregnancy is important for fetal growth and development,
and poor nutrition before and during pregnancy has been associated with
adverse birth outcomes (Mitchell et al., 2004; Sram et al., 2005; Wu et al., 2004).
Therefore, the built food environment may influence the dietary intake and
nutritional status among pregnant women, and cause adverse birth outcomes.
Moreover, food environment may be associated with health behaviors such as
tobacco and alcohol use (Gruenewald et al., 1993; Turner et al., 2004), maternal
stress (Laraia et al., 2006), neighborhood and individual SES factors (income,
poverty, employment, population composition etc.) (Hemphill et al., 2008; Seliske
et al., 2009), maternal risk factors such as obesity, chronic and gestational
hypertension and diabetes (Ahern et al., 2011; Bodor et al., 2010; Janevic et al.,
However to date, the studies on food environment and birth outcomes
were extremely limited and the results were inconsistent (Farley et al., 2006;
Lane et al., 2008). Women living in proximity to a supermarket had significantly
fewer LBW births than those living farther away (Lane et al., 2008). While neither
the gestational age nor birthweight-for-gestational-age was associated with
density of alcohol outlets, tobacco outlets, fast-food restaurants or grocery
supermarkets (Farley et al., 2006). All these studies used Census tract-level
measures to characterize the food environment, such as the density or presence
of food outlets in a Census tract. These measures only captured the availability
dimension of the food environment. Studies using the measures with more
dimensions (e.g. accessibility and affordability) are needed. In addition, no
studies examined the individual-level food access and birth outcomes to date.
One of the most well-known health disparities between non-Hispanic
whites and blacks in the United States is that of pregnancy/birth outcomes.
However, the causes of this disparity are unclear so far (Lu et al., 2003).
Previous discussions about individual-level risk factors for adverse birth
outcomes, such as SES, risky behaviors, prenatal care, and stress, could not
account for the racial disparities in pregnancy and birth outcomes (Goldenberg et
al., 1996; Lu et al., 2003). Several studies indicated the racial differences in
access to fast food (Dunn et al., 2012) or healthy food (Bader et al., 2010). The
studies found that non-whites tended to exhibit greater access to fast food, higher
consumption of fast food meals and worse access to healthy food (vegetables
on food access, more and more studies investigated the effects of neighborhood
factors on birth outcomes and tried to explain the racial disparities (Grady, 2006;
Janevic et al., 2010b; Love et al., 2010; Messer et al., 2008; Pearl et al., 2001).
However to date, no studies have examined the racial difference of the
association between food environment and birth outcomes.
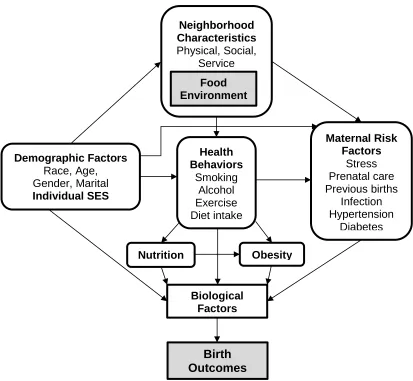
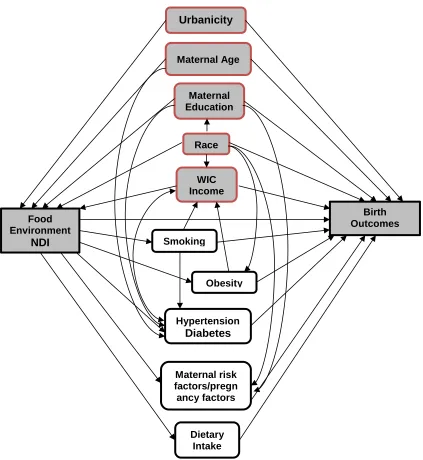
Conceptual Framework
Several conceptual frameworks on neighborhood characteristics and birth
outcomes were established in previous studies (Figure 1.1) (Abu-Saad et al.,
2010; Culhane et al., 2005; Masi et al., 2007; Schempf et al., 2009). Based on
these models, our conceptual framework was drawn in Figure 1.2. The food
environment, a dimension of the neighborhood context, is nested in the
neighborhood with other neighborhood factors. Arrows indicate the connection
from neighborhood environment to biological factors and following birth outcomes
through different pathways. Neighborhood environment has been associated with
health behaviors including dietary intake, smoking and alcohol use, and physical
activity, which might affect biological factors directly or through nutrition and
obesity. The neighborhood environment could also affect maternal risk factors
such as stress, prenatal care, reproductive history, infection during pregnancy,
chronic and gestational hypertension and diabetes. All these risk factors have
been linked to birth outcomes (via biological factors). Demographic and individual
SES factors are related to neighborhood characteristics, and influence health
birth outcomes through biological factors. Based on this conceptual framework,
sociodemographic and neighborhood factors could be considered as the
confounders between food environment and birth outcomes, whereas health
behaviors and maternal risk factors are mediators in the pathway.
Specific Aims
Recent research has suggested that food availability and accessibility
were associated with dietary intake and health outcomes (Bodor et al., 2008;
Franco et al., 2009; Jago et al., 2007; Laraia et al., 2004; Larson et al., 2009a;
Moore et al., 2008b; Morland et al., 2002; Pearce et al., 2009). Nutritional intake
during pregnancy was important for fetal growth and development, and poor
nutrition during pregnancy was associated with birth outcomes (Mitchell et al.,
2004; Sram et al., 2005; Wu et al., 2004). Therefore, deprived food environment
may cause adverse birth outcomes by affecting dietary quality during pregnancy.
Food environment may also be related to health behaviors, stress, SES factors,
and maternal risk factors, which may cause adverse birth outcomes as well
(Bader et al., 2010; Farley et al., 2006). According to the literature, the studies on
food environment and adverse birth outcomes were extremely limited.
Based on US Census 2000 data, commercial and ground-truthed food
outlet data, and birth certificate data covering all live births from 2008-2009 in
South Carolina, this study was sought to examine the association of food
deprivation and birth outcomes. Specifically, aims of the study could be described
as below:
Specific Aim 1. To investigate the association between food desert
dimensions (neighborhood income and food access) and birth outcomes in South
Carolina, and to evaluate whether the associations vary by race.
Specific Aim 2. To examine the association between food access
(accessibility and availability of food outlets) and birth outcomes in eight counties
in South Carolina, and to identify whether the associations vary by race.
Specific Aim 3. To investigate the association between neighborhood
deprivation (NDI) and adverse birth outcomes in South Carolina, and to evaluate
whether the associations vary by race.
Research Questions
Research Question 1. Are the birth outcomes different among the areas
defined by the two dimensions of food desert (high-income and high-access,
income and high-access, high-income and access, and income and
low-access (food desert))? Which dimension of food desert is more important in
predicting birth outcomes, neighborhood income or community food access? Are
the differences differentiated between non-Hispanic white and black mothers?
Research Question 2.Are increased distance to the nearest healthy food
outlet and decreased distance to the nearest unhealthy food outlet associated
with decreased birth weight and gestational age, and increased odds of LBW and
unhealthy food outlets within 1 mile buffer associated with increased birth weight
and gestational age, and decreased odds of LBW and PTB? Are the associations
and differences differentiated among different race/ethnic groups?
Research Question 3.Is neighborhood deprivation (increased NDI)
associated with increased odds of LBW and PTB in South Carolina? Are these
associations different between non-Hispanic white and black women?
Hypotheses
The hypotheses were described below according to research questions:
Hypothesis 1. Births of mothers living in the areas considered to be food
deserts are more likely to be classified as LBW (or decreased birth weight) and
PTB (or decreased gestational age) independent of covariates than those of
mothers living in areas with high neighborhood income and good food access.
The low-income and low-access area (food desert) has the worst birth outcomes,
following by low-income and high-access, and high-income and low-access area,
whereas high-income and high-access area has the best birth outcomes. We
hypothesize that low neighborhood income dimension of food desert plays a
more important role on predicting adverse birth outcomes than low food access
dimension. The associations are different between non-Hispanic white and black
women.
Hypothesis 2. We hypothesize that mothers with longer distance to the
nearest healthy food outlet (e.g. supermarkets, supercenters, grocery stores and
food outlet (e.g. convenience stores, limited service restaurants) are more likely
to deliver a baby with LBW (or decreased birth weight) and PTB (or decreased
gestational age). Mothers with more healthy food outlets (e.g. supermarkets,
supercenters, grocery stores and warehouse clubs) and mothers with less
unhealthy food outlets (e.g. convenience stores, limited service restaurants) in
their neighborhoods are less likely to deliver a baby with LBW (or decreased birth
weight) and PTB (or decreased gestational age). The associations are different
between non-Hispanic white and black women.
Hypothesis 3. The neighborhood deprivation score was higher in
non-Hispanic black women than in non-non-Hispanic white women. Mothers living in
deprived areas are more likely to have LBW and PTB births. Different
CHAPTER 2
Literature Review
Birth Outcomes: Incidence, Definition and Consequences
Approximately 6 million pregnancies occur each year in the United States.
While most women have a normal term pregnancy and deliver a normal infant, a
safe and healthy pregnancy is not experienced by all women. Infant mortality is
the most important indicator to evaluate the birth outcome. Infant mortality is
defined as when an infant dies before he or she is 1 year old. The infant mortality
rate is an estimate of the number of infant deaths for every 1,000 live births. This
rate is often used as an indicator to measure the health and well-being of a
nation, because factors affecting the health of entire populations can also impact
the mortality rate of infants. Unfortunately in the United States, about 25,000
infants die each year (Hoyert et al., 2012).
LBW and PTB are two main predictors of infant mortality. The quality of
gestation is usually evaluated by two measures: length of gestation and birth
weight. Normal term pregnancy lasts between 37 and 41 completed weeks. Less
than 37 completed weeks of gestation is defined as PTB. More than a half million
babies in the United States, which means 1 of 8 births are born premature each
or too early: small-for-gestational-age (SGA) and PTB. SGA is commonly defined
as a weight below the 10th percentile for the gestational age. SGA usually
includes constitutionally small but otherwise normal (e.g. born to parents who are
small and/or into an ethnic population that is smaller than the reference
population), and pathologically growth-restricted which is called the intrauterine
growth restriction (IUGR). IUGR refers to a condition in which a fetus is unable to
achieve its genetically determined potential size. LBW occurs in approximately 1
of every 12 babies born each year in the United States (JAMA, 2002).
PTB and LBW infants are at greater risk for mortality and a variety of
health and developmental problems. Conditions related to PTB and LBW are the
second leading cause of infant death in the United States (after birth defects)
(Mathews et al., 2008). The infant mortality of LBW is approximately 25 times that
of the infant mortality rate of normal birth weight. Likewise, the infant mortality
rate for late PTB (34–36 weeks of gestation) is about three times the infant
mortality rate for normal term birth, and the infant mortality rate for very PTB (less
than 32 weeks of gestation) is about 75 times that of normal term birth (Mathews
et al., 2008). LBW has been linked to several health consequences in adulthood,
including learning problems (Frisk et al., 2002), increased risk of heart disease,
high blood pressure, and type II diabetes (Simeoni et al., 2005). PTB infants
need special care and extra hospitalization after birth and cost the US health care
system more than $26 billion each year (Behrman et al., 2007). PTB may
experience complications such as acute respiratory, gastrointestinal,
infants may face lifelong health problems, including intellectual disabilities,
cerebral palsy, breathing and respiratory problems, and vision and hearing loss
(JAMA, 2002). In addition, the birth of a preterm or LBW infant can have
significant emotional and economic impacts on the infant’s family (Behrman et
al., 2007).
Individual-Level Risk Factors of Birth Outcomes
A variety of factors influence fetal growth, which can be classified into
several categories: factors originating from the fetus, maternal factors, placental
factors and, the factors produced from the interaction of these factors. In general,
it was estimated that approximately 40% of birth weight is due to heredity, and
the remaining 60% to the environmental factors. For instance, mother's birth
weight has been associated with infant birth weight in early years (Ounsted et al.,
1968). The influence of the mother’s birth weight is greater than that of the
father’s. A number of studies had identified the association between maternal
age and birth weight. Studies showed that the incidence of LBW increased in
extremes of maternal age; that is, between 15-19 years and between 35-40 years
old (Friede et al., 1987; Valero De Bernabe et al., 2004). However, the increased
risk of LBW might be due to the related risk factors rather than maternal age self.
For instance, most adolescent mothers are with risk factors for birth outcomes,
including being single, with low income and with inadequate prenatal care (Roth
et al., 1998), which may cause adverse birth outcome. Older women have a
hypertension and diabetes (Cnattingius et al., 1992). Marital status is another
important risk factor of LBW. In Holt et al.’s study, they examined the effect of
change of marital status on LBW between two births. They found that women
who were married during the first pregnancy had a lower incidence of LBW than
single mothers, whereas the risk of LBW increased if they separated during the
second birth compared to those remained married (Holt et al., 1997). However,
there were many confounders in this research. The age increased between two
births and separation might impact the mother’s stress level and other health
behaviors.
SES factors, such as maternal education, income, and occupation, have
been linked to birth weight in a large number of studies (Aach et al., 1980; Millar
et al., 1998; Valero De Bernabe et al., 2004). Women with higher SES levels
were less likely to give births with LBW. Health behaviors such as smoking,
alcohol use, substance use and sexual behaviors were also associated with birth
weight (Chomitz et al., 1995). Smoking during pregnancy leaded to
approximately 200 grams less of birth weight than no smoking (Bouckaert, 2000;
Haustein, 1999). The evidence on alcohol consumption was not as strong as
cigarette smoking, however, many studies reported that there was often
concurrent consumption of tobacco, alcohol and other drugs (McFarlane et al.,
1996). Maternal stress was also a risk factor of LBW. Studies showed that
continuous stress during the pregnancy could decrease the length of gestation
In addition to the sociodemographic factors, malnutrition was an important
predictor of birth weight (Mitchell et al., 2004; Sram et al., 2005; Wu et al., 2004).
In a case-control study of 844 cases (SGA) and 870 controls (appropriate size for
gestational age (AGA)), mothers of AGA infants ate significantly more servings of
carbohydrate rich food and fruit, and were more likely to have taken folate and
vitamin supplements than mothers of SGA infants (Mitchell et al., 2004). Sram et
al. confirmed the effect of folate on birth weight that folate has potential to
decrease the risk of IUGR in European population and LBW in smoking
European mothers (Sram et al., 2005). Medical risk factors such as hypertension,
renal diseases, diabetes, asthma, and obstetrical history, and health care pre-
and during pregnancy could also affect the birth weight (Demissie et al., 1998;
Deshmukh et al., 1998; Easterling et al., 1991; Fink et al., 1998; Mandelson et
al., 1992; Valero De Bernabe et al., 2004).
Previous studies have claimed that the risk factors are shared but not
identical between LBW and PTB (Lang et al., 1996). Known risk factors for PTB
are multiple pregnancies, problems with the uterus or cervix (Flynn et al., 1999),
maternal health behaviors (smoking, alcohol, substance use, and sexual
behaviors) (Nordentoft et al., 1996; Peacock et al., 1995; Windham et al., 1995),
maternal infections (Goldenberg et al., 2000), low maternal SES (Blumenshine et
al., 2010; Peacock et al., 1995), and stress (Dole et al., 2003; Nordentoft et al.,
1996; Peacock et al., 1995). In a meta-analysis, Flynn et al. concluded that
bacterial vaginosis is an important risk factor for prematurity (Flynn et al., 1999).
associated with PTB based on 1,513 women in Peacock’s study (Peacock et al.,
1995). Intrauterine infection was identified to be related with preterm delivery by
Goldenberg et al. (Goldenberg et al., 2000).
A number of studies have examined the association between individual
SES factors and adverse birth outcomes. There were also several systemic
review studies on this topic since 1980s (Blumenshine et al., 2010; Kramer,
1987; Kramer et al., 2000). Most of the studies reported a significant association
between an SES measure and adverse birth outcomes. Many studies observed
racial/ethnic differences in the effect of SES measures. The individual-level SES
factors were not the main focus of this study, thus we will focus on
neighborhood-level risk factors in next section.
Neighborhood-Level Risk Factors of Adverse Birth Outcomes
More and more studies examined the association between
neighborhood-level risk factors and birth outcomes. Early studies examining these associations
tended to be ecological in design, while recently conducted work has included
multilevel studies which examine the impact of neighborhood-level variables on
birth outcomes after controlling for individual-level variables. Several studies
found that neighborhood-level income was associated with lower birth weights
(Cubbin et al., 2008; Finch et al., 2007; Masi et al., 2007; Metcalfe et al., 2011;
Pearl et al., 2001), while other studies did not find the association (Grady, 2006;
Reichman et al., 2009; Sellstrom et al., 2007). Pearl et al. found that in addition to
socioeconomically advantaged may differentially influence birth weight,
depending on women's ethnicity and nativity (Pearl et al., 2001). Less favorable
neighborhood socioeconomic characteristics were associated with lower birth
weight among Blacks and Asians but not among Whites, US-born Latinas, or
foreign-born Latinas. In a meta-analysis on neighborhood income and LBW,
Metcalfe et al. found that women living in low income areas defined based on
federal poverty level had 11% higher odds of having LBW infants than those
living in high income areas (odds ratio=1.11, 95% confidence interval: 1.02, 1.20)
(Metcalfe et al., 2011). Cubbin et al. conducted a study in two geographic areas
on neighborhood-level income and birth weight, Florida and Washington, and
found a null effect in Washington, and a positive association in Florida (Cubbin et
al., 2008). In Masi et al.’s study, neighborhood violent crime rates were found to
explain the variance in birth weight (Masi et al., 2007). Findings on racial
compositions of neighborhoods and birth weight were inconsistent. Finch et al.
found that living with residents from the same ethnicity was found to be protective
against lower birth weights (Finch et al., 2007); however, Grady found that
residential segregation was associated with LBW (Grady, 2006). Moreover,
studies also found that ethnic diversity had a negative impact on birth weight
(Reichman et al., 2009). Several studies have reported that neighborhood
unemployment rate was associated with a reduction in birth weight (Masi et al.,
2007; Pearl et al., 2001).
Studies on neighborhood factors and PTB are a little limited and most of
Caucasian or Hispanic women (Kaufman et al., 2003; Masi et al., 2007; Messer
et al., 2006a; O'Campo et al., 2008; Pickett et al., 2002). Messer et al. and
Kaufman et al. found that living in less deprived or higher income neighborhoods
was associated with an increased risk of PTB among African-American but not
Caucasian women (Kaufman et al., 2003; Messer et al., 2006a). Masi et al.
concluded that living in an economically disadvantaged neighborhood put
African-American women, but not Caucasian or Hispanic women, at an increased
risk of having a PTB (Masi et al., 2007). O’Campo et al. reported the association
between neighborhood deprivation and risk of PTB in both African-American and
Caucasian women (O'Campo et al., 2008). Pickett et al. indicated that
African-American women were at an increased risk of PTB if they lived in neighborhoods
at the highest or the lowest ends of the median neighborhood income, whereas,
living in neighborhoods at the extreme ends of high or low male employment was
associated with decreased odds of PTB (Pickett et al., 2002).
Neighborhood Deprivation Index and Birth Outcomes
Although the neighborhood factors have been associated with birth
outcomes among many studies, the results can be difficult to interpret and
compare because of the variety of indicators used to measure the neighborhood
context. In 2006, Messer et al. developed a standardized Neighborhood
Deprivation Index (NDI) to evaluate the neighborhood deprivation and reported
the association between the index and adverse birth outcomes (Messer et al.,
data to weigh the final index. This approach was well accepted by the
researchers in reproductive health, and the index was used and linked to several
birth outcomes (Elo et al., 2009; Janevic et al., 2010b; O'Campo et al., 2008). Elo
et al. identified the association between the NDI and SGA. They reported that
one standard deviation increase in the deprivation score was associated with
1.15 and 1.09 times the odds of SGA among Hispanic whites and
non-Hispanic blacks, respectively. The association between neighborhood deprivation
and SGA did not vary significantly by race/ethnicity (Elo et al., 2009). The
association between NDI and PTB was examined in O’Campo et al.’s study.
They demonstrated that increased NDI was associated with increased risk of
PTB. The associations were much stronger among non-Hispanic whites than
among non-Hispanic blacks (O'Campo et al., 2008). Based on the birth certificate
data in New York City, Janevic et al. examined the effect of neighborhood
deprivation on both PTB and LBW. Women in the highest quartile of NDI (most
deprived) were more likely to give PTB births and term LBW births. The greatest
magnitude of the association was found among Hispanic Caribbean women for
PTB and among African women for LBW (Janevic et al., 2010b).
Food Environment and Dietary Intake
Good nutrition is vital to good health, disease prevention, and essential for
healthy growth and development of children and adolescents. The nutrition status
of the individuals is not only influenced by their eating habits and dietary
to stores that sell healthy food, especially high-quality fruits and vegetables
(Larson et al., 2009b). Individuals living in such communities might have limited
access to healthy food (Larson et al., 2009b). In addition, rural communities often
have a higher number of convenience stores, where healthy foods are less
available and unhealthy foods are the main food options.
The neighborhood food environment has been associated with dietary
intake and health outcomes (Bodor et al., 2008; Franco et al., 2009; Jago et al.,
2007; Laraia et al., 2004; Larson et al., 2009a; Moore et al., 2008b; Morland et
al., 2002; Pearce et al., 2008, 2009). However, a large number of Americans
have limited access to healthy foods, especially those living in urban areas where
there is a dearth of supermarkets (Morland et al., 2002). In a study examining
food environment and recommended dietary intake, Morland et al. found that fruit
and vegetable intake increased 32% in black Americans for each additional
supermarket in the Census tract. They also found an 11% increase for white
Americans though the results were not statistically significant (Morland et al.,
2002). Based on a sample of 102 households, Bodor et al. found that better
availability of fresh vegetables was associated with higher intake of vegetables,
however, the better availability of fruits was did not improve the intake of fruits
(Bodor et al., 2008). Moore et al. confirmed the above associations between food
environment and dietary intake for supermarkets by both GIS-based and survey
of perception measures. They claimed that people with no supermarkets within 1
mile around their home were 25-46% less likely to have a healthy diet, and
have a healthy diet than those in the best-ranked food environments (Moore et
al., 2008b). Prevalence of convenience stores and fast food restaurants were
also found to relate to dietary intake. Jago et al. found that living far away from a
small food store (convenience and drug store) was associated with increased
fruit and juice and low fat vegetable consumption, while living near fast food
restaurants was associated with increased high fat vegetable and fruit and juice
consumption among adolescents (Jago et al., 2007).
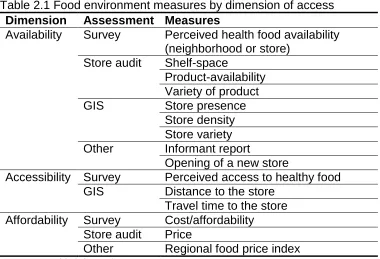
Measures of Food Environment
More and more studies have examined the effects of built food
environment on health behaviors and outcomes in the past decade. How to
characterize food environment is a challenge in research about food environment
and health outcomes. Food environment measures could be grouped by
dimension of food environment (availability, accessibility, and affordability), by
methods of assessment (Geographic Information System (GIS), survey, store
audit, and other), or by level of evaluation (neighborhood level and individual
level). The main measures were summarized in Table 2.1 by dimension of food
environment and methods of assessment.
Food environment has three dimensions, availability, accessibility, and
affordability of the food. Availability refers to the adequacy of the supply of
healthy food. The examples might include the presence of certain types of food
outlets around residents’ homes, and sometimes the term is also used to
dimension of accessibility may be more inherently geographic, as it refers to the
location of the food supply and ease of getting to that location taking account of
resident transportation resources and travel time, distance, and cost. Affordability
refers to the cost, and is often measured by store audits of specific foods, or
regional price indices (Caspi et al., 2012).
Most studies have characterized food environment using measures such
as number of food outlets in the area, density of food outlets, and distance to
specific food outlets based on geographic technique, i.e. GIS. More recently,
questionnaires were used in the surveys to evaluate the food environment, in
which perceptions of food environment could be measured to provide more
subjective information (Moore et al., 2008a; Moore et al., 2008b). Compared to
surveys on individuals, GIS was capable to define the food access in both
individual- and neighborhood-level. Taking the studies among pregnancy and
birth outcomes for example, individual-level food access include distance to the
nearest special food outlet and number of food outlets around a special buffer
size of the residence address (Laraia et al., 2004). Neighborhood-level measures
may include the density and number of type of food outlet in an area, i.e. in a
Census tract (Farley et al., 2006), and if there is a specific food outlet in the area
(Lane et al., 2008). Survey-based measures captured different dimension of the
food desert. In some context, perception-based measures may be more efficient
to capture the variation in food outlet availability and quality than other measures.
However, perception-based measures are more likely to be affected by individual
characterizations of the local food environment and found that perceptions of
food environment were reliable but not identical compared to GIS-based
measurement (Echeverria et al., 2004; Freedman et al., 2009; Moore et al.,
2008a).
Community Food Access Measures
Improving access to healthy and affordable food is an explicit goal of
several federal policy initiatives in the United States. These include the Healthy
Food Financing Initiative (HFFI) which is a partnership of the Department of
Agriculture (USDA), Department of The Treasury (Treasury), and Department of
Health and Human Services (DHHS) ("Healthy Food Financing Initiative," 2011),
and other initiatives such as the Pennsylvania Fresh Food Financing Initiative
(FFFI) ("Pennsylvania Fresh Food Financing Initiative (FFFI)," 2010), and the
initiatives from the Centers for Disease Control and Prevention (CDC)
("Communities Putting Prevention to Work," 2011). To identify areas eligible for
these federal support initiatives, these agencies have developed different
measures of community food access, including the food desert (FD) by USDA
(Ver Ploeg et al., 2009), healthier food retail tract by CDC ("Children's food
environment state indicator report, 2011," 2011; "State indicator report on fruits
and vegetables, 2009," 2009), and limited supermarket access area (LSA) by the
Reinvestment Fund (TRF) ("Searching for markets: the geography of inequitable
The term “food desert” was first used in the early 1990s in Scotland by a
resident of a public housing sector scheme (Cummins et al., 2002). In the United
States, the Obama Administration released an over $400 million HFFI in
February 2010 ("Healthy Food Financing Initiative," 2011), which aimed to bring
grocery stores and other healthy food retailers to underserved urban and rural
communities across US. The initiative is a partnership between the Departments
of Treasury, Agriculture, and Health and Human Services. To identify areas
eligible for this federal support initiative, HFFI group developed a spatial food
access measure called food desert. The food desert is defined as a low-income
Census tract where a substantial number or share of residents has low access to
a supermarket or large grocery store ("Food Desert Locator documentation,"
2010). A tract is considered as low-income if 20 percent or higher of residents
live below the poverty line, or the tract’s median family income is less than or
equal to 80 percent of the State-wide median family income, or the tract is in a
metropolitan area and has a median family income less than or equal to 80
percent of the metropolitan area's median family income. A tract is considered as
low-access if at least 500 people and/or at least 33 percent of the Census tract's
population reside more than 1 mile (for urban tracts) or 10 miles (for rural tracts)
from a supermarket or large grocery store ("Food Desert Locator documentation,"
2010).
In March 2013, USDA ERS (Economic Research Service) uploaded the
most recent version of low food access locator named the Food Access
tracts in new version are largely the same as methods used in previous
estimates. However, there are several differences. First, the new analysis uses
2010 Census tract geography, while previous estimates used 2000 Census tract
geography. Second, the 2010 analysis uses 0.5 kilometer-square grids to
estimate distances from supermarkets, whereas the previous analysis used
1-kilometer-square grids. Third, a new method for designating whether a Census
tract is urban or rural is used. In new version, the population-weighted centroid
was used to designate a Census tract as urban or rural. Based on the new
version of low food access locator, there are 29,134 low-income tracts, 28,328
low-access tracts, and 8,894 food-desert Census tracts (both low-income and
low-access) in the continental US ("Food Access Research Atlas
documentation," 2013).
In CDC’s report “state indicator report on fruits and vegetables” in 2009
("State indicator report on fruits and vegetables, 2009," 2009), they presented an
indicator to evaluate the availability of healthier food retail in communities,
“percentage of Census tracts that have healthier food retailers located within the
tract or within 0.5 miles of tract boundaries”. In the United States, about 72%
Census tracts have healthier food retailers within the boundaries. Based on this
percentage indicator, a community food access measure called non-healthier
retailer tract could be defined as the Census tract that do not have healthier food
retailers located within the tract or within 0.5 miles of tract boundaries. The
healthier food retailers include supermarkets, large grocery stores, warehouse
USDA food desert discussed above, CDC non-healthier retailer tract focuses only
on access to healthy stores rather than poverty/median income of the tracts. This
food access measure is much easier to compute methodologically.
TRF defines the LSA areas as the areas in which residents must travel
significantly farther to the nearest full-service grocery store than residents of
areas showing similar population density and car-ownership characteristics as
well as median household incomes greater than 120% of the area median
("Searching for markets: the geography of inequitable access to healthy &
affordable food in the United States," 2012). An estimated 24.6 million Americans
live in areas with inadequate access to supermarkets, according to TRF's 2011
LSA analysis ("Searching for markets: the geography of inequitable access to
healthy & affordable food in the United States," 2012). No studies so far
examined the effects of food desert on health outcomes, particularly on birth
outcomes.
Food Environment and Birth Outcomes
Only one study to date has examined the association between food
environment and diet quality among pregnant women (Laraia et al., 2004). Laraia
et al. found that proximity of supermarkets was positively associated with diet
quality among pregnant women. In particular, they found pregnant women living
greater than 4 miles from a supermarket were more than twice the odds of falling
into the lowest compared to highest diet quality index tertile compared to women
characteristics, other food retail outlets (Laraia et al., 2004). Nutritional intake
during pregnancy is important for fetal growth and development, and poor
nutrition before and during pregnancy is associated with adverse birth outcomes
(Mitchell et al., 2004; Sram et al., 2005; Wu et al., 2004). Therefore, deprived
food environment may cause adverse birth outcomes by affecting dietary quality.
Food environment may also be related to health behaviors (smoking, alcohol and
substance use, sexual behavior) (Gruenewald et al., 1993; Turner et al., 2004),
stress (Laraia et al., 2006), SES (income/wealth, employment, population
composition and et al) (Hemphill et al., 2008; Seliske et al., 2009) and diseases
risks (obesity, maternal diseases and infections during pregnancy) (Bodor et al.,
2010; Janevic et al., 2010a), which may cause adverse birth outcomes as well.
However to date, the studies on food environment and birth outcomes
were extremely limited (Farley et al., 2006; Lane et al., 2008). After merging birth
data and existing sources on neighborhood SES, neighborhood physical
deterioration, and neighborhood density of retail outlets selling tobacco, alcohol
and foods, Farley et al. examined the relationship between adverse birth
outcomes and neighborhood environment including retail outlets selling food.
However, they did not identify any significant associations of gestational age or
birthweight-for-gestational-age with density of alcohol outlets, tobacco outlets,
fast-food restaurants or grocery supermarkets (Farley et al., 2006). This may be
because the researchers did not have appropriate measures of food
environments in this study. Only one tract-level measure, density of food outlets,
does not fully account for food access and the neighborhood analysis on this
measure will ignore the variance between individuals. A later study by Lane et al.
demonstrated a positive relationship that women living in proximity to a
supermarket had significantly fewer LBW births than those living farther away.
Similar to Farley’s study above, the food environment in this study was also
evaluated by tract-level measure (with or without supermarkets in the tract) (Lane
et al., 2008).
Racial Disparities on Adverse Birth Outcomes
Pregnancy and birth outcomes can vary greatly by maternal race/ethnicity.
Black women have consistently worse outcomes than white women. Since 1940,
mortality ratios among blacks have been at least three to four times higher than
those for whites (Chang et al., 2003). For risk of dying from complications of
pregnancy only, the risk has consistently been 3-4-fold higher for black women
(Callaghan, 2012). In 2009, the prevalence of pregnancy-associated
hypertension was 46.1 per 1,000 live births for Non-Hispanic white compared to
50.2 per 1,000 live births for Non-Hispanic black. The rate of LBW was 7.2% for
Non-Hispanic white and 13.6% for Non-Hispanic black in the United States in
2009. For PTB, Hispanic white experienced a rate of 10.9% and
Non-Hispanic black had a rate of 17.5% (Martin et al., 2012).
However, the causes of this disparity are unclear so far (Lu et al., 2003). A
study showing that African-born black infants have similar birth weight to
determinant for this racial difference in the United States (David et al., 1997).
Previous discussions about individual-level risk factors for adverse birth and
pregnancy outcomes, such as SES, risky behaviors, prenatal care, and stress
have identified that these factors could not account for the racial disparities in
pregnancy and birth outcomes (Goldenberg et al., 1996; Lu et al., 2003). In the
past decade, more and more studies have investigated the effects of
neighborhood factors on racial difference of birth outcomes (Grady, 2006;
Janevic et al., 2010b; Love et al., 2010; Messer et al., 2008; Pearl et al., 2001).
With multilevel modeling techniques, these studies examined both individual- and
neighborhood-level factors on birth outcomes stratified by race (Gorman, 1999;
Pearl et al., 2001; Rauh et al., 2001). After adjusting individual-level risk factors,
Pearl et al. found that less-favorable neighborhood socioeconomic characteristics
were associated with lower birth weight among Blacks and Asians but not among
Whites, US-born Latinas, or foreign-born Latinas (Pearl et al., 2001). Grady et al.
demonstrated that residential segregation and neighborhood poverty are
important determinants of racial disparity in LBW in New York City (Grady, 2006).
With 158,174 singleton births in the US, Rauh et al. identified that older maternal
age is associated with reduced birth weight among infants born to African
American women (Rauh et al., 2001). In addition, previous studies indicated the
racial differences in access to fast food (Dunn et al., 2012) or healthy food (Bader
et al., 2010). The studies found that non-whites tend to exhibit greater access to
fast food, higher consumption of fast food meals and worse access to healthy
racial difference on the association between food environment and adverse birth
outcomes needed to be understood. However to date, no studies have examined
the racial difference of the association between food environment and birth
Table 2.1 Food environment measures by dimension of access
Dimension Assessment Measures
Availability Survey Perceived health food availability
(neighborhood or store)
Store audit Shelf-space
Product-availability Variety of product
GIS Store presence
Store density Store variety
Other Informant report
Opening of a new store
Accessibility Survey Perceived access to healthy food
GIS Distance to the store
Travel time to the store
Affordability Survey Cost/affordability
Store audit Price
Other Regional food price index
CHAPTER 3
Methods
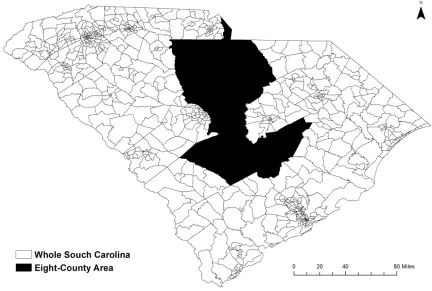
Study Area
Data from all births from 2008-2009 in South Carolina were used to
identify the association between food desert (neighborhood income and
community food access) and birth outcomes (Chapter 4) and the association
between neighborhood deprivation and adverse birth (Chapter 6).
Geographically, there are 867 Census tracts in South Carolina according to
Census 2000. When it comes to the individual-level analysis (accessibility and
availability of food outlets and birth outcomes in Chapter 5), the study area
included eight contiguous counties in the midlands region of South Carolina
(Figure 3.1). This eight-county area was chosen because the ground-truthed
food outlet data are only available in these counties. In the eight counties, there
is one urban county (Richland) and seven rural counties (Calhoun, Chester,
Clarendon, Fairfield, Kershaw, Lancaster, and Orangeburg). The eight-county
area approximately covers a total of 5,575 square miles and a population of more
than 620,000 (15% of South Carolina’s total population). Based on Census 2000,
Study Design
All three studies were cross-sectional studies. For Specific Aim 1 & 3 in
which association will be estimated between mothers’ residential neighborhood
areas (food desert dimension or neighborhood deprivation) and birth outcomes,
the analysis was multilevel with exposures in Census tract-level and with
outcomes in individual-level. In Specific Aim 2, the analysis was individual-level.
In these three studies, the outcomes were all birth outcomes including birth
weight (or LBW) and gestational age (or PTB). In Specific Aim 1, the exposure
was neighborhood income (low or high), community food access (low or high),
and combination of these two measures (high-income and high-access,
income and high-access, high-income and access, and income and
low-access). Low-income and low-access tract was the food desert. In Specific Aim
2, the exposures included the accessibility (distance from mother’s home to the
nearest food outlet) and availability (number of food outlets within 1-mile buffer
around mother’s home) of food outlets. For Specific Aim 3, the exposure was
neighborhood deprivation defined by the NDI.
Food Outlet Data
Community food access in the South Carolina State (Specific Aim 1) and
the mothers’ access to food outlets in eight-county study area (Specific Aim 2)
were needed to be evaluated. To estimate these food access measures, food
outlet data (number, type and location) were essential. In this study, three data
eight-county study area, InfoUSA (Omaha, Nebraska), and the Licensed Food
Services Facilities Database (LFSFD) from the DHEC for the areas out of the
eight-county area in the state.
The ground-truthed foot outlet data were from a previous field census
study led by Liese et al. which was designed to verify three readily available food
outlet databases within an eight-county region of South Carolina, including
InfoUSA, Dun&Bradstreet (D&B) (Short Hills, New Jersey), LFSFD from SC
DHEC (Liese et al., 2010). At first, the data from these three databases were
merged and cleaned by name and address, and then ineligible outlet types and
duplicates were removed. Then, starting with the merged database, the field
census was conducted to verify the presence and location of each food outlet in
the merged list to identify new and unlisted outlets by a global positioning system
(GPS) device. In total 114 trips entailing 7,000 miles ground-truth verification
were performed from September 2008 to July 2009 and all the food outlets within
the study area were located and verified. In the end, a total of 2,745 outlets were
verified in the field census and a total of 2,208 outlets were verified and open.
Among these verified food outlets, there are 160 supermarkets, supercenters,
grocery stores, and warehouse clubs (SSGW), 504 convenience stores, 120
dollar stores, 659 limited service restaurants, 650 full service restaurants, 79
drug/pharmacy stores, and 36 specialty stores. The type of food outlet was
assigned based on North American Industry Classification System (NAICS)
codes ("Economic Classification Policy Committee. North American Industry
name-based algorithm and knowledge of food outlet from internet or calling the
stores. In this eight-county food environment dataset, all open stores were
geocoded from the verified addresses. This dataset could be considered as a
gold-standard data source about food outlets within the eight counties to date,
because all the food outlets in the dataset were verified through field census. The
validity and reliability of this dataset have been found to be the best compared to
other commercial and agency datasets, i.e. InfoUSA, D&B, and DHEC database
(Liese et al., 2010).
However, the ground-truthed data were only available in eight-county
area. In Specific Aim 1, food outlet data outside eight-county area were needed.
We used secondary food outlet data to compensate the missing of gold-standard
data on food outlets. Studies showed that the combination of secondary food
outlet data sources improved the validity of the data (Liese et al., 2010). Thus, we
combined two secondary data sources (InfoUSA and DHEC LFSFD) to achieve
the best estimation of the food environment in the areas.
InfoUSA is a readily available secondary commercial datasets from
InfoUSA, Inc.. Most previous epidemiological studies relied on this dataset to
estimate the availability and proximity of certain types of food outlets (Larson et
al., 2009b). InfoUSA listings were queried for specific NAICS codes
corresponding to facilities that sell food. These include supermarkets and other
grocery stores retailing a general line of food (445110), convenience stores
(445120), pharmacies and drug stores (446110), gas stations with convenience