28
Inventory Optimization Using Consecutive Method and
Silver Meal Method for Non-Linear Demand Model:
Case Study
Devi Urianty Miftahul Rohmah
1, Bambang Dwi Argo
2, Panji Deoranto
3Magister Program of Agroindustrial Technology1,Professor of Agricultural Engineering2, Professor of
Agroindustrial Technology3, Department of Agricultural Technology
University of Brawijaya, Veteran, Malang 65145, East Java, Indonesia
Email: [email protected]1, [email protected] 2, [email protected] 3
Abstract- Inventory is material or good stored to be used to fulfill a specific purpose. Inconstant inventory will affect the inventory cost and products reorder or replenishment. Replenishment was an attempt by the company to hold an ordering to suppliers for the purpose of storing inventory. Therefore we need an analysis to determine the inventory optimization in the form of time and the replenishment quantity so the total inventory cost can be minimized as possible. Calculations for inventory optimization with non-linear demand/sales model can use the consecutive method developed by Wang (2002) and Silver Meal method. The case studies in this study conducted of Malang apples inventory at X Hypermarket. The purposes of this study were to compare the inventory cost of Malang apple at X Hypermarket with the optimization results using the consecutive method and Silver Meal method; determine the quantity and frequency of Malang apple orders at X Hypermarket.
Index Terms- consecutive method, non-linear demand, silver meal method
1. INTRODUCTION
Inventory is stock managed by the business in anticipation of some future demand (Adeyemi and Salami, 2010) [1]. Provision of supplies meant to face uncertainty, whether it be out of stock, overstock or demand that exceeded forecasts. One way to deal with their out of stock or overstock is to set the time and quantity at the time of the replenishment. Replenishment was an attempt by the company to hold an ordering to suppliers for the purpose of storing inventory.
Companies often get into trouble as a result of the unavailability of materials (inventory), or too many materials piled up in warehouses (Hasian, 2012) [4]. Overstock can lead to the emergence of funds idle, causing holding costs are higher, and the risk of damage to the materials inventories is higher. Out of stock can cause a delay in the materials demand process (sales) can even result in the loss of customers due to the delay of materials (Saputra and Zeplin, 2014)[17].
Calculations for inventory optimization model with non-linear demand / sales could use the consecutive method developed by Wang (2002) [19] and Silver Meal method. The purpose of this study was to compare the cost of inventory Malang apples at X Hypermarket with the optimization results using the consecutive method and Silver Meal method and determine the quantity and frequency of Malang apple orders at X Hypermarket.
2. METHODS
2.1. Total inventory cost of current conditions
Calculation of the total inventory cost of current conditions using the equation:
TIC = ordering cost + holding cost
TIC = n.o + h. ΣQ ... (1)
Information:
TIC = Total Inventory Cost (US$) n = frequency of reordering (times)
o = ordering cost, the reorder cost per lot (US$) h = holding cost per item per unit time (US$) Q = the quantity of inventory (kg)
2.2. Consecutive method
29
t = t*
Analysis of the data using a method developed by Wang (2002) aims to determine the optimal replenishment policy in order to obtain the total cost to a minimum by non-linear demand trends. The replenishment policy to be analyzed consists of the timing and amount of replenishment / reorder will do. In this method, it is assumed that the lead time is 0 and there is no shortage, so it does not calculate the shortage cost.
Stages in this analysis are: a. Creating demand / sales equation b. Finding the value of t * (reordering time)
t* found using Newton Raphson method Setting of the t * with : c2A(t*) > c1
c. Calculating the quantity of inventory using the equation:
ti-1 ≤ t ≤ ti ...(2)
d. Calculating total inventory cost using the equation: ...(3) done at the beginning of the period while holding cost is only charged on materials that store more than one period . Silver Meal starts at the very beginning of the first period, in which the purchase of materials made when the supply of materials accounted for zero. The principle of Silver Meal model is based on the several demand upcoming periods has been predicted earlier. This method focuses on the lot size to be able to
minimize the total costs per period, where the lot size is obtained by summing the need for several periods in a row as the lot size tentative (temporary) (Wohos et al., 2014) [20].
Silver Meal is one of the heuristic methods which is a method with the approach that is easy to use, and the repetition of the work will get better results when compared with the other heuristics. This method is trying to find the minimum average cost in each period for a number of periods that have been planned. Silver Meal method used for problems in which the variation of demand over a period of time to the next time period is quite high (Meilani and Ryan, 2013) [8]. The purpose of Silver Meal method is to determine the time additions in the period to minimize the total relevant cost per period (Madinah et al., 2015) [7].
Equation Silver Meal method used is as follows:
30 bottom that indicates the fruit approaches maturity.
Malang apples were sold at X Hypermarket, ordered independently / directly to the local suppliers.
Within six months from May to October 2013, X Hypermarket order Malang apples to seven local suppliers as much as 34 times. Total ordering in May 2013 amounted to 267 kg, in June 2013 amounted to 110 kg, in July 2013 amounted to 62 kg, in August 2013 amounted to 234 kg, September 2013 amounted to 134 kg, and in October 2013 amounted to 97 kg.
Determination of a number of materials ordered must correspond to the amount of the demand, if too much will result in overstock and if out of stock can not meet consumer demand. According to Sampeallo (2012) [14], when the supply of material owned company less than required then the smooth process of trade will be disturbed, customer needs are not being met so that the company would lose customers and the opportunity to earn income due to the depletion of material. If the excessive supply of material resulting in inefficient use of funds so can increase the holding cost and maintenance cost and increase the risk that the materials are damaged or missing.
Cost is the most important factor that must be considered before choosing a supplier company. Costs directly affect the profit margin which is the main goal of the company (Mwikali and Stanley, 2012) [10].
X Hypermarket applying the techniques of inventory in bulk, where this technique has the disadvantage that overstock. Overstock that occurs can cause damage to the Malang apple and will enforce X Hypermarket to make more sales to wholesalers. Sale to wholesalers is due Malang apple that can not be sold to consumers directly, so the cheaper price will be sold to wholesalers or sometimes even less than the purchase price from the supplier. Overstock that occurred at X Hypermarket also resulted holding cost increases. According to Nurhasanah et al. (2014) [11] when the company experienced overstock raw materials in the warehouse, will greatly affect the increased holding cost in a warehouse.
Sales in May to October 2013 is very fluctuate, ie 172.02 kg; 146 kg, 127.06 kg; 151.88 kg; 124.04; and 122.66 kg. This fluctuates sales result to fluctuate stock /non-linear of X Hypermarket inventory. According to Patil and Chapgaon (2016) [12], there are many factors that influence the demand variability. These fluctuations can be attributed to external factors such as changes in trends (rapid changes in consumer preferences) or events affecting the geographic area (such as a major earthquake or natural disaster).
Sometimes, fluctuations may also be due to increased marketing efforts have been successful in attracting consumers to the product.
Ordering cost at X Hypermarket is the cost incurred to meet the administrative order for the supplier selected. The ordering cost consists of the cost of product delivery transportation and transaction costs of purchasing the product. Ordering cost for each supplier is different according to a policy that determined by the supplier. According to Shah (2009) [18], an ordering cost includes all fixed costs (the cost component that does not vary with the size of the order) related to an order. The main component of the ordering cost covers the administrative costs associated with the ordering, transportation costs, and revenue costs (costs incurred for administrative work to be done at the time of receiving the order). The value of the average ordering cost used US$ 9.48.
Procurement of raw materials in X Hypermarket using inbound delivery system which is the delivery made by the supplier. Inbound delivery is a process in the reception in the delivery of materials to the receipt of materials (warehouse). This process begins when the goods are ready to be shipped by the vendor and have been determined through what path and transportation used, until when the materials arrive at the warehouse and warehouse receivers make material receipt. Therefore, ordering cost is set to once a reservation is quite high. Priyono (2008) [13], risks that may arise in the delivery of supply (inbound supply) of raw materials in the company are delays in deliveries from suppliers, not exactly the amount of raw materials delivered, an error specification of raw materials delivered and the quality of raw materials lacking / not good.
31 August to October 2013. Sales equation f (t) from May
to July 2013 is f (t) = 0.0002 t2 - 0.04 t + 6.2228 and sales equation f (t) from August to October 2013 is f (t) = 0.0005 t2 - 0.0563 t + 5.6454. Sales equation model will be different when sales data is also different, so the determination of the sales equation is an important step that will affect the timing and quantity of reordering. The results for the calculation of inventory optimization is divided into two because it is based equations sales.
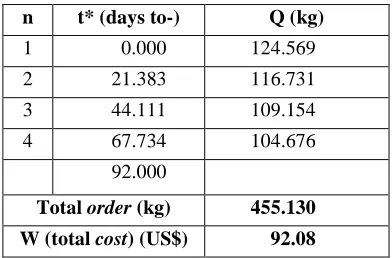
Table 1. Inventory Optimization using Consecutive Method for Malang Apple from May to July 2013
n t* (days to-) Q (kg)
Table 2. Inventory Optimization using Consecutive Method for Malang Apple from August to October
2013 the largest reservation within 24 days and the smallest is 22 days. Malang apples were sold at X Hypermarket has been given a coating that can last approximately 1.5 months, so the distance reordering of 24 days can still be done. In addition, the storage area which uses cooling can also maintain the shelf life of fresh fruits such as apples Malang. The order quantity contained results almost in line with the existing sales data.
The shelf life of apples is between 1 month to 3 months. Recommended storage temperature is the state's most effective to inhibit the ripening process and prevent the growth of microbial spoilage and to avoid distortions of cold storage. Generally, apples have optimum storage temperature of 300 F - 320 F or about 00 C. The freezing point is the highest for apples 29.30F or -20C so that apples can be stored at temperatures around minus 10C - 00C or more (Santoso, 2012) [16].
Purposes of determining the optimal inventory level are to minimize the amount of four types of inventory costs consist of the holding cost, setup cost, ordering cost, and shortage cost (Samson and Prakash, 2008) [15]. The ordering cost is influenced by the frequency of spare part ordering and once ordering cost (Kersten et al., 2010) [6]. The important aspect of ordering rules center is the number / lot size of ordering, minimum ordering, and the frequency of ordering (Davis, 2013) [3].
3.3 Inventory Cost Analysis of Malang Apple using
Silver Meal Method
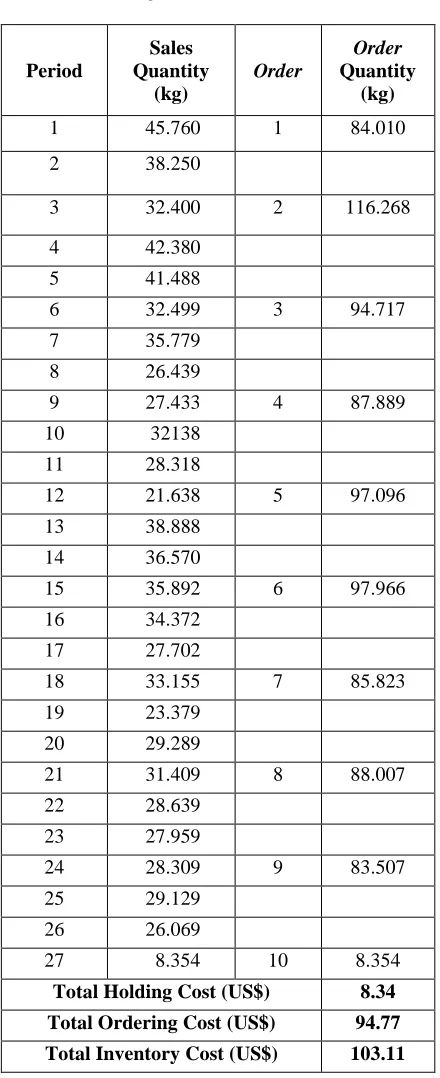
Silver Meal method has the criteria that the lot size selected must be able to minimize the total cost per period. The use of this method aims to minimize the average cost of each period. Inventory optimization of Malang apple using Silver Meal method shown in Table 3.
32 Table 3. Inventory Optimization of Malang Apple
using Silver Meal Method
Period
Sales Quantity
(kg)
Order
Order
Quantity (kg)
1 45.760 1 84.010
2 38.250
3 32.400 2 116.268
4 42.380
5 41.488
6 32.499 3 94.717
7 35.779
8 26.439
9 27.433 4 87.889
10 32138
11 28.318
12 21.638 5 97.096
13 38.888
14 36.570
15 35.892 6 97.966
16 34.372
17 27.702
18 33.155 7 85.823
19 23.379
20 29.289
21 31.409 8 88.007
22 28.639
23 27.959
24 28.309 9 83.507
25 29.129
26 26.069
27 8.354 10 8.354
Total Holding Cost (US$) 8.34
Total Ordering Cost (US$) 94.77
Total Inventory Cost (US$) 103.11
3.4 Comparison of Inventory Cost Optimization of
Malang Apple
Selection of optimization results based on the minimum total inventory cost. Inventory cost comparison of Malang apple can be seen in Table 4.
The total cost that compares is total inventory cost of consecutive method without using the equation W with a total inventory cost of Silver Meal method. The best result of optimization is using consecutive method. Determining the correct ordering of the vendor or the size of the lot to be submitted to the productive facilities of the company involves a search for the minimum total cost resulting from the combined effects of four individual cost are holding cost, setup cost, ordering cost, and shortage cost. The time of ordering is an important factor that can affect the cost of inventory (Jacobs et al., 2011) [5]. In inventory management, an important aspect is to reduce the amount of stock in order to maintain minimal inventory costs. At the same time, it is also important for companies to have sufficient stock on hand to keep production and sales running smoothly with the lowest possible cost (Arlbjorn et al., 2010) [2].
4. CONCLUSION
After processing and analysis of data, it could be concluded as follows:
33 Table 4. Inventory Cost Comparison of Malang Apple
Current Management : A Tool of Optimizing Resources in a Manufacturing Industry A Case Study of Coca-Cola Bottling Company, Ilorin Plant. Journal of Optimization and Replenishment: Creating a More Efficient Supply Chain. Wiley. New York. [4] Hasian, D.P. 2012. The concept of
Minimum-Maximum Inventory Control Part Heavy Equipment Mine PT. Semen Padang. Journal of Industrial System Optimization.Vol. 11 (1) : 203-207.
[5] Jacobs, F. R., W. L. Berry, D. C. Whybark, and T. E. Vollmann. 2011. Manufacturing Planning and Control for Supply Chain Management . 6th ed. McGraw-Hill. New York.
[6] Kersten, W., Thorsten B., and Christian L. 2010. Pioneering Solutions in Supply Chain Management : A Comprehensive Insight into Current Management Approaches. Erich Schmidt Verlag GmbH & Co.KG. Berlin.
[7] Madinah, W.N., Yeni S., and Wifqi A. 2015. Determination Method of Lot Sizing on Raw Material Procurement Planning Stingy and Drill Bits (Case Study: PT X, Sidoarjo). Journal of Industrial Engineering and Management Systems. Vol. 3 (3) : 505-515.
[8] Meilani, D. and Ryan E.S. 2013. Raw Material Inventory Control Auto Repair (Case Study: PT. Pulosari). Journal of Industrial System Optimization. Vol. 12 (1) : 326-334.
[9] Moore, C.W., J. W. Petty, L.E. Palich, and J.G. Longenecker. 2008. Managing Small Business: An Entrepreneurial Emphasis. South-Western Cengage Learning. USA.
[10] Mwikali, R. and Stanley K. 2012. Factors Affecting the Selection of Optimal Suppliers in Procurement Management. International Journal of Humanities and Social Science. Vol. 2 (14): 189-193.
[11] Nurhasanah,N., Syarif H., Ajeng P.L., Devi U.A., Faikar Z.H., and Nida’ul H. 2014. Raw Material Inventory System Planning in the Garment Industry PT DM. Journal of Industrial System Optimization.Vol. 13 (2): 589-617. [12] Patil, R.V. and Chapgaon. 2016. Linear and
Nonlinear Demand Forecasting for Effective Inventory Control. International Journal of Advanced Research in Science, Engineering, and Technology. Vol. 3 (1): 1223-1227.
[13] Priyono, A. 2008. Incentives and Sustainable Supply Chain: Literature Review. Journal of Business Strategy. Vol 12 (1): 47-54.
[14] Sampeallo, Y.G. 2012. Analysis Inventory Control at UD Bintang Furniture Sangasanga. Journal EKSIS. Vol.8 (1): 2001 – 2181.
[15] Samson, D. and Prakash J.S. 2008. Operation Management: An Integrated Approach. Cambridge University Press. New Delhi.
[16] Santoso, B. 2012. Post-Harvest Handling of Fruits. Subjects Post-Harvest Horticulture. UNRAM. Mataram.
[17] Saputra, P.H. and Zeplin J.H.T. 2014. Descriptive Analysis of Supply Management at PT Sinar Bulan Usman, Sidoarjo. AGORA Vol. 2 (2) : 1-9. [18] Shah, J. 2009. Supply Chain Management: Text
34 [19] Wang, S.P. 2002. On Inventory Replenishment
With Non-Linear Increasing Demand. Journal of Computers & Operations Research. Vol 29: 1819–1825.