Experimentation and Optimization of HDPE
Plastic Pipe by using Taguchi Method
Laxmi C Donode1, Prof. M.S Harne2, Dr. S.B. Chikhalthankar3, Rohini U. Kendre4 1, 4
PG Scholar, Department of Mechanical Engineering, Government College of Engineering Aurangabad, Maharashtra, India 2, 3
Associate Professor, Department of Mechanical Engineering, Government College of Engineering Aurangabad, Maharashtra, India
Abstract: The injection molding process is a very common process in polymer industries for large production of plastic parts used in commercial and domestic day to day life.so plastic product obtain are low is cost and high in quality. This research paper is about optimizing the parameter of the injection molding process which will enhance productivity by improving quality.as in this paper it gives the most optimistic parameter required in the injection molding process to obtain quality product at minimum cost and time without defect .the part selected is from a company which is facing a problem of shrinkage due to which a large amount of production cost is required for material loss and process. For this problem, a solution is to find out as using Moldflow simulation software to predict early failure in a part which will be modified on a new parameter setting which is obtained by software data. The Taguchi method with help of minitab software is used for optimizing parameter selected such as melt temperature, mold temperature, cooling time. The software is also used to analyse result where s/n ratio again ANOVA are helped to give most significant factor which leads to shrinkage in which a number of simulations is based on three levels of L9 Taguchi orthogonal array
Keywords: Injection Molding Process, Moldflow advisor, shrinkage, Minitab software, taguchi method
I. INTRODUCTION
The injection molding process is very common in the many industry for the manufacturing of plastic components. Quality component obtains by good design, proper material, and process parameters. Process parameters setting helps to get a defect-free product that you want within a time period otherwise it leads to increase production cost. If there is any difficulty in setting optimal parameter than it will lead to a defect such as air trap, sink marks, shrinkage, weld lines flash. shrinkage is one of a common problem that occurs in injection molding .this shrinkage is due to improper wall thickness, melt temperature, mold temperature and improper cooling which lead to a lot of production cost .for this it should be predicted first before the manufacturing process. Moldflow advisor is one of software in plastic industry applications where we early predict a problem occurs during the process with specified used parameters which helps to reduce defect and improve the production cycle. Shrinkage is a defect which depends on parameter mold temperature, melt temperature, cooling time is a various factor. These optimum parameters are required to give actual results. Optimization is done by using the software, actual process, and with the help of the Taguchi method. This method helps to identify the optimum parameter on which process should be done.
Figure 2: process of injection moulding
shrinkage calculation. In this, it compares the shrinkage rate of the real process and software ejecting molded part at high temperature is common to shortening production cycle time and improve productivity, quality of part. H.Radhwa,M.T.Mustaffa in this paper research about an optimization of shrinkage in injection molding by using TAGUCHI method .in this TAGUCHI method help to identify the process parameter which gives less shrinkage while machining of process. This study helps to improve quality by reducing manufacturing time and shrinkage defect. For this ANOVA is utilize to identify most significant factor which affect process.
II. M ETHODOLOGY
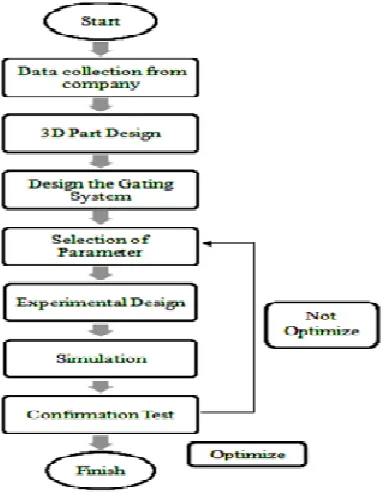
[image:2.612.223.415.197.447.2]The stages involved in the project first start with the data collection from the company till the confirmation test. It was shows in Figure 1
Figure 1: methodology of project
[image:2.612.151.462.533.727.2]1) Selection of Material: HDPE (HDPE 50ma180) is polymer with good process ability and having good mechanical properties use for day to day life. They are used in manufacturing of storage vessel, refrigeration unit, PET Bottles, pipe by injection moulding process.
Table 1: material property
Sr no Property value
1 density 0.924 – 2.55 g/cc
2 Melt flow rate 20 g/10min
3 Tensile modulus 7.60 – 43 mpa
4 Young modulus 0.450 – 1.50 gpa
Table 2: processing property Sr
no
property Value
1 processing temperature 82.2 - 274 °C
2 Melt temperature 130 - 280 °C
3 Mould temperature 5.00 - 65.6 °C
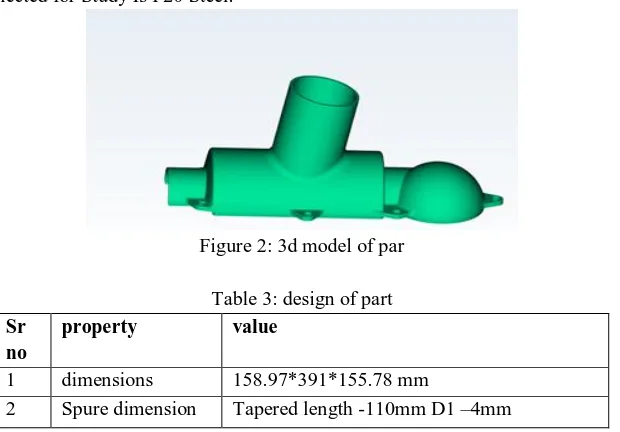
2) Design Of Product And Gating System: Plastic Component Is Product Of Company Used In Manufacturing Of Rain Water Harvesting Pipe. The Gating System Selected for This Study Is Tapered Spure System with End Acting as Injection Point on Top .Mould Material Selected for Study Is P20 Steel.
Figure 2: 3d model of par Table 3: design of part
Sr no
property value
1 dimensions 158.97*391*155.78 mm
2 Spure dimension Tapered length -110mm D1 –4mm
3) Selection of parameter: in this study parameters that are studied on the part are the (A) melt temperature (B) mould temperature (C) cooling time by referring these are the parameters that are significant in injection moulding process. Table shows the selected parameter with 3 levels.
Table 4: parameter level set in minitab
Sr no Experimental factor Level 1 Level 2 Level 3
a Melt temperature 180 200 220
b Mold temperature 40 50 60
c Cooling time 100 110 120
III. EXPERIMENTAL WORK:
Minitab software is used to run taguchi method to obtain optimistic parameter in which design of experiment is technique to find optimized process setting by analysing there effect on performance and solve production related defect .it involve optimization of controlled and uncontrolled factors. the controlled factor in this project are five parameter that have chosen which is 1] melt temperature 2] mold temperature 3] cooling time while uncontrolled factor which is known as noise factor which is need to be control in this project is shrinkage. By using minitab software l9 array is orthogonal array with 5 factors and 3 levels are used. A statically analysis of variance also used to find out influence of parameter on process. The s/n ratio is of “smaller the better” is used to minimize shrinkage .the value of s/n ratio is calculated by using equation (1) and msd by (2)
s/n ratio = -10 log MSD………….(1)
MSD =1/n ∑ yi2 ……….(2)
Where MSD- mean square deviation y- Both of studied result factor
n- no. of a test in trial
[image:3.612.112.502.402.459.2]IV. RESULTSANDDISCUSSION:
Table 5: minitab orthogonal array setting
Sr no Melt temp Mold temp Cooling time shrinkage SNRA1
1 180 40 100 0.940 1.25662
2 180 50 110 0.880 -0.06646
3 180 60 120 1.035 -1.19016
4 200 40 100 1.089 -1.19016
5 200 50 110 1.820 1.25662
6 200 60 120 1.940 -0.06646
7 220 40 100 2.320 -0.06646
8 220 50 110 2.490 -1.19016
9 220 60 120 3.200 1.25662
A. Analysis Result – s/n ratio Analysis
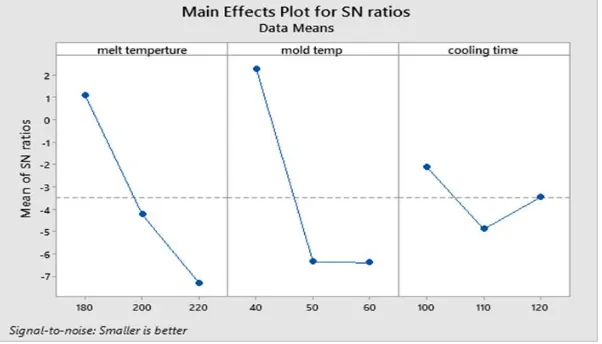
[image:4.612.170.446.317.407.2]The analysis result of shrinkage from table was presented into form of response table of s/n ratio an in table. From table it can easily be noticed the most optimum parameter for minimizing shrinkage defects.
Figure 6: Response table for s/n ratio
level Melt temp Mold temp Cooling time
1 1.096 2.293 -2.107
2 -4.244 -6.353 -4.894
3 -7.315 -6.402 -3.462
delta 8.411 8.695 2.788
rank 2 1 3
[image:4.612.163.464.447.619.2]The optimal level was selected based on highest point in fig 3 .the rank shows which factor affect shrinkage the most starting with mold temperature [b] in first rank and least affecting factor that is cooling time [c].
Figure 4: graph of s/n ratio
Table 7: Optimum setting for shrinkage
factor Melt temp Mold temp Cooling
time Optimum
level
1 1 1
B. Analysis Result – Analysis of Variance (ANOVA)
ANOVA test was applied to determine the significance of each parameter in the designed experimental study. The
[image:5.612.63.552.167.267.2]ANOVA results for HDPE moldings are given in Table no respectively. Since the one P-value was less than 0.05, this parameter had a statistically significant effect on the shrinkage at the 95% confidence level. The ANOVA test was applied to determine the significance of each parameter in the designed experimental study. The ANOVA results for HDPE moldings are given in Tables 4 respectively.
Table 8: Avova result
source DF Seq ss Adj ss Adj ms f-value p- value contribution
Melt temp 2 0.44349 0.44349 0.22174 5.75 0.148 38.56%
Mold temp 2 0.59261 0.59261 0.59261 7.69 0.115 51.52%
Cooling time
2 0.03701 0.03701 0.03701 0.480 0.676 3.22%
error 2 0.07709 0.07709 0.07709 6.70%
total 8 1.15021 1.15021 100.00%
C. Regression Analysis
Regression analysis is used to define the relationship between a response variable and one or more predictors. The mathematical relationship is formulated between shrinkage value and five process parameters selected for study. Regression analysis is done by using MINITAB V17 software. This model is used directly to predict the values of shrinkage from a new set of input parameters. The mathematical relation obtained from regression analysis is given below.
Regression equation:
Shrinkage = -6.90+0.03302 melt temp +0.0690 mold temp – 0.0125 cooling time Figure 6: regression analysis result
The correlation coefficient measures the goodness of fit between the simulation data and predicted values. The R2 value is found to be 82.98%. Also, the adjacent R2 value is found to be 72.76%.These values show that predicted shrinkage values have good correlation with shrinkage values obtained from simulation. Hence the regression model is acceptable.
D. Conformation Test
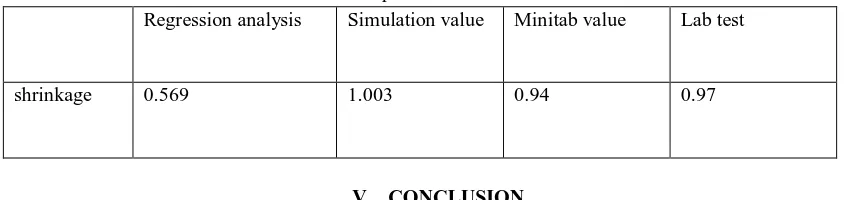
[image:5.612.96.519.497.597.2]For conforming this simulation values, regression equation values and minitab value it is get confirm with laboratory test by testing heat shrinkage test of all 9 sample which gives 0.97% of shrinkage at optimum values.
Table 7: comparison between methods
Regression analysis Simulation value Minitab value Lab test
shrinkage 0.569 1.003 0.94 0.97
V. CONCLUSION
From this study, it can be calculated that taguchi method was used to minimize the shrinkage defects.it is a very useful method that can be used which provide efficient and economical way instead of trial and error method which contributes to waste. The conclusion of project:
A. The recommended setting of parameters for shrinkage was produced by the combination of A1, B2, C2; D2.that was the setting
of melt temperature, mold temperature, cooling time. From anova table, it shows that melt temperature[a] contribute the percentage value is 38.56% followed by mold temperature with 51.52% .the factor cooling time 3.22%.
REFERENCE
[1] Radhawan hussin,ahmand faizal annuar,azmi harun “an optimization of shrinkage in injection molding part by using taguchi method”journal of advanced research in[vol.10,no.1 pages 1-8,2015 applied mechanics issn :2289-7895
[2] opran constantin gheorghe,gheorghe tudor vlad “optimization of micro injection molding of polymeric medical devices using software tools” 24th DAAMinternational symposium on intelligent manufacturing and automation,2013
[3] J.M.Mercado colmenero,M.A almazan lazaro “analytical calculation model for determining the cycle time in injection molding parts applied to design optimization algorithms” 2nd international conference on high performance and optimum design of structure and materials.
[4] M.D.Azman,S.M.Sapuan,K.Abdan “An investigation of the processability of natural fibre reinforced polymer composites on shallow and flat thin-walled parts by injection mouldingprocess”material and design 50(2013)451-456
[5] Navin Kumar ,Mayor Thombre “Optimization of Injection Moulding Process Parameters for Reducing Shrinkage by Using Genetic Algorithm Technique” IJARIIE-ISSN(O)-2395-4396
[6] J ozsef G abor Kov acs a, *, Ferenc Szab o a, Norbert Kriszti an KoY “thermal simulation and measurement for rapid tool insert in injection moulding application” Applied Thermal Engineering 85 (2015) 44e51
[7] Azieatul Azrin Dzulkiplia, M. Azuddina “study of effect of injection molding parameter on weld line formation” Advances in Material & Processing Technologies Conference Procedia Engineering 184 ( 2017 ) 663 – 672
[8] Himanshu Gangber, S.K.Ganguly, Santosh Kumar Mishra , “Modeling and Analysis of Micro Cooling Channel for Plastics Injection Mould by using Moldflow Adviser” International Journal of Engineering Science and Computing, July 2017
[9] N.Subramani, J.Ganesh Murali, P.Vijaya Rajan, C.Godwin Jose, “Optimization Of Injection Moulding Mould Flow Analysis Using Taguchi Approach” International Journal of Pure and Applied Mathematics Volume 118 No. 11 2018, 241-250
[10] Hyeyoung Shin and Eun-Soo Park, “Analysis of Incomplete Filling Defect for Injection-Molded Air Cleaner Cover Using Moldflow Simulation” Hindawi Publishing Corporation Journal of Polymers Volume 2013, Article ID 720209, 13
[11] A. H. Ahmad* Z. Leman, M. A. Azmir, K. F. Muhamad, W.S.W. Harun, A. Juliawati, A.B.S. Alias, “Optimization of Warpage Defect in Injection Moulding Process using ABS Material” (2009) Third Asia International Conference on Modelling & Simulation, Conference Paper • January 2009
[12] C. T. Wong, Shamsuddin-Sulaiman, Napsiah Ismail & A.M.S. Hamouda, “Design and Simulation of Plastic Injection Molding Process”. Pertanika J. Sci. & Techno. Supplement (2004) [pp 85-99 ]