Abstract— In this paper a digital image filter is proposed to enhance the Liver CT image for improving the classification of tumors area in an infected Liver. The enhancement process is based on improving the main features within the image by utilizing the Fractional Differential and Integral in the wavelet sub-bands of an image. After enhancement, different features were extracted such as GLCM, GRLM, and LBP, among others. Then, the areas/cells are classified into tumor or non-tumor, using different models of classifiers to compare our proposed model with the original image and various established filters. Each image is divided into 15x15 non-overlapping blocks, to extract the desired features. The SVM, Random Forest, J48 and Simple Cart were trained on a supplied dataset, different from the test dataset. Finally, the block cells are identified whether they are classified as tumor or not. Our approach is validated on a group of patients’ CT liver tumor datasets. The experiment results demonstrated the efficiency of enhancement in the proposed technique.
Index Terms— Fractional Differential (FD), Fractional Integral (FI), Tumor, Enhancement, Features.
I. INTRODUCTION
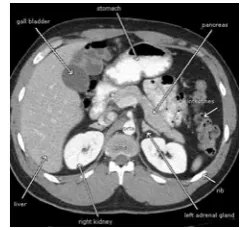
edical images have different features than other types of images [1]. The contents inside a medical image such as bones, tissues, glands and organs (for example as shown in Fig. 1) have various properties that usually exhibit low contrast which causes difficulty in automatic segmentation/detection between an organ and lesion inside an image. Moreover, the quality and the details of a medical image scan is usually affected by external factors, such as electronic devices used and noise [2]. The presence of noise in medical scan may cause difficulties for specialists to extract precise and valuable information [3]. A noise removal method is usually applied on all types of images before processing to extract useful information [4]. However, the shades of grey level are within close range around the tissue organ [5]. Consequently, it is important to employ novel specialized techniques.
N. Ghatwary, PhD student at with the Department of Computer Science, at University of Lincoln, Lincoln, United Kingdom. Teaching Assistant with the Department of Computer Science, at the Arab Academy for science and technology (AAST), Alexandria, Egypt. (e-mail: [email protected], [email protected])
A. Ahmed, Senior Lecturer, is with the Department of Computer Science, at University of Lincoln, Lincoln, United Kingdom, (e-mail: [email protected]).
H. A. Jalab Faculty of Computer Science and Information Technology, University of Malaya, 50603 Kuala Lumpur, Malaysia (e-mail: [email protected])
Different modalities are presented in the radiographic for the detection of tumors, such as Computed Tomography (CT) [6], Magnetic Resonance (MRI), Ultrasound Imaging (US) or position emission tomography (PET). Choosing the types of scan sometimes may differ depending on the organ, type of cancer and size of tumor.
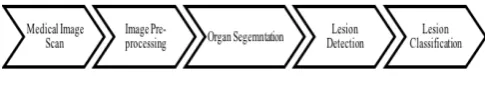
[image:1.595.364.485.519.634.2]Computer Aided Diagnosis (CAD) is one of the popular tools that assist doctors in analyzing the medical images, by providing a second opinion [7]. The CAD system passes through a variety of phases represented in Fig. 2. Where the image is first exposed to pre-processing phase by enhancement and noise reduction to provide a clearer view of some image-hidden details and regions. Eventually, the targeted organ is segmented and extracted from the medical scans. By working on the extracted organ itself, the detection stage focuses on disclosing abnormal areas and lesions detection. An enhancement post-processing phase can appear here to improve features in the extracted region. Finally, the segmented lesions are classified into the relevant cancer type or severity, in the classification stage. The pre-processing phase, in a CAD system, enhances the medical images and contributes in improving the quality of different features, emphasizing hidden details and removing noise caused by any external factors. Improving the enhancement phase will facilitate the following phases (Segmentation / Classification) as the features within the image will be more described.
Fig. 1: A CT of a normal abdominal abdomen
Image enhancement is the process of improving the details of an image by altering some parameters/features. The aim is to produce an image that has less noise with improved details. Main features of an image can be classified into Contrast, Texture and Edge. The objective of the enhancement phase is to locate and emphasize these features to improve the accuracy of the segmentation and classification.
Liver CT Enhancement using Fractional
Differentiation and Integration
Noha Ghatwary, Amr Ahmed , Hamid Jalab
Fig. 2:CAD Stages
In our proposed model, a new enhancement image filter is implemented to improve the classification of tumor region from infected Liver organ. Moreover, a quantitative evaluation of the proposed enhancement filter compared to available filters and their effect in tumor classification as an example.
This paper is organized as follows. Section II represents the related work of different Medical image enhancement using FD, a brief description of related background is explained in Section III, the proposed model is illustrated in Section IV while the Experimental results are illustrated in Section V and the conclusions are discussed in Section VI.
II. RELATED WORK
As a recall, the enhancement process improves the image details by tuning particular parameters/features [8]. It aims at producing a reduced noisy image and clarifying its concealed details. The enhancement methods can be divided into two main categories; a) restoration, through removing
the noise from the image (i.e. Denoising) while preserving its features that usually takes place in preprocessing phase, b) Feature based methods such as Contrast, Texture and
Edges that usually takes place in post processing to help
differentiate between the organ and its lesion.
Various methods for Denoising images, based on the
wavelet transform, were proposed. Using wavelet transform, random noise will be identified as small coefficients in the high frequency sub-bands. A wavelet thresholding is then used to remove those coefficients related to noise [9]. Wavelet based transform methods were proffered by [10-11]. Using the concept of denoising, [12-14] suggested methods based on the contourlet transform. The wavelet approaches showed notable performance in less noisy regions, while contourlet ones were more effective in highly noised regions but it took more processing time. To summarize, denoising is effective in removing noise from an image. However, it may sometimes cause a misleading in homogenous areas, fuzzy edges, and visual distortion due to noise removal effect.
Histogram Equalization (HE) is popularly used for
contrast enhancement, due to its simplicity and efficiency. It stretches the grey level in dark areas and uniformly distributes them to generate a clearer image; whereas it has limitations, for instance being selective may raise the contrast noise in an image [15]. Contract enhancement methods found in literature mainly attempt to improve HE by overcoming its drawbacks.
Contrast enhancement has to be adjusted properly as it
may cause over enhancement, leading to noise or artefacts in an image. Ismail et al [16] proposed contrast Enhancement Dynamic Histogram Equalization (CEDHE) for Medical Image. The submitted model showed better results in comparison with others and over enhancement
was avoided; on the other hand, the method necessitates modification to enhance images with complex unseen tumours and obscure medical images. Chong et al [17] introduced a modified Hyperbolization logarithm (HL) to help in the segmentation process for the region of interest. The proposed model increased the contrast of major breast structures as glands without affecting the image brightness; this resulted in a more enhanced image that made the segmentation of necessary glands easier. Tan et al [18]
suggested an Extreme Levelling Eliminating Adaptive Histogram Equalization (ELEAHE) to improve the contrast of brain CT’s image used in detecting Ischemic Stroke. This approach greatly enhanced the contrast of brain tissues in a CT image, but the method still needs further investigation to be tested against MRI scans and other different organs not brain only. A study by Al Ameen et al [19] showed that the Contrast Limited Adaptive Histogram (CLAHE) perfectly achieved robustness and reliability. This model took into consideration the speed and efficiency as key factors to develop their work.
Enhancing the Texture using masks is commonly used
where the pixel values are altered in this mask, based on the neighbor values nearby the pixel of interest. Jalab et al, [20], proposed a texture enhancement technique for medical images based on fractional differential (FD) masks. Texture details within an image with unnoticeable variation of grey level can be enhanced using FD. Although the model yielded promising results, yet the medical image suffered from noise. Applying the affected image on noise removal filter and controlling the limit of texture enhancement is a possible solution for the prior limitation. Based on the local texture similarity, Si et al [21] constructed a region of non-regular self-similar support that was used for preparing a non-regular FD mask in order to improve texture characteristics, but the fractional order needed to be regulated to fit images with complex texture.
The enhancement methods available focused mainly on improving a specific feature or removing noise and preserving a characteristic. There is no comprehensively compatible for automatically detecting tumor since it depends on the requirements from the user.
III. RELATED BACKGROUND
A. Fractional Calculus
Fractional Calculus is a field of mathematic study that provides derivation and integration of functions to non- integer order. Operators with non-integer order were validated that it can describe the behavior of materials over massive frequency and time scale. We are utilizing it to adaptively enhance the images [22].
In image processing, the grey-level value between neighboring pixels is greatly correlated and highly self-similar, such structure is often expressed by the complex texture detail features (Known as fractal structure).
that it has a better performance in improving the texture of images than other methods [20], [23,24]. But medical image has different feature characteristics, compared to than normal/general images, ones due to the exposure and most important the image content. In smooth regions the low-frequency contour features using the FD mask are preserved maintaining non-linearly the high-frequency marginal features in region that has a reasonable change in it grey level and improves texture details in areas wherein the changes in gray level are trivial [25]. FI also has been proven to be effective image noise removal method maintaining image feature details [26,27].
B. Wavelet Transform
The Wavelet Change (WT) is a method for carefully studying signals. It has been widely used in the image processing because of its distinctive characteristics and advantages for signal analysis. The Discrete Wavelet Transform (DWT) is a special case of the WT that provides a compact representation of a signal in time and frequency and can be computed efficiently [28]. The DWT is defined by (1)
W ( j , k ) = ∑ ∑ [x ( k ) * 2 − j * ψ ( 2 − j * n − k ) ] jk (1)
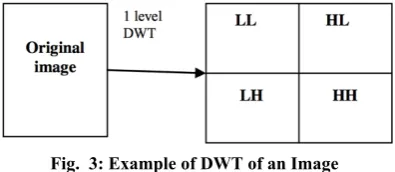
[image:3.595.307.544.52.174.2]where ψ(t) is a time function with finite energy and fast decay called the mother wavelet. The DWT decomposes the image into four sub-bands LL, LH, HL, HH as shown in fig. 3. More information about DWT can be found in [29].
Fig. 3: Example of DWT of an Image
IV. PROPOSED MODEL
The presented model integrates the multi-resolution wavelet analysis with the FD and FI to produce the enhanced image to help improve the classification of tumor and non-tumor in a Liver CT. Fig.4 illustrates a block diagram of the proposed model which demonstrates the scheme of the enhancement process. Different phases have been introduced. The image is first decomposed into its Discrete Wavelet Transform (DWT). Later on, the proposed FD and FI are applied to various sub-bands of the DWT image. The FD is applied to the HL-LH sub-bands, while the FI is applied to the HH sub-band. Then, the enhanced image is reconstructed by applying the Inverse Discrete Wavelet Transform (IDWT). After that, the image is fully exposed to the proposed FD filter mask to enhance the overall texture of the image. Finally, the histogram
equalization (HE) is applied to gain the enhanced output
[image:3.595.71.269.403.489.2]image ready for classification. In the following sub-sections, each phase will be justified in details.
Fig. 4: Proposed model
1) Applying the DWT:
DWT decompose the image into four different frequency sub-bands holding the majority of the data position and emphasizing the features. These sub-bands are correspondent to approximate, horizontal, vertical, and diagonal features, respectively. The LL sub-band is approximately located at half the original image. While, the HH sub-band contains the high frequency details of the image. On the other hand, the HL-LH convey changes of the image [28]. The DWT transform is generally used to to improve the features of an image taking the advantage of these sub-bands properties.
2) Applying the FD and FI:
In medical image processing the texture is one of the key factors needed [30]. It can be known as describing the
positioning and local spatial variation of a pixel [30].
Texture is considered one of the most important features that can perform classification between diverse organs and also between the organ and its lesion. Applying the integer order differentiation, it may damage the texture details in an image. Therefore, using the FD is an efficient method to deal with texture like problems.
In our model we first apply the FD in the HL-LH sub-bands of an image where they convey the changes within the image such as texture. The FD is applied using a mask filter, based on equation (2), by adjusting its alpha ( ) value with a window size 5x5.
= (2)
On the other hand, Denoising is important to to remove the noise from the image while preserve the quality of its features. So, the Fractional Integration Is applied at the HH sub-band where the high frequency details of an image take place. The FI has the ability to remove noise and sustain the texture and edge features in an image [ 31]. In the model we utilize the Fractional integrations mask using the Riemann-Liouville Operator [32] as seen in (3).
(3)
3) Applying FD and HE:
In the next phase we apply the FD once again on the whole image to benefit from its properties in enhancing the texture within the image. The Histogram equalization is then applied in order to enhance the intensity contrast of the reconstructed enhanced output image. To evaluate the effect of the enhancement, we use the enhanced image to automatically classify regions (blocks/cells) into tumor and normal cells and compare that with the results from original image and other established filters, as explained in the results section.
V. EXPERIMENTAL RESULTS
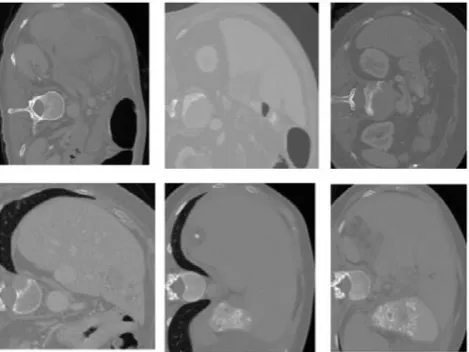
The proposed model has been carried out on several experiments to test its efficiency. The model has been tested using a large dataset of various patients with varied tumor location and size, the tested dataset consisted of 2500 CT Liver images belonging to various patients. Sample of the Liver CT images with tumors is shown in Fig. 5. The Tumor detection is accomplished using various classifiers such as SVM, Random forest, J48 and Simple Cart. Moreover, different results from our scheme have been compared with results of the original and enhanced image from known existing/established filters including Histogram Equalization (HE), Median, Weiner, and Gaussian.
In this section we illustrate the performance indicators used to evaluate the proposed model, after enhancing the image, by classifying the block region into tumor and normal cell. Our main focus is to increase the classification of tumor regions.
A. Performance Measure:
In order to evaluate the performance of the enhancement and to allow fair comparison between the filters, different standard measures have been taken into consideration. So, performance of the enhancement will be measured by the classification results according to the following measures:
Where, TP= True Positive (Correctly Classified as Tumor), TN= True Negative (All Blocks classified as Non-Tumor), FP=False Positive (Non-tumor blocks classified as tumor)
and FN= False Negative (Tumor classified as Non-Tumor).
B. Features and Classifiers:
Each image is divided into blocks of size 15x15 where each block is represented as a Tumor/non-Tumor area. Various features were extracted including Grey Level Co-occurrence Matrix (GLCM), Grey Level Run Length Matrix (GLRLM), local binary patter (LBP) and Lacunarity as a preparation for the classification phase from these blocks. Information from these features will be gathered to train classifiers such as Support Vector Machine (SVM), Random Forest, J48 and Simple Cart classifier.
C. Proposed Model Results:
Our main aim in the proposed model is to enhance the medical image to improve the classification of tumor areas to decrease any miss guided diagnosis. A demonstration of tumor classification results is shown in Fig. 6(a) and (b). In (a), the results of tumor classification from the original image showed an accuracy of 58% based on the SVM classifier, when applying the other enhancement filters such as the HQ, Median, Gaussian, etc… an improvement of the tumor classification only increased by 2-3%, while after applying the proposed filter it increased to 69.1%. On the
other hand, the results using the Random Forest Classifier for tumor classification using the proposed filter was
72.22% which is an 8% rise over the original image and
than the other filters by a range of 5% to 12%.
Experiments also have been made using the J48 and simple cart classifiers as shown in (b), where the results are considered the highest in the classification results with 75.7% and 76.7% respectively. In addition to the highest difference between the original image and the filters. Although the other enhancement filter might give a smother image with less noise but the proposed model was able to differentiate between the features of tumor and non-tumor areas using four different classification methods.
[image:4.595.49.284.454.630.2] [image:4.595.306.550.625.764.2]Figure 6: b) Accuracy of tumor classification
In table I, the sensitivity of the experiments is stated. The results refer to the ability of correctly detecting the tumor from infected regions. As shown in the table the proposed model had the ability to increase the sensitivity rate of tumor detection after enhancing the image features.
[image:5.595.196.543.51.279.2]The Specificity is illustrated in table II, the values represent classification of the block that are not infected and categorized as tumor-free. Although the values of proposed model were less than the other filters but this is due to that some blocks used for feature extraction sometimes might merge between a majority of non-tumor regions and a small area of tumor which males it a mixed block. The results are considered comparable with the other filters and effecting the enhancement in positive way.
Table I: Sensitivity for Tumor Classification Sensitivity
SVM
Random
Forest J48 Simple Cart Original 0.581 0.636 0.626 0.652
Filter
without HQ 0.545 0.672 0.657 0.646 Proposed
Filter 0.692 0.722 0.758 0.768
HQ 0.556 0.586 0.571 0.586
Median 0.571 0.687 0.677 0.631 Adaptive
HQ 0.596 0.601 0.586 0.581
Gaussian 0.606 0.677 0.626 0.636 Weiner 0.611 0.672 0.631 0.646
Table II: Specificity for Tumor Classification Specificity
SVM
Random
Forest J48 Simple Cart Original 0.978 0.984 0.976 0.974
Filter
without HQ 0.922 0.9788 0.9757 0.98 Proposed
Filter 0.977 0.981 0.971 0.975
HQ 0.985 0.985 0.977 0.985
Median 0.993 0.993 0.9807 0.975 Adaptive
HQ 0.9825 0.98 0.9807 0.973
Gaussian 0.979 0.981 0.981 0.9707
Weiner 0.982 0.98 0.98 0.972
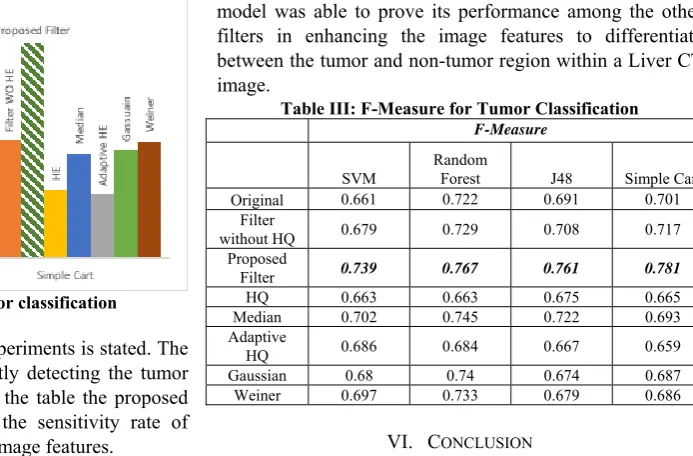
Table III presents the classification and evaluation performance of the current experiments by quantifying the F-measure for each filter which measure the results accuracy by taking in to consideration all the statistical values TP, FP, TN and FN. As highlighted the proposed
model was able to prove its performance among the other filters in enhancing the image features to differentiate between the tumor and non-tumor region within a Liver CT image.
Table III: F-Measure for Tumor Classification F-Measure
SVM
Random
Forest J48 Simple Cart Original 0.661 0.722 0.691 0.701
Filter
without HQ 0.679 0.729 0.708 0.717 Proposed
Filter 0.739 0.767 0.761 0.781
HQ 0.663 0.663 0.675 0.665
Median 0.702 0.745 0.722 0.693 Adaptive
HQ 0.686 0.684 0.667 0.659
Gaussian 0.68 0.74 0.674 0.687 Weiner 0.697 0.733 0.679 0.686
VI. CONCLUSION
This paper proposed an enhancement filter technique that utilizes the properties of FD and FI to enhance the features within an image in order to improve the classification of the tumor regions from a Liver organ in a CT medical image. This is provided by applying the proposed fractional mask utilizing the FD and FI in the sub-bands of an image then re-applying the fractional differential on the whole reconstructed image, in order to improve the overall texture. Different features were extracted to compare the results with existing/established filters such as HE, Median, etc.…. For the classification process, the SVM, Random forest, J48 and Simple Cart were used. Experimental result proved to provide better classification results of tumors regions after enhancing the image specially with the J48 and Simple cart with an increase of more than 10% accuracy. In our future work, we are aiming to raise the accuracy of tumor classification by varying the size of the block area and exploring different set of features to implement a novel method for automatic tumor segmentation.
REFERENCES
[1] B. Zitova and J. Flusser, "Image registration methods: a survey,"
Image Vision Comput., vol. 21, pp. 977-1000, 2003.
[2] S. Kim, B. Min, W. Oh and J. Lee, "Medical Image Enhancement Algorithm Using Edge-Based Denoising and Adaptive Histogram Stretching," International Journal of Bio-Science & Bio-Technology,
vol. 5, pp. 25-38, 10, 2013.
[3] H. Bhadauria and M. Dewal, "Medical image denoising using adaptive fusion of curvelet transform and total variation," Comput. Electr. Eng., vol. 39, pp. 1451-1460, 2013.
[4] P. Gravel, G. Beaudoin and J. A. De Guise, "A method for modeling noise in medical images," Medical Imaging, IEEE Transactions on,
vol. 23, pp. 1221-1232, 2004.
[5] S. Gunasundari and S. Janakiraman, "A study of textural analysis methods for the diagnosis of liver diseases from abdominal computed tomography," International Journal of Computer Applications, vol. 74, 2013.
[6] Abir Baazaoui, Walid Barhoumi, Amr Ahmed, Ezzeddine Zagrouba ,”Semi-automated segmentation of multiple tumors in liver CT images using cooperative region growing”. In TAIMA’15: Traitement et
Analyse de l’Iinformation Methodes et Applications. Special session on Medical Imaging and Signals. 11-16 May, 2015.
[7] K. Doi, "Computer-aided diagnosis in medical imaging: historical review, current status and future potential," Comput. Med. Imaging Graphics, vol. 31, pp. 198-211, 2007.
[image:5.595.41.309.395.730.2]Bioinformatics and Biomedical Engineering, 2007. ICBBE 2007. the 1st International Conference on, pp. 876-879, 2007.
[9] Y. Wang and H. Zhou, "Total variation wavelet-based medical image denoising," International Journal of Biomedical Imaging, vol. 2006, 2006.
[10] H. Naimi, A. B. H. Adamou-Mitiche and L. Mitiche, "Medical image denoising using dual tree complex thresholding wavelet transform and Wiener filter," Journal of King Saud University-Computer and Information Sciences, vol. 27, pp. 40-45, 2015.
[11] S. Padmagireeshan, R. C. Johnson, A. A. Balakrishnan, V. Paul, A. V. Pillai and A. A. Raheem, "Performance analysis of magnetic resonance image denoising using contourlet transform," in Advances in Computing and Communications (ICACC), 2013 Third International Conference on, pp. 396-399,2013.
[12] M. Z. Iqbal, A. Ghafoor, A. M. Siddiqui, M. M. Riaz and U. Khalid, "Dual-tree complex wavelet transform and SVD based medical image resolution enhancement," Signal Process, vol. 105, pp. 430-437,
2014.
[13] S. Satheesh, R. S. Kumar, K. Prasad and K. J. Reddy, "Skull removal of noisy magnetic resonance brain images using contourlet transform and morphological operations," in Computer Science and Network Technology (ICCSNT), 2011 International Conference on, pp.
2627-2631,2011.
[14] M. Kazmi, A. Aziz, P. Akhtar, A. Maftun and W. Bin Afaq, "Medical image denoising based on adaptive thresholding in contourlet domain," in Biomedical Engineering and Informatics (BMEI), 2012 5th International Conference on, pp. 313-318,2012.
[15] J. A. Stark, "Adaptive image contrast enhancement using generalizations of histogram equalization," Image Processing, IEEE Transactions on, vol. 9, pp. 889-896, 2000.
[16] W. Z. W. Ismail and K. S. Sim, "Contrast enhancement dynamic histogram equalization for medical image processing application,"
International Journal of Imaging Systems & Technology, vol. 21, pp. 280-289, 09, 2011.
[17] S. S. Chong, K. S. Sim and M. Nia, "Modified HL contrast enhancement technique for breast MR images," in Signal and Image Processing Applications (ICSIPA), 2013 IEEE International Conference on, 2013, pp. 360-364.
[18] T. Tan, K. Sim, C. P. Tso and A. Chong, "Contrast enhancement of computed tomography images by adaptive histogram equalization‐application for improved ischemic stroke detection," Int J Imaging Syst Technol, vol. 22, pp. 153-160, 2012.
[19] Z. Al-Ameen, G. Sulong and M. G. M. Johar, "Employing a suitable contrast enhancement technique as a pre-restoration adjustment phase for computed tomography medical images," SERSC International Journal of Bio-Science and Bio-Technology, vol. 5, pp. 73-80, 2013. [20] H. A. Jalab and R. W. Ibrahim, "Texture Enhancement for Medical
Images Based on Fractional Differential Masks," Discrete Dynamics in Nature & Society, pp. 1-10, 01, 2013.
[21] M. Si, L. Fang, F. Hu and S. Si, "Texture enhancement algorithm based on fractional differential mask of adaptive non-integral step," in
Image and Signal Processing (CISP), 2014 7th International Congress on, 2014, pp. 179-183.
[22] J. T. Machado, "Fractional Order Generalized Information," Entropy,
vol. 16, pp. 2350-2361, 06, 2014.
[23] Y. Pu, J. Zhou and X. Yuan, "Fractional differential mask: a fractional differential-based approach for multiscale texture enhancement,"
Image Processing, IEEE Transactions on, vol. 19, pp. 491-511, 2010.
[24] Y. Pu, "Fractional calculus approach to texture of digital image,"
International Conference on Signal Processing Proceedings, ICSP,
vol. 2, / 01 / 01 /, 2007.
[25] J. R. Smith and S. Chang, "Automated binary texture feature sets for image retrieval," in Acoustics, Speech, and Signal Processing, 1996. ICASSP-96. Conference Proceedings., 1996 IEEE International Conference on, pp. 2239-2242, 1996.
[26] H. A. Jalab and R. W. Ibrahim, "Denoising algorithm based on generalized fractional integral operator with two parameters,"
Discrete Dynamics in Nature and Society, vol. 2012, 2012.
[27] J. Hu, Y. Pu and J. Zhou, "A novel image denoising algorithm based on riemann-liouville definition," Journal of Computers, vol. 6, pp. 1332-1338, 2011.
[28] S. M. Youssef, A. A. ElFarag and N. M. Ghatwary, "Adaptive video watermarking integrating a fuzzy wavelet-based human visual system perceptual model," Multimedia Tools Appl, vol. 73, pp. 1545-1573,
2014.
[29] N. Kingsbury, "Image processing with complex wavelets,"
Philosophical Transactions of the Royal Society of London A:
Mathematical, Physical and Engineering Sciences, vol. 357, pp.
2543-2560, 1999.
[30] S. Gunasundari and S. Janakiraman, "A study of textural analysis methods for the diagnosis of liver diseases from abdominal computed tomography," International Journal of Computer Applications, vol. 74, 2013.
[31] H. Guo, X. Li, C. Qing-li and W. Ming-rong, "Image denoising using fractional integral," in Computer Science and Automation Engineering (CSAE), 2012 IEEE International Conference on, 2012,
pp. 107-112.
[32] R. L. Wheeden, Measure and Integral: An Introduction to Real Analysis. CRC Press, 2015.
BIBLIOGRAPHY
Noha M. Ghatwary (BSc’09, MSc’13) is currently a PhD research student at university of Lincoln. Working as a Teaching assistant in Computer Engineering Department at Arab Academy for Science and Technology, Egypt. Her research interest lies in the area of image/video processing, Medical image processing, Video surveillance systems, video watermarking, artificial intelligence and machine learning.
Amr Ahmed (BSc’93, MSc’98, PhD’04, MBCS’05, IEEE-CS’08) is a Senior Lecturer, and the Founder and the Leader of the DCAPI (Digital Contents Analysis, Production, and Interaction: http://dcapi.lincoln.ac.uk) research group at the School of Computer Science, University of Lincoln, UK. His research focuses on the analysis, understanding, and interpretation of digital contents, especially visual contents and Medical Images. Amr’s current research interests include Contents-Based Image/Video retrieval and Medical Image/Video analysis. Amr worked in the industry for several years, including Sharp Labs of Europe (SLE), Oxford (UK), as a Research Scientist, and other Engineering Consultants companies abroad. He also worked as a Research Fellow, at the University of Surrey, before joining the academic staff at the University of Lincoln in 2005. Dr. Ahmed is a Member of the British Computer Society (MBCS) and the IEEE Computer Society. He received his Bachelor’s degree in Electrical Engineering and M.Sc. degree (by research) in Computer and Systems Engineering, from Ain Shams University, Egypt, in 1993 and 1998 respectively, and his Ph.D. degree in Computer Graphics and Animation from the University of Surrey, U.K., in 2004.